


Report Overview
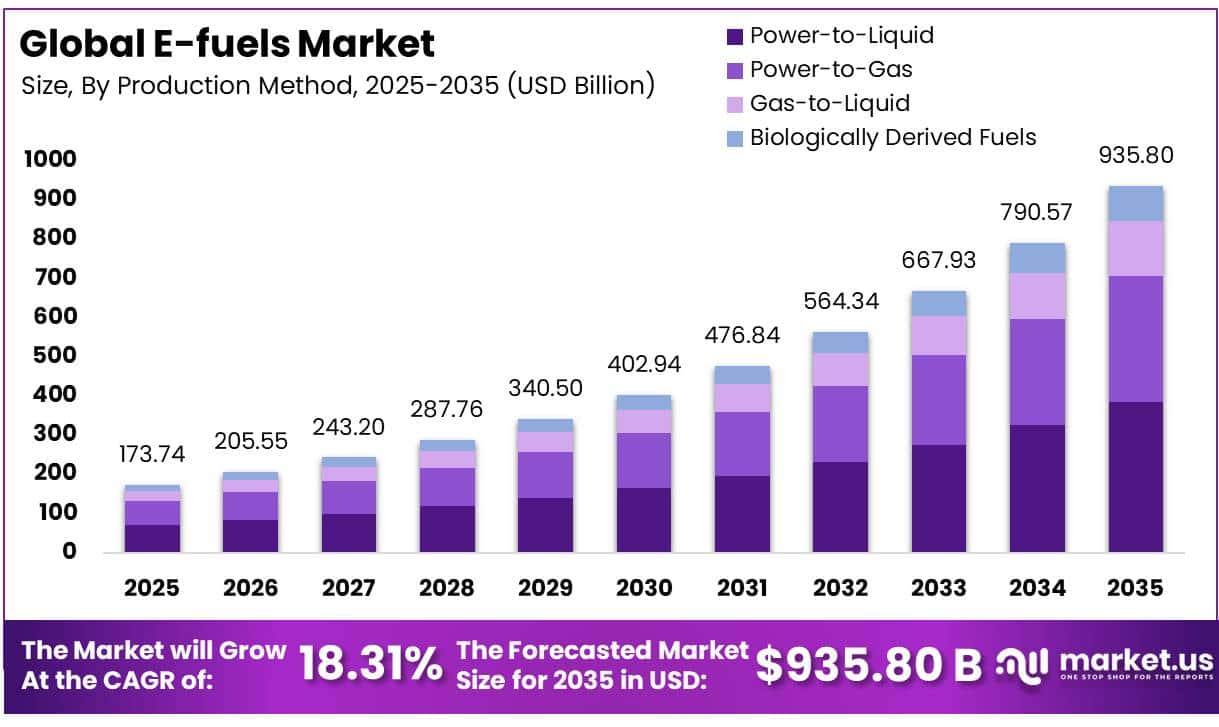
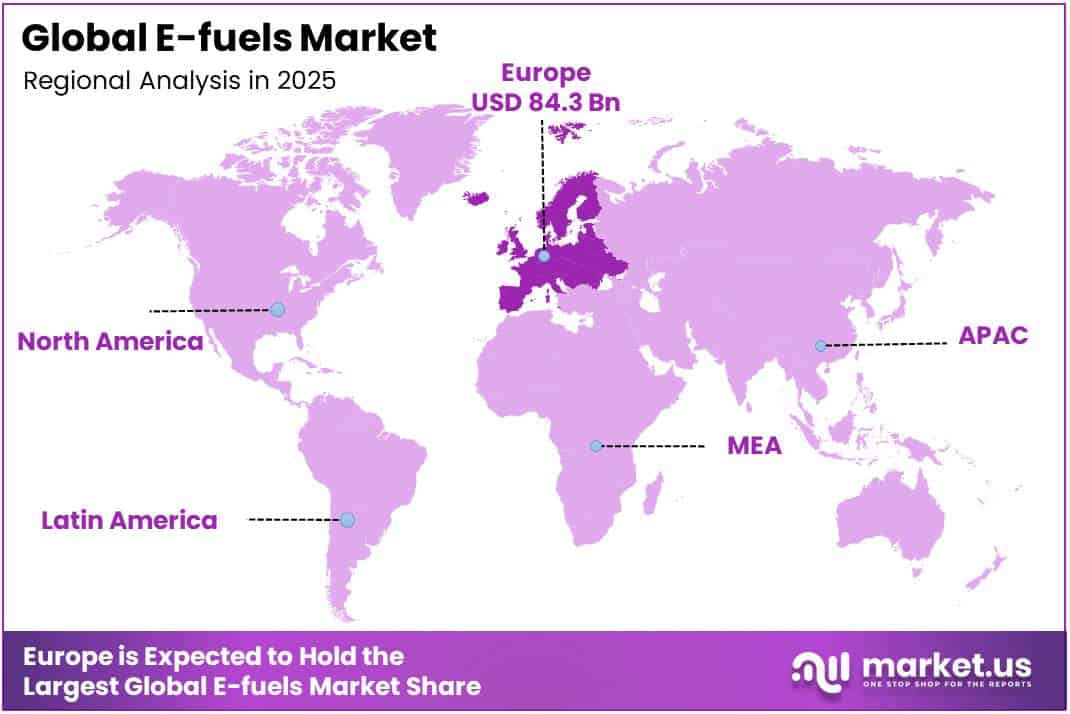
In 2025, the Global E-fuels Market was valued at USD 173.74 billion, and between 2026 and 2035, this market is estimated to register a CAGR of 18.31%, reaching about USD 935.80 billion by 2035. In 2025, Europe led the market, achieving over 48.5% share with a revenue of USD 84.3 Billion.
E-fuels, also called electrofuels, are synthetic energy carriers produced by using low-carbon electricity to generate hydrogen through electrolysis and then combining that hydrogen with captured carbon dioxide or nitrogen. The process can produce e-methanol, e-kerosene, e-gasoline, e-diesel and e-ammonia, creating alternatives for aviation, shipping and industrial activities that are difficult to electrify directly.
- According to the International Energy Agency’s Global Hydrogen Review 2026, hydrogen demand surpassed 100 million tonnes in 2025, although new applications, including synthetic fuels, still represented only a small part of total consumption.
Key Takeaways
- The Global E-fuels Market was valued at USD 173.74 billion in 2025.
- The market is projected to grow at a CAGR of 18.31% and is estimated to reach USD 935.80 billion by 2035.
- On the basis of product type, Ethanol dominated the market, constituting 26.9% of the total market share.
- Based on the production method, Power-to-Liquid dominated the market, with a substantial market share of around 41.1%.
- Based on the technology, Hydrogen Technology (Electrolysis) led the market, comprising 60.3% of the total market.
- On the basis of end use, Automotive dominated the market, constituting 52.7% of the total market share.
- Based on the state, Liquid dominated the market, with a substantial market share of around 78.6%.
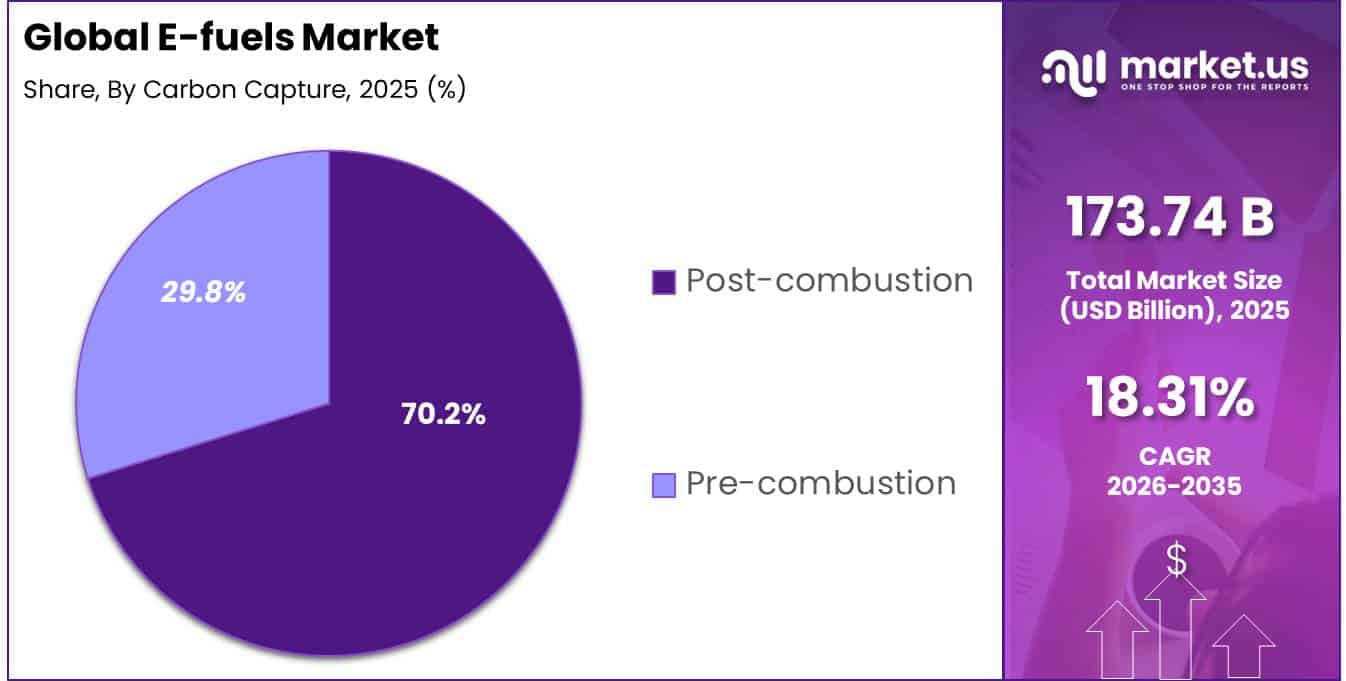
- Based on the carbon capture, Post-combustion led the market, comprising 70.2% of the total market.
- On the basis of e-fuel carbon source, Point Source dominated the market, constituting 82.8% of the total market share.
- In 2025, Europe was the most dominant region in the market, accounting for 48.5% of the total global consumption.
The industrial scenario is moving from pilot facilities toward commercial deployment. According to the IEA, installed global electrolysis capacity doubled in 2025 to exceed 4 GW, while more than 2.5 GW was under construction for operation during 2026. However, the announced low-emissions hydrogen project pipeline fell to 27 million tonnes per year by 2030. Projects already committed could supply about 4.3 million tonnes annually, potentially rising above 6 million tonnes if stronger projects secure final investment decisions in 2026 or 2027. This gap shows that the e-fuels industry has technical momentum but remains constrained by project delays, uncertain buyers and high financing costs.
- According to the IEA, capital spending on low-emissions hydrogen projects reached nearly USD 7 billion in 2025 and could approach USD 10 billion in 2026, with electrolysis representing around 70% of the expected total. Nevertheless, new offtake agreements covered about 1.7 million tonnes per year in 2025, and only 20% were backed by firm commitments. The market therefore depends heavily on long-term purchase contracts, carbon pricing, production incentives and clear fuel-certification rules.
Government mandates are becoming the strongest demand driver. According to the European Commission, ReFuelEU Aviation requires sustainable aviation fuel to represent 2% of fuel supplied at EU airports from 2025, while synthetic aviation fuels must reach 1.2% in 2030 and 35% by 2050. FuelEU Maritime also requires the greenhouse-gas intensity of energy used by ships to decline by 2% from 2025 and by as much as 80% by 2050. The European Hydrogen Bank has selected 15 renewable-hydrogen projects across 5 countries for EUR 992 million in support.
- According to the IEA, more than 40% of announced low-emissions hydrogen volumes are intended for trade by 2030, while over 40,000 km of hydrogen pipelines have been announced for 2035. Around 170 ammonia terminals and 130 methanol terminals are operating, providing a logistics base. Continued cost reductions in renewable power, larger electrolysers, shared port infrastructure and binding fuel mandates could transform e-fuels from a premium decarbonisation option into a scalable industrial fuel platform.
Product Type Analysis
Ethanol dominates the e-fuels market with a 26.9% share, supported by established production capacity and fuel-blending demand.
In 2025, Ethanol held a dominant market position, capturing more than a 26.9% share of the E-fuels Market by Product Type, based on the supplied segmentation. Its leadership is supported by mature production facilities, established distribution networks and its ability to blend with conventional gasoline.
- In December 2025, U.S. fuel ethanol production capacity reached 18,351 million gallons per year, showing that ethanol can be supplied at a significantly larger commercial scale than many newer synthetic fuels. The U.S. Environmental Protection Agency also fixed the 2025 total renewable-fuel requirement at 22.33 billion ethanol-equivalent gallons, creating a stable consumption base for ethanol and related renewable fuels.
E-Gasoline is the fastest-growing segment in the E-fuels Market by Product Type. It is gaining attention because it can work as a drop-in fuel for conventional gasoline vehicles while using renewable hydrogen and captured carbon in its production. In December 2025, the European Commission’s automotive package proposed a 90% tailpipe-emission reduction requirement from 2035, with the remaining 10% addressed through measures that include e-fuels and biofuels. This policy direction improves the long-term business case for e-gasoline, particularly for existing vehicle fleets and transport applications where full electrification may be difficult.
Production Method Analysis
Power-to-Liquid dominates with 41.1% as liquid e-fuels suit existing transport and fuel infrastructure
In 2025, Power-to-Liquid held a dominant market position, capturing more than a 41.1% share. The method remained widely preferred because it converts renewable electricity, hydrogen, and captured carbon into liquid fuels such as e-kerosene and e-methanol. These fuels can support aviation, shipping, and other activities where direct electrification remains difficult.
- The European Commission’s Joint Research Centre reported in 2026 that renewable hydrogen-based synthetic fuels can provide more than 70% greenhouse-gas savings compared with conventional fossil fuels. It also placed leading products, including e-kerosene and e-methanol, at technology-readiness levels of 6–8, showing that several production systems are approaching commercial deployment.
Power-to-Gas is the fastest growing segment. The method uses renewable electricity to produce hydrogen through electrolysis, after which the hydrogen can be stored, supplied directly, or combined with captured carbon to produce e-methane. Its growth is supported by rising demand for flexible energy storage and renewable gas that can be transported through suitable gas infrastructure.
- According to the International Energy Agency’s Global Hydrogen Review 2026, global installed electrolysis capacity doubled to more than 4 GW in 2025, while over 2.5 GW of additional capacity was under construction and expected to begin operations in 2026. This expanding electrolyser base is improving the production foundation required for Power-to-Gas projects across Europe, China, and North America.
Technology Analysis
Hydrogen Technology (Electrolysis) dominates with 60.3% as renewable hydrogen capacity expands
In 2025, Hydrogen Technology (Electrolysis) held a dominant market position, capturing more than a 60.3% share. Electrolysis remained the preferred technology because it produces hydrogen using electricity and water, supporting the production of e-kerosene, e-methanol, e-gasoline, and other synthetic fuels. Its position was strengthened by renewable power expansion, government funding, and increasing demand for low-carbon industrial feedstocks.
- In March 2025, the European Commission reported that proposed renewable hydrogen projects represented around 6.3 GW of electrolyser capacity and planned production of more than 7.3 million tonnes of renewable hydrogen across their operating period. These developments supported larger electrolyser installations and improved the availability of hydrogen required for commercial e-fuel production.
Fischer-Tropsch is the fastest-growing segment in the e-fuels market. The technology converts hydrogen-rich synthesis gas and captured carbon into liquid hydrocarbons that can be refined into synthetic aviation fuel, diesel, and gasoline. Its growth is supported by rising interest in fuels that can work with existing aircraft, engines, pipelines, and storage infrastructure. In January 2026, the European Commission-backed SAFphyre project started work on integrating high-temperature electrolysis with a Fischer-Tropsch reactor for sustainable aviation fuel production.
End Use Analysis
Automotive dominates the e-fuels market with a 52.7% share, supported by strong road-fuel demand.
In 2025, Automotive held a dominant market position, capturing more than a 52.7% share. The segment benefits from the large number of petrol and diesel vehicles already operating worldwide, along with established fuel stations, storage facilities and distribution networks.
- In the United States, motorists consumed 136.53 billion gallons of finished motor gasoline during 2025. Most gasoline supplied to vehicles also contained around 10% ethanol by volume, showing that the automotive fuel system can already manage blended liquid fuels. This existing infrastructure makes it easier for compatible e-gasoline and e-diesel products to enter the road transport market without requiring a complete change in vehicle technology or fuel delivery systems.
Aviation is the fastest growing segment in the e-fuels market. Airlines have limited options for replacing energy-dense liquid fuels, particularly in long-distance flights, making synthetic e-kerosene an important decarbonisation route. In 2025, the European Union introduced a requirement for sustainable aviation fuel to represent at least 2% of the aviation fuel supplied at EU airports. Although this requirement covers several sustainable fuel types, it is encouraging investment in production plants, certification systems and airport fuel infrastructure that can support synthetic aviation fuels.
State Analysis
Liquid e-fuels dominate the market with a 78.6% share due to their easy storage and transport
In 2025, Liquid held a dominant market position, capturing more than a 78.6% share. Liquid e-fuels, including e-kerosene, e-diesel and e-methanol, are suitable for aviation, marine and heavy-duty transport because they can be stored and distributed through existing liquid-fuel infrastructure. Their compatibility with conventional engines also reduces the need for major equipment changes.
- According to the European Commission’s CORDIS platform, the ECO2Fuel project is developing a 1 MW electrochemical system to convert captured carbon dioxide and renewable electricity directly into liquid e-fuels, with the project scheduled to operate through September 2026. This development highlights the growing technical and commercial potential of liquid e-fuel production.
Gas is the fastest growing segment. In 2026, demand continued to develop around renewable hydrogen and e-methane because these fuels can support industrial heating, power balancing and heavy transport applications. Gaseous e-fuels can also use parts of existing gas storage and pipeline infrastructure after suitable technical upgrades. The European Commission’s hydrogen market framework is improving access to infrastructure and connecting buyers with suppliers of renewable hydrogen, e-methane and related fuels. This policy support is helping gaseous e-fuels move from pilot projects toward commercial supply agreements, particularly in industries seeking lower-carbon alternatives to fossil natural gas.
Carbon Capture Analysis
Post-combustion dominates the carbon capture segment with a 70.2% share
Post-combustion held a dominant market position, capturing more than a 70.2% share. Its leadership is supported by its suitability for existing power plants, cement facilities, refineries, and other industrial operations. The technology captures carbon dioxide from exhaust gases after fuel combustion, allowing companies to upgrade established facilities without replacing their main production systems. Its comparatively easier integration, broad industrial applicability, and ability to provide captured carbon dioxide for synthetic fuel production continue to strengthen its adoption in the e-fuels market.
Pre-combustion is the fastest-growing segment in the e-fuels market. The technology separates carbon dioxide before fuel combustion by processing gasified feedstock into hydrogen-rich synthesis gas. This approach produces a concentrated carbon dioxide stream, making separation more efficient and supporting its use in integrated hydrogen and e-fuel production facilities. Rising investment in clean hydrogen, gasification, and low-emission industrial systems is improving the commercial potential of pre-combustion capture, particularly in newly developed energy and chemical production projects.
E-Fuel Carbon Source Analysis
Point Source dominates the e-fuels carbon-source segment with 82.8% share
Point Source held a dominant market position, capturing more than 82.8% share. Its leadership is supported by the easy availability of concentrated carbon dioxide from power plants, refineries, cement facilities and natural gas operations. Carbon collected from these sites is easier to capture, transport and use than carbon taken directly from the atmosphere. Existing industrial infrastructure also helps e-fuel producers secure a steady carbon supply while reducing technical complexity and operating costs. These advantages continue to strengthen the use of point-source carbon in synthetic fuel production.
Direct Air Capture is the fastest-growing segment in the e-fuels carbon-source market. The technology collects carbon dioxide directly from the surrounding air, allowing e-fuel plants to operate without depending on nearby industrial emission sources. This flexibility helps producers locate facilities close to renewable energy and green hydrogen projects. Direct Air Capture also supports a closed carbon cycle, making it suitable for e-kerosene, e-methanol and other synthetic fuels. Continued improvements in capture materials, energy efficiency and plant design are expected to support its wider commercial adoption.
Key Market Segments
By Product Type
- Ethanol
- E-Gasoline
- E-Diesel
- E-Kerosene
- E-Methanol
- E-Methane
- Hydrogen
- Others
By Production Method
- Power-to-Liquid
- Power-to-Gas
- Gas-to-Liquid
- Biologically Derived Fuels
By Technology
- Fischer-Tropsch
- Hydrogen Technology (Electrolysis)
- Reverse-Water-Gas-Shift (RWGS)
By End Use
- Automotive
- Aviation
- Marine
- Industrial
- Railway
- Others
By State
- Liquid
- Gas
By Carbon Capture
- Post-combustion
- Pre-combustion
By E-Fuel Carbon Source
- Point Source
- Smokestack
- Gas Well
- Direct Air Capture
Driver Analysis
EU ReFuelEU Aviation e-SAF Sub-Mandate
ReFuelEU Aviation, in force since January 2025, creates a hard-law demand floor that converts e-fuels from a voluntary decarbonization play into a statutory compliance input for every fuel supplier operating at EU airports. The regulation requires a 2% overall SAF blending share from 2025, rising to 6% by 2030 (including a mandatory 1.2% e-SAF sub-quota), and ultimately 70% SAF with a 35% synthetic-fuel component by 2050. Because e-SAF production costs were estimated by EASA at roughly EUR 7,700 per tonne against a fossil comparator near EUR 700-1,000 per tonne, non-compliant suppliers face penalty exposure close to EUR 14,000 per tonne, which structurally forces refiners and airlines to pre-purchase capacity through long-dated offtake agreements rather than spot procurement.
This shifts the commercial model from transactional fuel purchasing to project-financed, decade-long power purchase and offtake structures similar to LNG contracting, and it explains why the Dutch government just cleared EUR 290 million in state aid for domestic e-SAF capacity in July 2026 to de-risk early-mover plants. The sub-quota’s build-up phase between 2026 and 2030 is the single largest identifiable demand catalyst in the entire e-fuels complex given aviation’s limited electrification alternatives.
Driver Impact Analysis
| Driver | (~) % Impact on CAGR Forecast | Geographic Relevance | Impact Timeline |
|---|---|---|---|
| EU ReFuelEU Aviation e-SAF sub-mandate | +3.2% | EU core (27 member states), UK spill-over corridors | Medium term (2-4 years) |
| RED III RFNBO transport target | +2.4% | EU core, EEA (Norway, Iceland) | Medium term (2-4 years) |
| IMO Net-Zero Framework GHG Fuel Intensity pricing | +2.8% | Global shipping corridors, APAC bunkering hubs (Singapore, Fujairah), EU ports | Long term (≥ 4 years) |
| EU ETS carbon price tightening | +1.6% | EU core, EEA | Short term (≤ 2 years) |
| US 45V hydrogen credit phase-out | -1.8% | North America core, indirect Canada/Mexico feedstock chains | Short term (≤ 2 years) |
| Electrolyzer and DAC cost deflation | +1.9% | Global, concentrated in Chile, Germany, Australia, Middle East, US Gulf Coast | Long term (≥ 4 years) |
Restraint Analysis
High levelized cost of e-fuels
The first and most material drag on the 2026–2035 e-fuels CAGR is the structurally high levelized cost of production, with modeled e-kerosene and e-diesel unit costs still in the range of 3–5 times fossil-equivalent fuels on an energy-adjusted basis, translating into a 25–40 USD/MWh cost premium versus historical jet and marine fuels and compressing operator margins by 300–500 basis points where fuel is 20–30% of operating cost. Even under optimistic technology learning curves derived from DOE and ITF/OECD analyses, electrolysis CAPEX in 2026 remains around 600–900 USD/kW, and synthetic fuel plants face total installed CAPEX intensities of 1,500–2,500 USD per annual tonne of output, implying payback periods of 12–15 years at current offtake prices without deep subsidies or contracts for difference.
This cost structure forces airlines and ship operators to cap voluntary e-fuels blends at 10–15% of total fuel consumption, far below the 30–40% penetration required by 2030 to hit many national SAF and maritime decarbonization roadmaps, thereby cutting demand growth by 8–10 percentage points versus unconstrained scenarios over the next decade. On the supply side, developers respond to these economics with slower final investment decisions, typically deferring 20–30% of planned capacity additions beyond 2030 and re-phasing large plants into smaller modules to manage balance sheet risk; this strategic behavior lowers realized capacity growth by an estimated 3–4 percentage points annually and directly maps into the modeled -3.0 percentage point hit to global e-fuels CAGR, as high levelized costs keep the market trapped in a premium niche rather than moving into mass adoption segments.
Restraint Impact Analysis
| Restraint | (~) % Impact on CAGR Forecast | Geographic Relevance | Impact Timeline |
|---|---|---|---|
| High levelized cost of e-fuels | -3.0% | EU, North America, OECD APAC | Medium term (2-4 years) |
| Renewable electricity and green H₂ constraints | -2.4% | EU, India, MENA, Latin America | Long term (≥ 4 years) |
| CO₂ capture and CCU scalability limits | -1.9% | EU industrial hubs, North America Gulf, East Asia | Medium term (2-4 years) |
| Grid, storage, and transmission bottlenecks | -1.6% | India, SE Asia, Sub-Saharan Africa | Long term (≥ 4 years) |
| Policy uncertainty and fragmented standards | -1.5% | Global, with EU–US–APAC corridors | Medium term (2-4 years) |
| Trade barriers and tariff shocks on equipment and feedstocks | -1.2% | North America, EU, Emerging APAC | Short term (≤ 2 years) |
Opportunity Analysis
E-fuels for heavy-duty road and off-road fleets
Deployment of e-fuels into heavy-duty road and off-road fleets such as mining trucks, construction equipment, agricultural machinery, and long-haul trucks constitutes a distinct opportunity because baseline transition pathways in most government energy outlooks emphasize battery-electric and hydrogen fuel cell vehicles, with synthetic drop-in fuels playing only a marginal, often unquantified role. Yet many fleets operate in duty cycles where electrification is constrained by weight, range, or charging infrastructure, especially in emerging markets and rural regions; here, low-carbon e-diesel or e-jet/diesel blends can serve as transition fuels leveraging existing engines and refueling networks. If, by 2035, even 5–8 percent of global heavy-duty diesel consumption were displaced by e-fuels targeted at high-value segments such as mining sites governed by corporate net-zero commitments or logistics corridors subject to stringent CO₂ standards this could unlock incremental TAM of 30–50 billion USD for e-fuels above baseline adoption rates.
Fleet-level economics can be attractive where corporate carbon internal prices range from 50 to 100 USD per tonne, effectively providing a shadow subsidy of 0.12–0.25 USD per liter equivalent on low-carbon fuels; combined with potential reductions in maintenance costs of 5–10 percent from cleaner combustion and the avoidance of new vehicle capex, many operators can realize lifecycle cost parity for targeted duty cycles even with e-fuel price premia of 30–50 percent over conventional diesel. Because regulators have not yet explicitly mandated e-fuels in heavy-duty segments, and many transition roadmaps assume a direct jump to electric or hydrogen, this wedge of demand remains a white space that can add measurable upside to e-fuels growth if suppliers design tailored offerings and contract structures around fleet decarbonization rather than generic fuel sales.
Opportunity Impact Analysis
| Opportunity | (~) % Potential CAGR Upside | Geographic Relevance | Execution Window |
|---|---|---|---|
| Synthetic e-kerosene premium corridors | +2.0% | EU, North America, GCC | Medium term (2–4 years) |
| Maritime e-methanol bunkering hubs | +1.8% | EU ports, APAC emerging, Middle East | Medium term (2–4 years) |
| E-fuels for heavy-duty road and off-road fleets | +1.5% | North America, EU, India | Short–Medium term (≤ 4 years) |
| Power-to-liquid integration with surplus renewables | +1.3% | EU, India, Latin America | Long term (≥ 4 years) |
| Cross-border e-fuels certificates and carbon markets | +1.0% | EU, global OECD | Medium–Long term (≥ 3 years) |
| E-fuels M&A roll-up platforms | +0.8% | Global, especially EU & North America | Short–Medium term (≤ 4 years) |
Challenges Analysis
Electrolyzer & critical mineral bottlenecks
Electrolyzer manufacturing capacity and critical mineral availability constitute a structural bottleneck that slows scaling but does not fully freeze market growth, imposing roughly a 1.2 percentage point drag on e-fuels CAGR compared with unconstrained equipment scenarios. Transport and net-zero scenario analysis from national planning bodies underscores that clean mobility and fuel systems depend heavily on imported cells, critical minerals, and sophisticated electronic components, and these dependencies expose projects to supply-chain risks including 6–12 month procurement delays and capital cost overruns of 10–20% when global demand spikes. Proton-exchange membrane electrolyzers use iridium and platinum-group metals, which government and agency data classify as critical due to limited annual mine output and high geographic concentration; even modest demand shocks can shift iridium prices by 30–50% year-on-year and elongate delivery schedules across 50–100 MW projects.
At project level, these frictions translate into installation timelines stretching from planned 24–30 months to observed 36–42 months, effective capacity utilization factors stuck at 55–65% instead of 80% technical design targets, and per-kilowatt electrolyzer costs staying 15–25% above aspirational learning curve trajectories through 2026. Strategically, firms are pursuing dual-track mitigation: on one side, diversifying electrolyzer technology to rebalance material intensity and qualify more suppliers; on the other, aligning offtake and project schedules with national critical mineral strategies and local manufacturing incentives that aim to increase domestic cell and stack output by factors of 2–3 over 5–7 years. Nonetheless, because mineral extraction, refining capacity, and electrolyzer factories operate with multi-year investment cycles and permitting processes commonly exceeding 36 months, this bottleneck remains a long-horizon operational challenge that steadily erodes growth potential rather than a discrete restraint.
Challenges Impact Analysis
| Challenge | (~) % CAGR Friction Drag | Geographic Relevance | Mitigation Horizon |
|---|---|---|---|
| High energy intensity & cost | -1.8% | EU core, North America, India, East Asia | Long term (≥ 4 years) |
| Electrolyzer & critical mineral bottlenecks | -1.2% | EU regulatory hubs, US, China, resource-dependent APAC | Long term (≥ 4 years) |
| CO₂ sourcing & certification complexity | -1.0% | EU ETS zones, UK, Japan, India, GCC | Medium term (2-4 years) |
| Fragmented multi-agency governance | -0.8% | EU, India, US federal–state interface | Medium term (2-4 years) |
| Talent & engineering capacity gap | -0.7% | EU industrial clusters, North America, emerging APAC | Medium term (2-4 years) |
| Cross-border infrastructure & logistics misalignment | -0.9% | EU maritime corridors, transatlantic routes, APAC shipping hubs | Long term (≥ 4 years) |
Geopolitical Impact Analysis
Impact of Ongoing Wars on E-Fuels
Ongoing conflicts are reshaping the e-fuels market by making energy security as important as decarbonisation. The Russia–Ukraine war pushes Europe away from imported fossil fuels and toward renewable hydrogen, e-methanol and synthetic aviation fuel. The European Commission reported that Russian gas supplied 12% of EU demand in 2025, down from 45% in 2021, strengthening the case for locally produced alternatives. Conflict in the Middle East has disrupted oil, gas and hydrogen-based product flows through the Strait of Hormuz.
- The IEA stated that about 20% of global LNG supply passed through the strait in 2025, while disruption removed more than 300 million cubic metres of LNG supply per day in 2026. These shocks can improve the investment case for e-fuels, especially in aviation, shipping and defence, where fuel security is critical.
However, war also raises electricity, equipment, shipping and financing costs, delaying final investment decisions for capital-intensive projects. Policy support remains the main stabilising force. Under ReFuelEU Aviation, synthetic fuels must represent 1.2% of fuel supplied at EU airports by 2030, and more than 40 European eSAF projects were awaiting investment decisions in December 2025. Therefore, conflict creates near-term cost pressure but stronger strategic demand.
Regional Analysis
Europe Dominates the E-fuels Market
In 2025, Europe held the dominant e-fuels market position, capturing 48.5% share and generating USD 84.3 billion. Its leadership is supported by firm European Union rules, mature renewable-energy infrastructure, active demonstration plants, and strong demand from aviation and maritime operators.
- ReFuelEU Aviation requires sustainable aviation fuel to reach 2% of fuel supplied at EU airports in 2025, while synthetic aviation fuel must reach 1.2% by 2030. The European Commission also estimates that about 6.8 million tonnes of e-fuels will be required for aviation and waterborne transport by 2035, strengthening long-term investment visibility for regional producers and technology suppliers over time.
Asia-Pacific is expected to record the fastest growth as governments and companies scale renewable hydrogen, sustainable aviation fuel, and synthetic-fuel projects. Australia committed AUD 1.1 billion in September 2025 to support low-carbon liquid fuels, including e-fuels, alongside AUD 250 million for emerging production technologies. Singapore created SAFCo in October 2025 and launched a nine-company procurement trial in February 2026, supporting centralized fuel purchasing. The country now targets a 1% sustainable aviation fuel uplift from 2027, increasing to 3% to 5% by 2030.
Key Regions and Countries Covered
- North America
- The US
- Canada
- Europe
- Germany
- France
- The UK
- Spain
- Italy
- Russia & CIS
- Rest of Europe
- APAC
- China
- Japan
- South Korea
- India
- ASEAN
- Rest of APAC
- Latin America
- Brazil
- Mexico
- Rest of Latin America
- Middle East & Africa
- GCC
- South Africa
- Rest of MEA
Key Players Analysis
HIF Global is strengthening its e-fuels position through operating experience and large-scale project development. Its Haru Oni plant in Chile produces e-methanol and e-gasoline, while the planned Paysandú facility in Uruguay requires USD 5.3 billion across four production stages. The project targets up to 876,000 tonnes of e-methanol annually and would recycle approximately 900,000 tonnes of CO₂. HIF also secured an agreement covering around 100,000 tonnes per year of e-methanol, supporting future demand from shipping and industrial customers worldwide effectively.
Liquid Wind AB developed standardized e-methanol facilities designed to produce about 100,000 tonnes annually while capturing roughly 150,000 tonnes of biogenic CO₂ per plant. Its Umeå project targeted operations in 2028 and estimated annual emissions reductions of 180,000 tonnes. However, the parent company was declared bankrupt on May 11, 2026, placing its Swedish, Danish, and Finnish subsidiaries up for sale.
Saudi Arabian Oil Co., known as Aramco, is developing lower-carbon synthetic fuels through demonstration projects, technology investment, and motorsport testing. Its joint project with ENOWA targets synthetic gasoline output of 35 barrels per day using renewable hydrogen and captured CO₂. In 2025, Aramco supplied 100% sustainable fuel to 52 Formula 2 and Formula 3 cars. The company also launched a direct-air-capture test unit with Siemens Energy capable of capturing up to 12 tonnes of CO₂ annually at key Dhahran operations.
Siemens Energy supports the e-fuels value chain through electrolyzers, system integration, digital engineering, and certification technologies. The company supplied equipment for Denmark’s Kassø e-methanol project, including an electrolyzer plant in the 50 MW range. Its technology package for Liquid Wind’s FlagshipTWO concept was designed around 140 MW of electrolysis and 100,000 tonnes of annual e-methanol output. Siemens Energy also expanded electrolyzer-stack manufacturing capacity toward 3 GW annually, strengthening its ability to serve larger power-to-liquid projects and industrial hydrogen demand globally.
The Major Players in the Industry
- Archer Daniels Midland Co.
- Ballard Power Systems, Inc.
- Ceres Power Holdings plc
- Clean Fuels Alliance America
- Climeworks AG
- E-Fuel Corporation
- eFuel Pacific Limited
- Hexagon Agility
- Neste
- Norsk e-Fuel AS
- Arcadia eFuels
- Electrochaea GmbH
- ExxonMobil Corporation
- HIF Global
- LanzaJet, Inc.
- Liquid Wind AB
- Sunfire GmbH
- Synhelion SA
- Zero Petroleum
- Saudi Arabian Oil Co.
- Audi AG
- Siemens Energy
Key Development
- In May 2026, ADM reported Carbohydrate Solutions operating profit of USD 356 million, up 48%, while its ethanol-focused Vantage Corn Processors business improved by USD 94 million. ADM also maintained company-wide capital expenditure guidance of USD 1.3–1.5 billion, supporting further operational efficiency and expansion, though this budget was not limited to e-fuels projects.
- In March 2026, Ballard Power Systems, Inc. expanded its partnership with New Flyer through an agreement covering 500 fuel-cell engines and 50 MW of total capacity, representing the largest single commitment from the bus manufacturer.
Report Scope
| Report Features | Description |
|---|---|
| Market Value (2025) | USD 173.74 Bn |
| Forecast Revenue (2035) | USD 935.80 Bn |
| CAGR (2026-2035) | 18.31% |
| Base Year for Estimation | 2025 |
| Historic Period | 2020-2024 |
| Forecast Period | 2026-2035 |
| Report Coverage | Revenue Forecast, Market Dynamics, Competitive Landscape, Recent Developments |
| Segments Covered | By product type (Ethanol, E-Gasoline, E-Diesel, E-Kerosene, E-Methanol, E-Methane, Hydrogen, Others), By production method (Power-to-Liquid, Power-to-Gas, Gas-to-Liquid, Biologically Derived Fuels), By technology (Fischer-Tropsch, Hydrogen Technology (Electrolysis), Reverse-Water-Gas-Shift (RWGS)), By end use (Automotive, Aviation, Marine, Industrial, Railway, Others), by state (Liquid, Gas), By carbon capture (Post-combustion, Pre-combustion), and By e-fuel carbon source (Point Source, Direct Air Capture) |
| Regional Analysis | North America – The US & Canada; Europe – Germany, France, The UK, Spain, Italy, Russia & CIS, Rest of Europe; APAC– China, Japan, South Korea, India, ASEAN & Rest of APAC; Latin America– Brazil, Mexico & Rest of Latin America; Middle East & Africa– GCC, South Africa, & Rest of MEA |
| Competitive Landscape | Archer Daniels Midland Co., Ballard Power Systems, Inc., Ceres Power Holdings plc, Clean Fuels Alliance America, Climeworks AG, E-Fuel Corporation, eFuel Pacific Limited, Hexagon Agility, Neste, Norsk e-Fuel AS, Arcadia eFuels, Electrochaea GmbH, ExxonMobil Corporation, HIF Global, LanzaJet, Inc., Liquid Wind AB, Sunfire GmbH, Synhelion SA, Zero Petroleum, Saudi Arabian Oil Co., Audi AG, Siemens Energy |
| Customization Scope | Customization for segments, region/country-level will be provided. Moreover, additional customization can be done based on the requirements. |
| Purchase Options | We have three licenses to opt for: Single User License, Multi-User License (Up to 5 Users), Corporate Use License (Unlimited Users and Printable PDF) |





































