


Report Overview
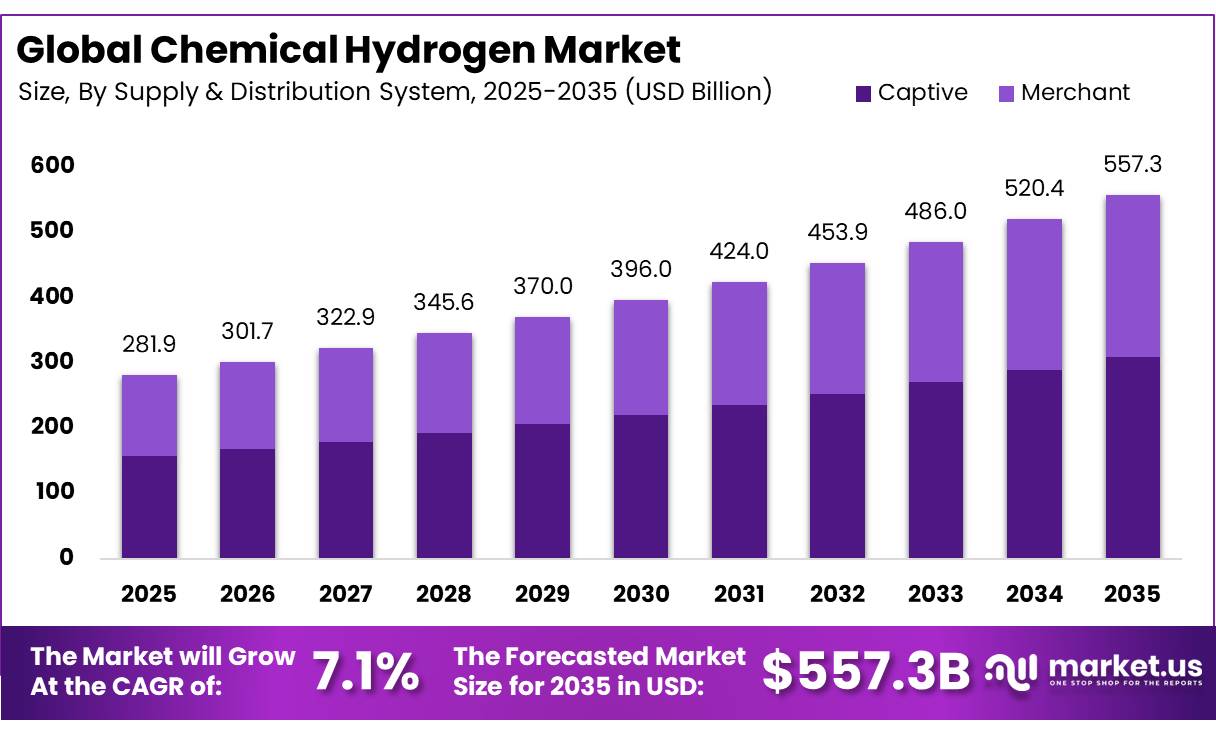
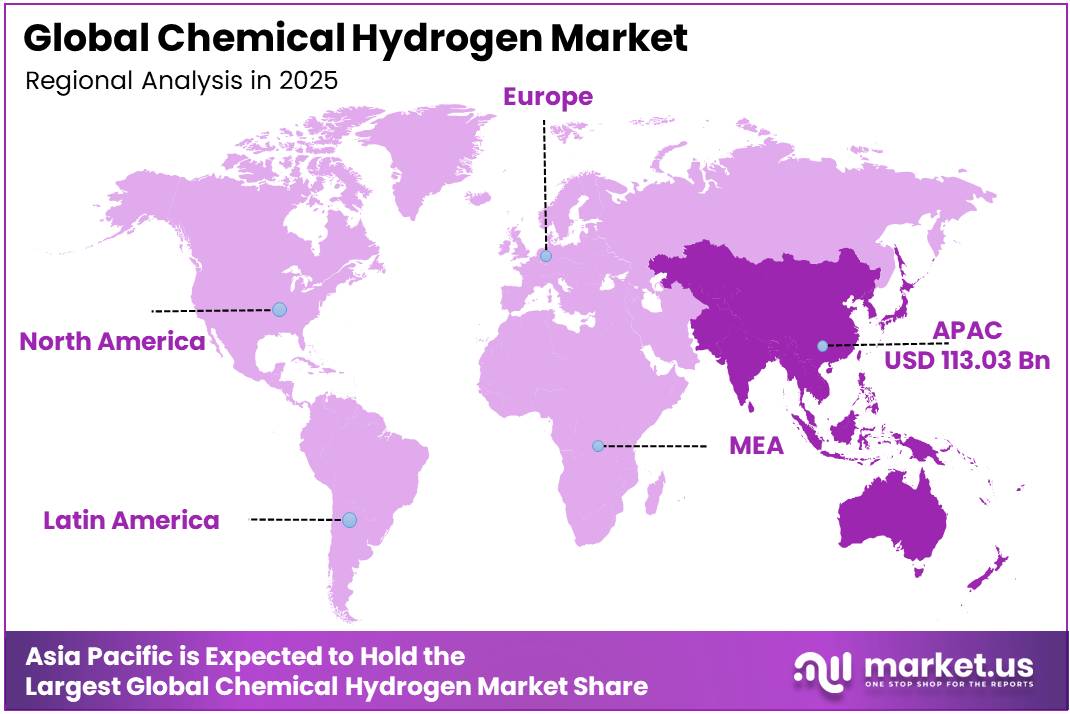
In 2025, the Global Chemical Hydrogen Market was valued at USD 281.9 billion, and between 2026 and 2035, this market is estimated to register a CAGR of 7.1%, reaching about USD 557.3 billion by 2035. Asia Pacific held a dominant market position, capturing more than a 40.1% share, holding USD 113.03 billion in revenue.
The chemical hydrogen industry serves refining, ammonia, methanol, petrochemicals, metals, transport, power, and energy storage. The International Energy Agency reported that global hydrogen demand surpassed 100 million tonnes in 2025, while industry and refining represented almost all consumption. Low emissions hydrogen output increased by 20% to nearly 1 million tonnes. Conventional gray hydrogen therefore remains established, while blue and green hydrogen gain attention as producers seek lower carbon feedstocks and resilient supply chains across industrial markets globally.
- International Energy Agency data show that installed electrolysis capacity doubled during 2025 and exceeded 4 gigawatts, while more than 2.5 gigawatts remained under construction for 2026. Europe accounted for 2 gigawatts of that pipeline. Growth is supported by refinery replacement, cleaner ammonia, industrial heat, heavy transport, and long duration electricity storage applications worldwide.
Key Takeaways
- The global chemical hydrogen market was valued at USD 281.9 billion in 2025.
- The global market is projected to grow at a CAGR of 7.1% and is estimated to reach USD 557.3 billion by 2035.
- On the basis of type, gray hydrogen dominated the market, constituting 65.7% of the total market share.
- Based on the supply and distribution system, captive hydrogen dominated the chemical hydrogen market, with a substantial market share of around 55.6%.
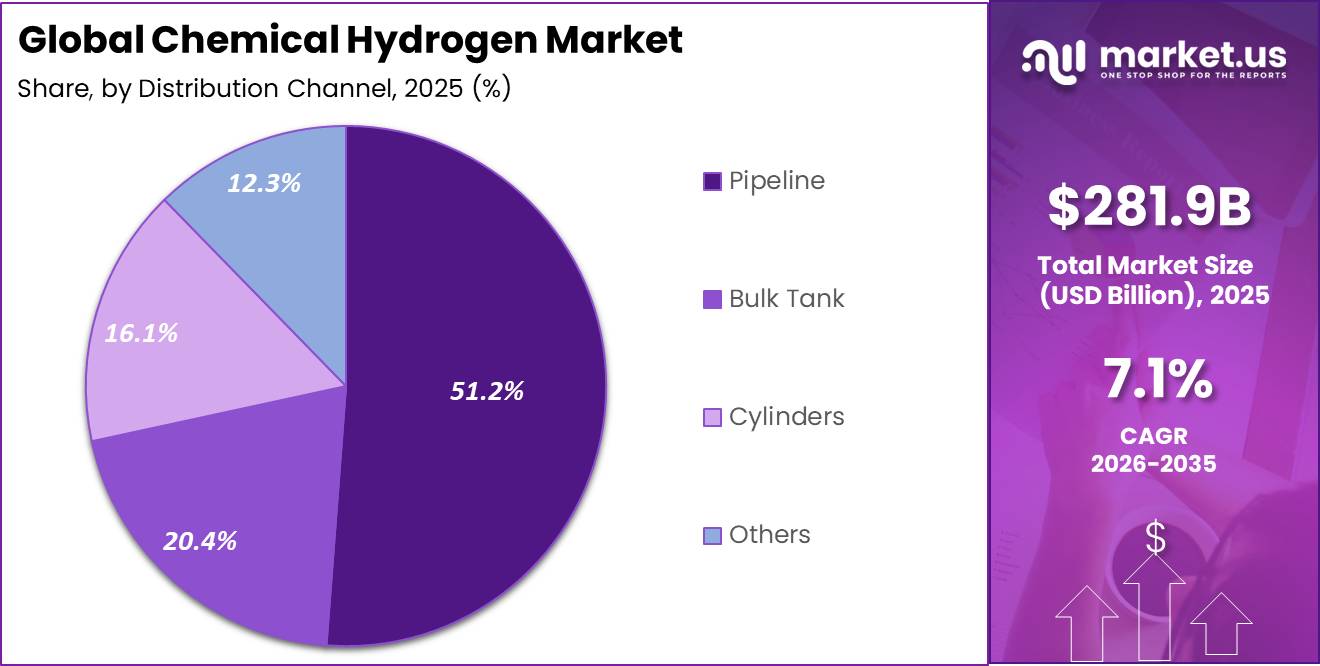
- Based on the distribution channel, pipelines led the market, comprising 51.2% of the total market.
- Among the applications, chemical and petrochemical production held a major share in the chemical hydrogen market, accounting for 53.4% of the market share.
- In 2025, Asia Pacific was the most dominant region in the chemical hydrogen market, accounting for 40.1% of the total global market.
Commercial opportunities are strongest where policy creates reliable offtake. During 2025, new low emissions hydrogen agreements covered 1.7 million tonnes annually, but only 20% involved firm commitments. Projects reaching final investment decision indicate that 2.5 million tonnes could be consumed in refineries and industrial facilities by 2030. Chemical and petrochemical producers therefore remain important early buyers, while merchant supply, pipelines, bulk transport, cylinders, storage facilities, and hydrogen based fuels create revenue opportunities across the value chain.
- Government support is improving project economics and infrastructure development. The European Commission’s third hydrogen auction carried a €1.3 billion budget and attracted 58 bids from 11 countries, requesting €8.4 billion.
Separately, the United States Department of Energy identifies $9.5 billion in hydrogen funding, including $8 billion for regional hubs, $1 billion for electrolysis research and demonstration, and $500 million for manufacturing and recycling. These programs strengthen prospects for cleaner production, distribution, and future industrial adoption.
By Type Analysis
Gray Hydrogen Leads with 65.7% as Green Hydrogen Expands
In 2025, Gray held a dominant market position, capturing more than a 65.7% share. Its strong position came from established use in ammonia, methanol, refining, and other chemical processes. Producers continued using mature steam methane reforming plants, dependable natural gas supply, and existing pipeline networks. These advantages supported steady output and lower operating complexity, although emission concerns encouraged gradual movement toward cleaner hydrogen production routes.
- In July 2025, according to Air Liquide, the ELYgator project included a 200 megawatt electrolyzer, an investment exceeding €500 million, planned annual renewable hydrogen output of 23,000 tonnes, and potential carbon dioxide reductions of up to 300,000 tonnes per operating year.
Green was the growing segment, supported by renewable power expansion, electrolyzer investment, and stronger industrial decarbonisation plans. Chemical producers increasingly assessed green hydrogen for ammonia, methanol, refinery processing, and low-carbon feedstocks. Its wider adoption remained linked to electricity costs, project financing, storage availability, and dependable customer contracts. As larger facilities enter construction and production, green hydrogen is expected to gain a stronger role across chemical and petrochemical operations worldwide over the decade.
Supply & Distribution System Analysis
Captive Hydrogen Leads with 55.6% as Merchant Supply Expands
In 2025, Captive held a dominant market position, capturing more than a 55.6% share. Its leadership reflected the preference of refineries, ammonia plants, methanol facilities, and chemical complexes for dedicated hydrogen production located near consumption sites. Captive systems offered steady availability, controlled operating conditions, lower transport dependence, and closer integration with industrial processes. This arrangement helped users manage purity, pressure, volume, and supply reliability according to plant requirements.
- In October 2025, according to Air Liquide, new long-term hydrogen supply agreements covered two United States refiners, while nearly USD 50 million was allocated to pipeline upgrades, compression systems, and distribution equipment across its Gulf Coast network.
Merchant was the growing segment as more industrial users sought hydrogen without investing in dedicated production assets. Independent suppliers could serve several customers through pipelines, bulk tankers, cylinders, and regional storage networks. This model supported smaller chemical plants, manufacturers, mobility projects, and facilities with changing demand. Merchant supply also improved purchasing flexibility and reduced plant-level operating responsibility. Continued network investment, stronger distribution coverage, and long-term supply contracts are expected to support wider merchant hydrogen adoption.
Distribution Channel Analysis
Pipeline Distribution Leads with 51.2% as Bulk Tank Delivery Expands
In 2025, Pipeline held a dominant market position, capturing more than a 51.2% share. Its leadership reflected the need to move large and steady hydrogen volumes between production plants, refineries, chemical complexes, and industrial users. Pipelines supported continuous delivery, reduced repeated road transport, and helped major customers maintain stable pressure and purity levels over long operating periods. Existing industrial clusters also favored pipeline supply because connected plants could receive hydrogen directly without maintaining frequent unloading schedules.
- In April 2025, according to Linde, its new liquid hydrogen trailer provided a 9-ton payload, 50% more than previous models.
Bulk Tank was the fastest growing segment, supported by customers beyond pipeline networks. Cryogenic tanks and road tankers offered flexible delivery for manufacturers, mobility stations, laboratories, and smaller chemical plants with variable consumption. This channel supplied larger quantities than cylinders without requiring dedicated pipelines. Growth was supported by better tank insulation, safer handling systems, and rising liquid hydrogen availability.
Application Analysis
Chemical and Petrochemical Production Leads with 53.4% as Transportation Accelerates
In 2025, Chemical and Petrochemical Production held a dominant market position, capturing more than a 53.4% share. Hydrogen remained essential for ammonia, methanol, refining, desulfurization, and other chemical processes. Large plants favored reliable, continuous supply because production lines required stable purity, pressure, and volume. Existing reformers, pipelines, storage systems, and integrated facilities also strengthened this application’s leading position across major industrial clusters.
- In September 2025, according to Daimler Truck, five Mercedes-Benz GenH2 trucks completed more than 225,000 kilometers, recorded 285 refuelings, and consumed around 15 tonnes of liquid hydrogen. Average consumption ranged from 6 kilograms to 8 kilograms per 100 kilometers.
Transportation was the fastest growing segment as fuel cell trucks, buses, trains, ships, and material-handling vehicles gained attention for long-distance and high-utilization operations. Hydrogen offered fast refueling and longer operating ranges where battery charging could limit productivity. Growth was supported by vehicle trials, fleet demonstrations, and expanding refueling infrastructure. Heavy-duty freight remained a key opportunity because operators required dependable range, payload capability, and short turnaround times. These advantages supported adoption on routes demanding frequent operation and limited charging downtime.
Key Market Segments
By Type
- Blue
- Green
- Gray
- Other
By Supply & Distribution System
- Captive
- Merchant
By Distribution Channel
- Pipeline
- Bulk Tank
- Cylinders
- Others
By Application
- Transportation
- Power Generation
- Heating
- Energy Storage
- Chemical and Petrochemical Production
- Manufacturing
- Others
Driver Analysis
National hydrogen strategies & decarbonization mandates
The EU’s RED III requires 42% of hydrogen consumed in industry to be renewable by 2030, effectively forcing industrial users that typically rely on grey hydrogen to re‑tool feedstock portfolios and secure certified renewable supply. In parallel, India’s National Green Hydrogen Mission allocates roughly INR 19,744 crore and targets 5 million tonnes per annum of green hydrogen by 2030, with 862 kt/year of production incentivized across 18 companies and 3 GW/year of electrolyser manufacturing capacity allocated to 15 manufacturers as of 2026.
Structural impacts include a shift from commodity‑style spot hydrogen trading toward portfolio contracts indexed to carbon benchmarks, higher capital intensity and bankable cash‑flow profiles for integrated projects (production + transport + industrial offtake), and accelerated replacement of SMR‑based grey hydrogen in chemicals and refining with blue/green hydrogen, supporting an incremental uplift in market CAGR as mandated volumes phase in after 2027.
Drivers Impact Analysis
| Driver | (~) % Impact on CAGR | Geographic Relevance | Impact Timeline |
|---|---|---|---|
| National hydrogen strategies & decarbonization mandates | +2.4% | EU core, U.S., India, East Asia corridors | Medium term (2–4 years) |
| Green hydrogen cost-down & electrolyser scale-up | +2.1% | APAC core, EU, Middle East, India | Medium–Long term (2–6 years) |
| Industrial offtake in refineries, chemicals & steel | +1.9% | EU industrial belts, North America, China, India | Short–Medium term (1–4 years) |
| Hydrogen infrastructure, storage & transport build-out | +1.7% | EU, North America, GCC, APAC ports | Medium–Long term (3–7 years) |
| Incentive schemes & tax credits for clean hydrogen | +1.5% | U.S., EU, India, Japan, South Korea | Short–Medium term (1–4 years) |
| Certification, regulatory frameworks & GH2 standards | +1.3% | EU, India, OECD markets | Medium–Long term (3–6 years) |
Restraint Analysis
High green hydrogen production cost
Despite policy support, green hydrogen remains structurally more expensive than fossil-based chemical hydrogen, with 2025–2026 operational data indicating that renewable-power-based electrolysis can cost two to three times SMR-derived grey hydrogen on a per‑kg basis in many industrial zones once grid tariffs, balancing costs and capacity factor realities are accounted for; climate-driven variability alone is modeled to raise levelized production costs by up to 20% in some global locations, with about 16% of global green hydrogen capacity exposed to such weather-related shocks, tightening margins further.
At a plant level, electrolysers, power and balance-of-plant often consume 60–70% of opex, and capex per kW for PEM and alkaline systems in 2026 remains in the high hundreds of dollars, translating into multi‑hundred million USD investment for 50,000–100,000 tonne/year facilities, while electricity prices in many industrial corridors persist above 50–60 USD/MWh, limiting cost-down potential before 2030.
This cost profile compresses returns, forces developers to rely heavily on subsidies and tax credits, and delays broad substitution of grey hydrogen in chemicals, refining and steel, as many users maintain SMR units running at 1–2 USD/kg equivalent cost for feedstock hydrogen rather than switching to green alternatives; in aggregate, these economics deter new entrants, tighten project finance terms, inflate minimum offtake volumes needed for bankability, and subtract roughly two full percentage points from otherwise achievable market CAGR until cost curves bend significantly later in the decade.
Restraint Impact Analysis
| Restraint | (~) % Impact on CAGR | Geographic Relevance | Impact Timeline |
|---|---|---|---|
| High green hydrogen production cost | -2.3% | EU, U.S., APAC industrial hubs | Medium–Long term (3–7 years) |
| Demand uncertainty & slow offtake | -2.0% | EU, North America, emerging export hubs | Short–Medium term (1–4 years) |
| Project cancellations & delayed FIDs | -1.8% | EU core, global mega-project pipeline | Medium term (2–4 years) |
| Infrastructure and logistics bottlenecks | -1.6% | Middle East export corridors, EU, APAC | Medium–Long term (3–6 years) |
| Regulatory and standardization ambiguity | -1.4% | EU, India, global export trade lanes | Medium term (2–4 years) |
| Equipment, materials and capex inflation | -1.2% | Global, especially non-OECD markets | Short–Medium term (1–3 years) |
Opportunity Analysis
Green hydrogen in hard‑to‑abate industrial clusters
This is a future opportunity rather than a current driver because most hard‑to‑abate sectors remain at pilot or concept stage for hydrogen use, leaving a sizeable untapped TAM that could be activated once costs and policy frameworks align. Today, hydrogen’s industrial use is dominated by oil refining, ammonia and methanol production, with these applications constituting the majority of global hydrogen consumption; however, UNIDO and other industrial analyses highlight the potential for hydrogen to substitute natural gas and coal in high-temperature processes across eco‑industrial parks, including direct reduced iron (DRI) steel, cement kilns, glass furnaces and building materials such as bricks.
Assuming global cement and steel sectors together represent multi‑hundred‑billion‑dollar revenue pools, even a 5–10% penetration of green hydrogen into process heat and reducing-agent roles could translate into tens of billions of dollars in annual hydrogen demand, at volumes in the tens of millions of tonnes per year beyond current baseline trajectories. Unit economics would pivot from commodity gas margins of 10–15% to integrated solutions bundling hydrogen supply with process optimization, emissions guarantees and waste-heat recovery, enabling margin uplift of 300–500 basis points for integrated players while locking in 10–20‑year offtake contracts tied to decarbonization targets.
Strategically, developers can design cluster-based hydrogen ecosystems around major industrial hubs—co‑locating electrolysers, pipelines and storage with steel and cement plants—which reduces logistics costs, raises load factors above 5,000 hours/year, and significantly improves project IRR; if executed at scale between 2028 and 2035, this industrial‑cluster penetration could add roughly 2–3 percentage points of CAGR upside over the baseline, as the chemical hydrogen market transitions from a narrow set of feedstock uses to a broad platform underpinning high‑temperature industrial decarbonization.
Opportunity Impact Analysis
| Opportunity | (~) % Potential CAGR Upside | Geographic Relevance | Execution Window |
|---|---|---|---|
| Green hydrogen in hard-to-abate industrial clusters | +2.6% | EU industrial belts, APAC, Middle East | Medium term (2–4 years) |
| Long-duration energy storage & grid services | +2.3% | North America core, EU, APAC emerging | Medium–Long term (3–6 years) |
| Hydrogen-based maritime & aviation fuels | +2.1% | EU ports, APAC shipping lanes, GCC | Medium term (2–4 years) |
| Blue/green hydrogen M&A roll-ups and platform plays | +1.9% | North America, EU, Middle East | Medium–Long term (3–7 years) |
| Hydrogen-to-power and distributed energy parks | +1.8% | UK, EU, India, ASEAN | Short–Medium term (1–4 years) |
| Byproduct hydrogen valorization in chemicals & refineries | +1.5% | U.S., EU, APAC bulk chemicals | Medium term (2–4 years) |
Challenges Analysis
Multistage supply chain complexity
The green and low‑carbon chemical hydrogen value chain is structurally multistage spanning renewable generation, electrolysers or SMR/ATR with CCS, water treatment, compression/liquefaction, storage, transport and end‑use conversion and academic reviews show that frictions at any link can propagate across the chain, creating persistent operational drag rather than outright market collapse.
Practically, this manifests as longer project lead times, higher system integration costs, and added coordination overhead across power utilities, port authorities, pipeline operators and industrial offtakers; for instance, each corridor may require 100–200 km of dedicated pipeline or equivalent shipping capacity, with design decisions around pressure levels, materials and blending ratios creating complex engineering and regulatory interfaces.
Unit economics suffer from this complexity through higher planning and transaction costs, risk premiums in finance, and sub‑optimal asset utilization when one stage—such as storage or port handling—lags others, leading to capacity under‑use of 10–20% compared with modelled throughput.
Long term, corporates respond by building integrated “hub” organizations, standardizing interfaces, and investing in digital twins and optimization software to manage flows, but this transition requires sustained capex and organizational change over at least one full investment cycle; until those integrated models mature, multistage supply chain complexity imposes a structural friction drag of roughly 1½ percentage points on achievable CAGR, as projects advance but rarely at the theoretical pace implied by demand and policy ambitions.
Challenges Impact Analysis
| Challenge | (~) % CAGR Friction Drag | Geographic Relevance | Mitigation Horizon |
|---|---|---|---|
| Multistage supply chain complexity | -1.6% | EU hubs, APAC corridors, Middle East export | Long term (≥ 4 years) |
| Critical raw material concentration | -1.4% | India, EU, APAC manufacturing belts | Medium–Long term (3–6 years) |
| Hydrogen talent and skills gap | -1.3% | UK, EU, GCC, APAC industrial clusters | Long term (≥ 4 years) |
| Water and siting constraints for GH₂ | -1.2% | India, MENA, arid APAC regions | Medium term (2–4 years) |
| Infrastructure synchronization risk | -1.1% | EU regulatory hubs, India, North America | Long term (≥ 4 years) |
| Policy volatility and investment confidence | -1.0% | UK, EU, emerging hydrogen economies | Medium term (2–4 years) |
Geopolitical Impact Analysis
Geopolitical Realignment and Supply Chain Concentration Reshaping Chemical Hydrogen Production
Current geopolitical tensions are reshaping the chemical hydrogen market through natural gas insecurity, equipment concentration, trade barriers, sanctions, and regional policies. Gray hydrogen remains exposed to gas disruption, while green hydrogen projects depend on traded electrolysers and power equipment. This is changing procurement strategies and encouraging local production.
In May 2025, the European Commission reported that Russian gas imports declined from 150 billion cubic metres in 2021 to 52 billion cubic metres in 2024, while Russia’s share fell from 45% to 19%. This shift is pushing European chemical producers to diversify gas supply and examine domestic low-emission hydrogen.
Electrolyser concentration creates strategic risk. The International Energy Agency reported in 2025 that China represented 65% of installed electrolysis capacity and projects reaching final investment decision, while holding nearly 60% of global manufacturing capacity. Tariffs, standards, transport costs, and maintenance requirements can influence project pricing outside China.
Hydrogen trade plans also face financing and geopolitical uncertainty. The International Energy Agency stated that nearly 45% of announced low-emission hydrogen output was intended for export, exceeding 16 million tonnes annually by 2030, but only 5% had reached final investment decision. This gap is encouraging regional hubs, long-term contracts, diversified suppliers, and local infrastructure investment.
Regional Analysis
Asia Pacific Leads with 40.1% as Middle East and Africa Expands Rapidly
In 2025, Asia Pacific held a dominant position in the Chemical Hydrogen Market, capturing 40.1% of global revenue, valued at USD 113.03 billion. Regional leadership was supported by large refining, ammonia, methanol, and industrial hydrogen demand across China, Japan, South Korea, Southeast Asia, and Australia. The International Energy Agency reported that Southeast Asia consumed 4 million tonnes of hydrogen in 2024, with Indonesia contributing 35% and ammonia production representing nearly half of regional demand.
Middle East and Africa was the fastest-growing region, supported by competitive natural gas access, strong solar and wind resources, export-oriented projects, and expanding industrial decarbonisation plans. The International Energy Agency reported in 2026 that Africa had 31 announced low-emissions hydrogen projects targeting 1.2 million tonnes of production by 2030. Growing investment in ammonia, refining, shipping fuels, and export infrastructure is expected to further strengthen regional supply capabilities and rapidly attract international partnerships across the forecast period.
Key Regions and Countries Covered
- North America
- The US
- Canada
- Europe
- Germany
- France
- The UK
- Spain
- Italy
- Russia & CIS
- Rest of Europe
- APAC
- China
- Japan
- South Korea
- India
- ASEAN
- Rest of APAC
- Latin America
- Brazil
- Mexico
- Rest of Latin America
- Middle East & Africa
- GCC
- South Africa
- Rest of MEA
Key Players Analysis
In 2026, the Chemical Hydrogen Market remained competitive among industrial gas, energy, and equipment suppliers. Air Liquide, Linde plc, Air Products and Chemicals, Inc., and Siemens Energy AG strengthened their positions through production assets, pipeline networks, supply contracts, and hydrogen technology portfolios. Air Liquide expanded its Gulf Coast hydrogen network, while Linde increased renewable electricity sourcing for operations. Air Products advanced large-scale hydrogen and ammonia infrastructure, and Siemens Energy supported the market through electrolyzers and hydrogen-ready power technologies.
Key players focused on securing feedstock, improving plant efficiency, and linking production with storage, transport, and end-use customers. Regional networks and contracts supported retention in refining, chemicals, electronics, mobility, and power applications. Companies also emphasized carbon capture, renewable hydrogen, ammonia conversion, and equipment localization to reduce project risk. Competitive strength depended on project execution, financing discipline, safety performance, and the ability to deliver reliable hydrogen at scale.
Market Key Players
- Air Liquide S.A.
- Linde plc
- Air Products and Chemicals, Inc.
- BP p.l.c.
- Shell plc
- Saudi Arabian Oil Company (Saudi Aramco)
- Siemens Energy AG
- Nel ASA
- Sinopec (China Petroleum & Chemical Corp.)
- Engie SA
- Others
Key Development
- In July 2026, Air Liquide announced an investment of more than USD 160 million to build, own, and operate a large-scale gas production facility in Arizona. The facility is scheduled to begin operations in 2028 and will produce ultra-pure, low-carbon hydrogen using carbon capture technology for advanced semiconductor manufacturing.
- In May 2026, Nel ASA commercially launched its next-generation pressurized alkaline electrolyser platform after more than eight years of development and full-scale prototype testing. The standardized system targets turnkey costs below USD 1,450 per kilowatt for a 25-megawatt plant and is designed to reduce capital expenditure by 40% to 60%.
- In June 2026, Air Products announced that it was finalizing a marketing and distribution agreement with Yara International for renewable ammonia produced by the NEOM Green Hydrogen Project in Saudi Arabia. The proposed arrangement would use Yara’s global supply network to market and deliver renewable ammonia from the project.
Report Scope
| Report Features | Description |
|---|---|
| Market Value (2025) | USD 281.9 Bn |
| Forecast Revenue (2035) | USD 557.3 Bn |
| CAGR (2026-2035) | 7.1% |
| Base Year for Estimation | 2025 |
| Historic Period | 2020-2024 |
| Forecast Period | 2026-2035 |
| Report Coverage | Revenue Forecast, Market Dynamics, Competitive Landscape, Recent Developments |
| Segments Covered | By Type (Blue, Green, Gray, and Other), By Supply & Distribution System (Captive and Merchant), By Distribution Channel (Pipeline, Bulk Tank, Cylinders, and Others), By Application (Transportation, Power Generation, Heating, Energy Storage, Chemical and Petrochemical Production, Manufacturing, and Others) |
| Regional Analysis | North America – The US & Canada; Europe – Germany, France, The UK, Spain, Italy, Russia & CIS, Rest of Europe; APAC– China, Japan, South Korea, India, ASEAN & Rest of APAC; Latin America– Brazil, Mexico & Rest of Latin America; Middle East & Africa– GCC, South Africa, & Rest of MEA |
| Competitive Landscape | Air Liquide S.A., Linde plc, Air Products and Chemicals, Inc., BP p.l.c., Shell plc, Saudi Arabian Oil Company (Saudi Aramco), Siemens Energy AG, Nel ASA, Sinopec (China Petroleum & Chemical Corp.), Engie SA, and Others. |
| Customization Scope | Customization for segments, region/country-level will be provided. Moreover, additional customization can be done based on the requirements. |
| Purchase Options | We have three licenses to opt for: Single User License, Multi-User License (Up to 5 Users), Corporate Use License (Unlimited Users and Printable PDF) |





































