
Quick Navigation
Report Overview
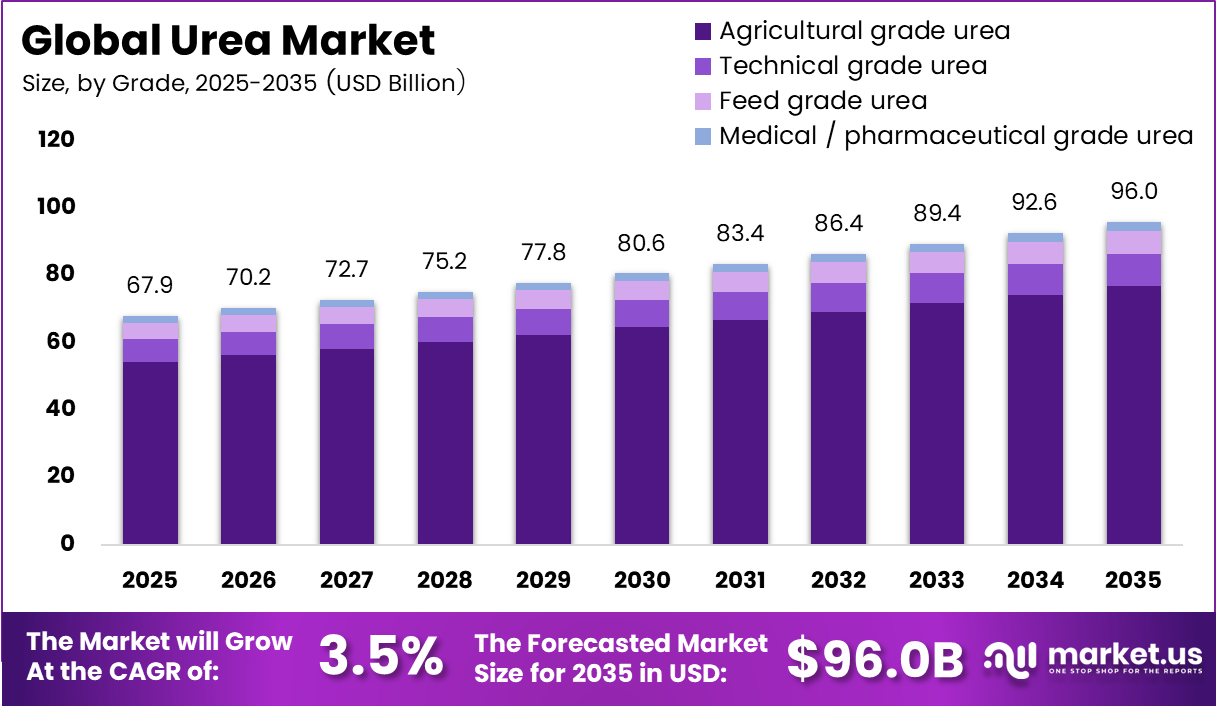
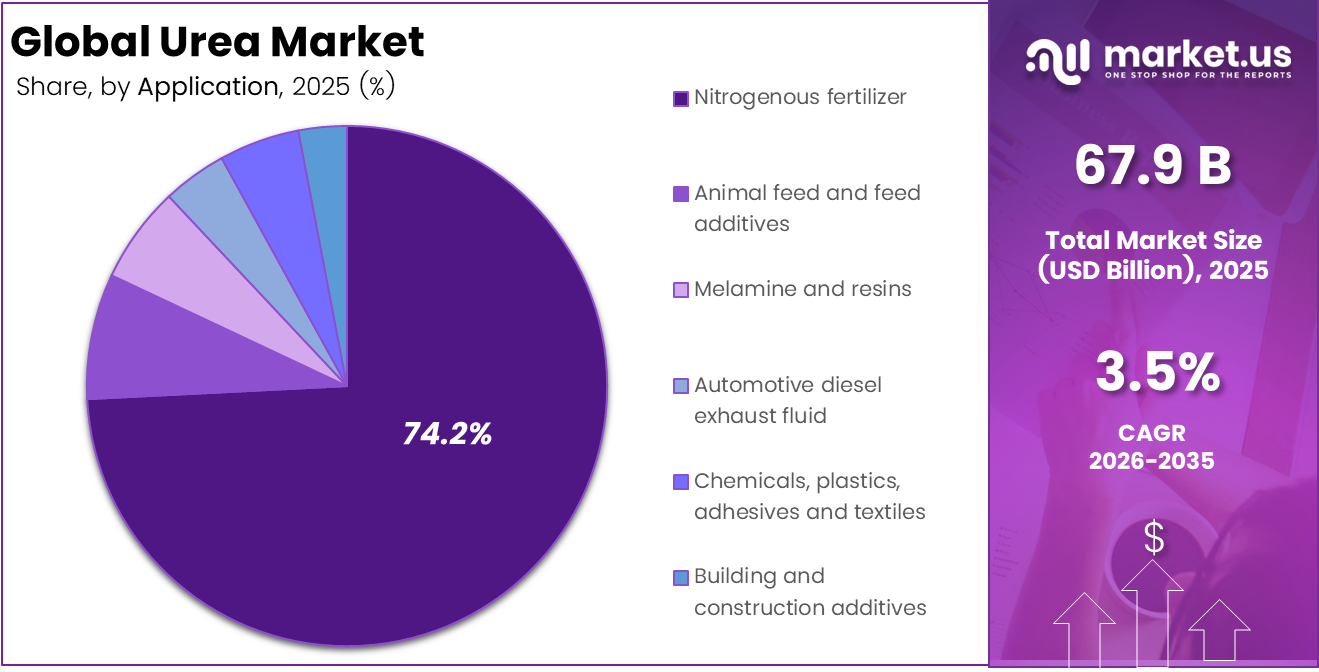
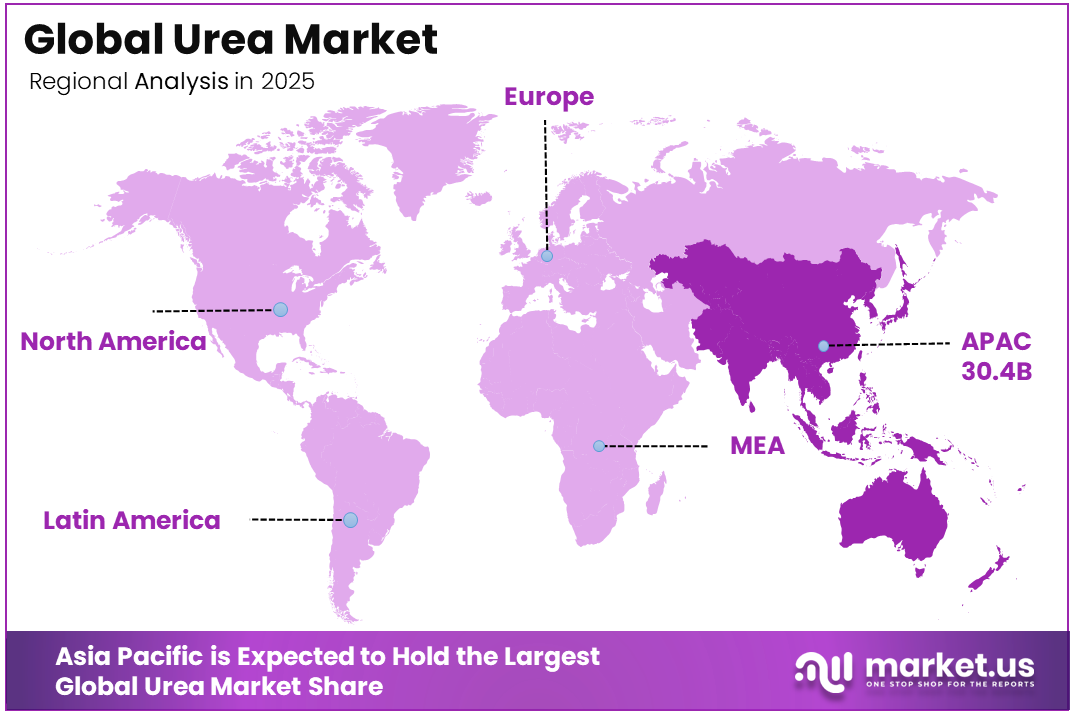
The Global Urea Market was valued at USD 67.9 billion, and between 2026 and 2035, this market is estimated to register a CAGR of 3.5%, reaching about USD 96.0 billion by 2035. Asia Pacific held a dominant market position, capturing more than a 44.8% share, holding USD 30.4 billion in revenue.
The global urea market is an important part of the agricultural and industrial sectors, thanks to its extensive use as a nitrogen-rich fertilizer and a raw material in numerous production processes. Urea is the most widely used nitrogen fertilizer in the world because of its high nitrogen content, low cost, simplicity of storage, and compatibility with a variety of crops such as wheat, rice, corn, and sugarcane.
A growing global population, rising food consumption, and increased pressure to improve agricultural production are all important factors driving market demand. The market also benefits from government fertilizer subsidy programs, agricultural modernization projects, and the growing adoption of precision farming technologies aimed at enhancing nutrient efficiency.
- According to the Food and Agriculture Organization, global cereal production remained high at around 2.84 billion tonnes in 2024, highlighting the continued need for nitrogen-based fertilizers such as urea to support crop productivity and food security.
Beyond agriculture, urea plays an important role in industrial applications, including the production of melamine, urea-formaldehyde resins, adhesives, plastics, textiles, pharmaceuticals, and diesel exhaust fluid (DEF) used in selective catalytic reduction systems to reduce vehicle emissions. The increasing emphasis on environmental sustainability is encouraging the development of enhanced-efficiency fertilizers such as coated, stabilized, and controlled-release urea products that improve nutrient utilization while minimizing environmental impact.
Key Takeaways
- The global urea market was valued at US$67.9 billion in 2025.
- The global urea market is projected to grow at a CAGR of 3.5% and is estimated to reach US$96.0 billion by 2035.
- By Grade, agricultural grade urea dominated the global urea market, accounting for 80.1% of the total market share.
- Based on product type, granular urea led the market, constituting 59.8% of the total market share.
- By application, nitrogenous fertilizer emerged as the dominant segment, representing 74.2% of the global urea market.
- Based on channel, the agriculture sector held the largest share, accounting for 75.4% of the total market demand.
- In 2025, the Asia Pacific was the leading regional market for urea, capturing 44.8% of the global market share.
Grade Analysis
Agricultural Grade Urea represents the dominant Segment in the Market.
Agricultural Grade Urea dominated the global urea market, with 80.1% of the overall market share. Its strong leadership stems mostly from the widespread use of urea as a nitrogen-based fertilizer in the cultivation of major crops such as wheat, rice, corn, sugarcane, and oilseeds.
Farmers choose agricultural-grade urea because of its high nitrogen concentration, low cost, ease of application, and compatibility with modern farming procedures. Furthermore, the increased use of precision agriculture and balanced nutrient management strategies is driving demand, reinforcing the segment’s dominating position in the worldwide urea market.
Technical grade urea accounts for a significant share of the global urea market due to its extensive use in the production of resins, adhesives, chemicals, and various industrial applications. Demand for this segment is supported by the expansion of manufacturing activities, construction projects, and specialty chemical production worldwide.
Product Type Analysis
Granular a significant product type.
Granular urea dominated the global urea market, with 59.8% of the total market share. Its strong market position is due to its superior physical qualities, which include larger and more uniform particle size, less dust generation, increased flowability, and greater moisture resistance during storage and transportation.
These qualities make granular urea ideal for bulk handling and mechanized fertilizer application systems in modern agriculture. The product also promotes more consistent nutrient distribution across fields, hence increasing crop productivity and fertilizer efficiency. Rising adoption of precision farming technologies, rising demand for high-efficiency fertilizers, and increased investments in agricultural modernization in both established and emerging nations all contribute to the granular urea segment’s global market leadership.
Application Analysis
Nitrogenous fertilizers are the Most Widely Used Application.
Nitrogenous fertilizer dominated the global urea market, with 74.2% of the overall market share. The segment’s dominance stems from urea’s vital position as one of the most often utilized nitrogen fertilizers for increasing agricultural yields and soil fertility. Its high nitrogen concentration, low cost, and compatibility for a wide range of crops, including rice, wheat, corn, and sugarcane, make it an indispensable input in modern agriculture.
Rising global food demand, increased pressure to improve agricultural output, and government-supported fertilizer subsidy schemes in major farming economies all contribute to continued high consumption. Furthermore, the increased use of precision agriculture and balanced nutrient management approaches is driving up demand for urea-based fertilizers worldwide.
Automotive diesel exhaust fluid (DEF) is steadily increasing in use as vehicle pollution standards require urea-based solutions to reduce nitrogen oxides. Furthermore, chemicals, plastics, adhesives, and textiles use urea as a vital raw material in a variety of industrial processes, while building and construction additives make up a smaller share, serving specialized applications in construction chemicals and associated products.
Channel Analysis
Agriculture Urea Held a Major Share of the Urea Market.
Agriculture dominated the global urea market by channel, with 75.4% of the overall market share. The segment’s success is mostly due to the widespread use of urea as a nitrogen-rich fertilizer to increase crop yield and sustain global food production. Growing population, rising food consumption, and the need to maximize agricultural output on limited arable land continue to boost demand for urea in major farming regions.
Government fertilizer subsidy programs, increased use of new farming techniques, and more understanding of balanced nutrient management all help to boost the segment’s position. The agricultural industry continues to be the major consumer of urea due to its low cost, high nitrogen concentration, and effectiveness across a wide range of crops.
Meanwhile, the chemical sector is a large market, with urea used in the production of resins, adhesives, melamine, and other industrial chemicals. The automobile industry is seeing increased demand for urea-based diesel exhaust fluid (DEF) to reduce vehicle emissions and meet environmental standards. Medical and healthcare applications account for a smaller but more specialized part, aided by the use of pharmaceutical-grade urea in dermatologic and therapeutic goods.
Key Market Segments
By Grade
- Agricultural-grade urea
- Technical grade urea
- Feed-grade urea
- Medical/pharmaceutical grade urea
By Product Type
- Granular urea
- Prilled urea
- Other product types
By Application
- Nitrogenous fertilizer
- Animal feed and feed additives
- Melamine and resins
- Automotive diesel exhaust fluid
- Chemicals, plastics, adhesives and textiles
- Building and construction additives
By Channel
- Agriculture
- Chemical industry
- Automotive
- Medical and healthcare
- Building and construction
- Other end-use industries
Opportunity Analysis
Green / Low-Carbon Urea via Decarbonized Ammonia Feedstock
The EU’s Carbon Border Adjustment Mechanism (CBAM), fully operative from January 2026, is imposing a direct carbon cost of 10–15% on conventional urea imports, a penalty projected to escalate to 45% by 2030 as EU ETS free allowances phase out and carbon prices climb. This is not a baseline driver; it is a structural market bifurcation event that is creating an entirely new premium-product tier of green and blue urea, which today carries near-zero commercial volume in global trade but commands structurally higher margins.
Sub-Saharan Africa represents one of the most quantitatively underserved fertilizer markets on earth: the continent holds over 60% of the world’s remaining uncultivated arable land yet consumes less than 5% of global fertilizer output, with application intensity in Sub-Saharan nations averaging below 20 kg/ha compared to the global average of 135 kg/ha.
Opportunity Impact Summary Table
| Opportunity | (~) % Potential CAGR Upside | Geographic Relevance | Execution Window |
|---|---|---|---|
| Green / Low-Carbon Urea via Decarbonized Ammonia Feedstock | +2.8% | EU, North America, Japan, South Korea | Medium term (2–4 years) |
| Sub-Saharan Africa & South Asia Greenfield Market Penetration | +2.2% | Sub-Saharan Africa, Bangladesh, Pakistan, Myanmar | Short–Medium term (1–4 years) |
| Automotive-Grade Urea (DEF/AdBlue) Vertical Expansion | +1.7% | APAC (India, China, SE Asia), EU, North America | Short term (≤ 2 years) |
| Enhanced Efficiency / Nano-Urea Product Premiumization | +2.0% | India, Brazil, Southeast Asia, North America | Medium term (2–4 years) |
| Industrial Non-Agricultural Urea Applications (UF Resins, CCUS, Pharma) | +1.5% | China, ASEAN, North America, EU | Medium–Long term (3–5 years) |
| M&A-Led Consolidation & Vertical Integration Roll-Up | +1.3% | North America, the Middle East, EU | Short–Medium term (2–4 years) |
Challenges Analysis
Natural Gas Feedstock Volatility
Natural gas accounts for 60–80% of ammonia and urea’s variable production costs, making producer margins highly exposed to energy-market volatility. With granular urea exceeding $700 per tonne in early 2026 and global prices rising sharply year on year, gas-linked producers face rapid cost inflation that subsidy-capped markets cannot fully absorb, potentially causing an 8–12 percentage-point swing in gross margins.
Reducing this exposure requires multi-year hedging, long-term LNG contracts covering at least 70% of supply, and relocating production closer to low-cost or stranded-gas reserves. However, these measures can take 2–4 years to implement and may temporarily slow growth as capital is redirected from capacity expansion toward feedstock security.
Challenges Impact Summary Table
| Challenge | (~) % CAGR Friction Drag | Geographic Relevance | Mitigation Horizon |
|---|---|---|---|
| Natural gas feedstock volatility | -1.1% | EU hubs, India, NE Asia importers | Medium term (2–4 yrs) |
| Strait of Hormuz logistics friction | -0.8% | APAC/India corridors, MENA exporters | Short term (≤2 yrs) |
| Chinese export-quota unpredictability | -0.9% | India, Brazil, SE Asia buyers | Medium term (2–4 yrs) |
| CBAM carbon-cost compliance | -0.7% | EU import hubs, MENA/CIS suppliers | Long term (≥4 yrs) |
| Nutrient-efficiency demand erosion | -0.6% | India’s core, EU regulatory zones | Long term (≥4 yrs) |
| Green-urea capex & talent deficit | -0.5% | EU, India, North America | Long term (≥4 yrs) |
Driver Analysis
Natural Gas Feedstock Volatility and Supply-Chain Risk
Feedstock economics dominate urea unit costs, with natural gas accounting for 70–80% of total production cost and over 70% of the variable cost of the upstream ammonia. This creates direct pass-through: when 2025–2026 energy and geopolitical shocks, notably tensions around the Strait of Hormuz, tightened supply, global benchmarks moved from a ~USD 380/MT contract level toward Chinese FOB floors of USD 660–670/MT, with a USD 20/MT premium applied to India-bound cargoes.
Strategically, this volatility reshapes procurement away from spot exposure toward long-term offtake contracts and price-adjustment clauses, while widening the cost gap between cheap-gas Gulf producers and high-cost Western European plants. The net effect is a short-term ~+0.9% value uplift to the forecast, driven by price-led revenue expansion rather than volume, with the caveat that easing gas prices or new capacity could moderate it.
Drivers Impact Summary Table
| Driver | (~) % Impact on CAGR Forecast | Geographic Relevance | Impact Timeline |
|---|---|---|---|
| Driver | (~) % Impact on CAGR Forecast | Geographic Relevance | Impact Timeline |
| Food security & rising nitrogen demand | +1.5% | APAC core, Africa, South America | Long term |
| Natural gas feedstock volatility & Hormuz supply risk | +0.9% | MENA exporters, EU, India | Short term |
| Import-substitution capacity buildout (India, Nigeria) | +0.8% | India, West Africa | Medium term |
| EU CBAM carbon pricing | +0.7% | EU imports, MENA/CIS suppliers | Medium term |
| Green ammonia / low-carbon urea transition | +1.1% | India, Gulf, EU, China | Long term |
| Coated & nano (controlled-release) urea shift | +0.6% | North America, EU, India | Medium term |
Restraint Analysis
Strait of Hormuz Supply Chokepoint
The single most acute restraint of the baseline year originates at the Strait of Hormuz, where escalating Iran-linked maritime conflict has collapsed daily transits from roughly 130 vessels to single digits, a decline exceeding 95%, effectively stalling an estimated one-third of global seaborne fertilizer trade, or 3-4 million tonnes per month of urea and ammonia that cannot reach buyers. The quantitative bottleneck is severe because the Middle East accounts for nearly one-quarter of global urea exports, and the disruption drove nitrogen prices above $850/MT in April 2026, an 80% surge in roughly eight weeks, with granular grades spiking over 50% in a single five-week window.
The transmission mechanism is compounded by war-risk insurance withdrawal: protection-and-indemnity clubs have pulled cover and cargo insurers have cancelled policies, forcing vessel operators to abandon sailings and shrinking the effective shipping pool independent of underlying production. Strategically, this manifests as landed-cost inflation of 15-20% for import-dependent buyers in H1 2026, demand destruction at the farm gate as price-sensitive smallholders defer application, and a -2.5 percentage-point drag on the volumetric forecast that should partially reverse as the World Bank projects ~60% price appreciation in 2026, easing into 2027 once corridor flows and gas prices normalize.
Restraint Impact Summary Table
| Restraint | (~) % Impact on CAGR Forecast | Geographic Relevance | Impact Timeline |
|---|---|---|---|
| Strait of Hormuz supply chokepoint | -2.5% | APAC import corridors, EU, North America | Short term (≤2 yrs) |
| Chinese export restrictions | -1.8% | India, Brazil, SE Asia | Short–Medium term |
| Natural gas feedstock volatility | -1.5% | EU, India, North America | Medium term (2-4 yrs) |
| EU CBAM carbon cost layering | -1.2% | EU import gateway; MENA/CIS/Asia exporters | Medium–Long term |
| Subsidy fiscal strain & demand caps | -1.0% | India, South Asia | Medium term (2-4 yrs) |
| Nano-urea & efficiency substitution | -0.9% | India core, APAC | Long term (≥4 yrs) |
Geopolitical Impact Analysis
Global Trade Dynamics, Energy Security Concerns, and Supply Chain Disruptions Shape the Urea Market Landscape.
Geopolitical developments have a significant impact on the global urea industry, especially as natural gas, the principal feedstock for urea manufacturing, is concentrated in a small number of producing locations. Trade restrictions, economic penalties, export bans, and regional conflicts have the potential to interrupt natural gas supplies and fertilizer trade flows, resulting in variations in urea prices and availability.
Geopolitical tensions have an impact on shipping routes, transportation costs, and supply chain efficiency, causing anxiety for both producers and consumers. Countries that rely significantly on fertilizer imports are particularly sensitive to supply disruptions and price fluctuations.
For instance, the Russia-Ukraine conflict continued to impact global fertilizer markets throughout 2024, affecting natural gas prices and fertilizer exports from the Black Sea region, while several countries increased efforts to secure domestic fertilizer production and diversify import sources to strengthen food security. While these developments present short-term market issues, they also encourage investment in regional production capacity, supply chain diversity, and long-term fertilizer self-sufficiency policies in key agricultural countries.
Regional Analysis
Asia Pacific Held the Largest Share of the Global Urea Market.
In 2025, the Asia Pacific region dominates the global urea market, accounting for 44.8% of the market share and generating approximately USD 30.4 billion in revenue in 2025. The region’s leadership is supported by its large agricultural sector, growing population, and strong demand for food production in countries such as China, India, Indonesia, and Vietnam.
Government fertilizer subsidy programs, expanding cultivation areas, and increasing adoption of modern farming techniques continue to drive urea consumption. China remains one of the world’s largest producers and consumers of urea, while India represents a major demand center due to its extensive agricultural activities and ongoing efforts to improve crop productivity.
North America represents a significant market for urea, supported by advanced farming practices, high fertilizer application rates, abundant natural gas resources, and growing adoption of precision agriculture technologies. Europe maintains a notable market presence due to strong demand from agricultural and industrial sectors, although stringent environmental regulations are encouraging the use of efficient fertilizer management practices and specialty urea products.
Key Regions and Countries Covered in this Report
North America
- The US
- Canada
Europe
- Germany
- France
- The UK
- Spain
- Italy
- Russia & CIS
- Rest of Europe
APAC
- China
- Japan
- South Korea
- India
- ASEAN
- Rest of APAC
Latin America
- Brazil
- Mexico
- Rest of Latin America
Middle East & Africa
- GCC
- South Africa
- Rest of MEA
Key Players Analysis
The global urea market is moderately consolidated, with a mix of large integrated fertilizer manufacturers, state-owned enterprises, and regional producers competing across international and domestic markets. Leading companies collectively account for a substantial share of global production capacity, benefiting from strong access to natural gas feedstock, extensive distribution networks, large-scale manufacturing facilities, and long-term supply agreements.
Market participants are increasingly focusing on capacity expansions, operational efficiency improvements, sustainability initiatives, and the development of enhanced-efficiency fertilizer products to strengthen their competitive positions. Competition is also influenced by government policies, fertilizer subsidy programs, trade regulations, and feedstock availability, particularly in major producing regions such as the Asia Pacific, the Middle East, North America, and Eastern Europe.
Companies are investing in advanced production technologies, low-carbon ammonia and urea projects, and strategic partnerships to meet evolving environmental requirements and growing global fertilizer demand. In addition, expanding export capabilities and strengthening regional supply chains remain key priorities as producers seek to capitalize on rising agricultural and industrial demand worldwide.
The Major Players in The Industry
- CF Industries Holdings, Inc.
- Pupuk Indonesia (Persero)
- Yara International ASA
- SABIC
- OCI Global
- Nutrien Ltd.
- EuroChem Group AG
- Qatar Fertilizer Company (QAFCO)
- BASF SE
- China National Petroleum Corporation (CNPC)
- Indian Farmers Fertilizer Cooperative Limited (IFFCO)
- PT Pupuk Sriwidjaja Palembang (Pusri)
- Fertiberia
- Koch Fertilizer, LLC
- GROUP DF
- Others
Key Development
- In April 2026, CF Industries Holdings, Inc. and PepsiCo entered a commercial agreement to deploy certified low-carbon urea ammonium nitrate solution fertilizer across PepsiCo’s U.S. potato supply chain. The initiative uses carbon capture, sequestration, and emissions abatement technologies at CF Industries’ Donaldsonville facility, supporting the shift toward lower-carbon nitrogen fertilizers in agricultural applications.
- In September 2025, Fertiglobe signed agreements to expand the supply of low-carbon ammonia and nitrogen-based fertilizer products across international markets, reflecting increasing investment in sustainable nitrogen value chains and advanced fertilizer solutions.
Report Scope
| Report Features | Description |
|---|---|
| Market Value (2025) | US$ 67.9 Bn |
| Forecast Revenue (2035) | US$ 96.0 Bn |
| CAGR (2026–2035) | 3.5% |
| Base Year for Estimation | 2025 |
| Historic Period | 2020–2024 |
| Forecast Period | 2026–2035 |
| Report Coverage | Revenue Forecast, Market Dynamics, Competitive Landscape, Recent Developments |
| Segments Covered | By Grade (Agricultural Grade Urea, Technical Grade Urea, Feed Grade Urea, and Medical/Pharmaceutical Grade Urea), By Product Type (Granular Urea, Prilled Urea, and Other Product Types), By Application (Nitrogenous Fertilizer, Animal Feed and Feed Additives, Melamine and Resins, Automotive Diesel Exhaust Fluid, Chemicals, Plastics, Adhesives and Textiles, and Building and Construction Additives), By Channel (Agriculture, Chemical Industry, Automotive, Medical and Healthcare, Building and Construction, and Other End-use Industries) |
| Regional Analysis | North America – The US & Canada; Europe – Germany, France, The UK, Spain, Italy, Russia & CIS, Rest of Europe; APAC- China, Japan, South Korea, India, ASEAN & Rest of APAC; Latin America- Brazil, Mexico & Rest of Latin America; Middle East & Africa- GCC, South Africa, & Rest of MEA |
| Competitive Landscape | CF Industries Holdings, Inc., Pupuk Indonesia (Persero), Yara International ASA, SABIC, OCI Global, Nutrien Ltd., EuroChem Group AG, Qatar Fertilizer Company (QAFCO), BASF SE, China National Petroleum Corporation (CNPC), Indian Farmers Fertilizer Cooperative Limited (IFFCO), PT Pupuk Sriwidjaja Palembang (Pusri), Fertiberia, Koch Fertilizer, LLC, GROUP DF, Others. |
| Customization Scope | Customization for segments, region/country-level will be provided. Moreover, additional customization can be done based on the requirements. |
| Purchase Options | We have three licenses to opt for: Single User License, Multi-User License (Up to 5 Users), Corporate Use License (Unlimited Users and Printable PDF) |


