
Quick Navigation
Report Overview
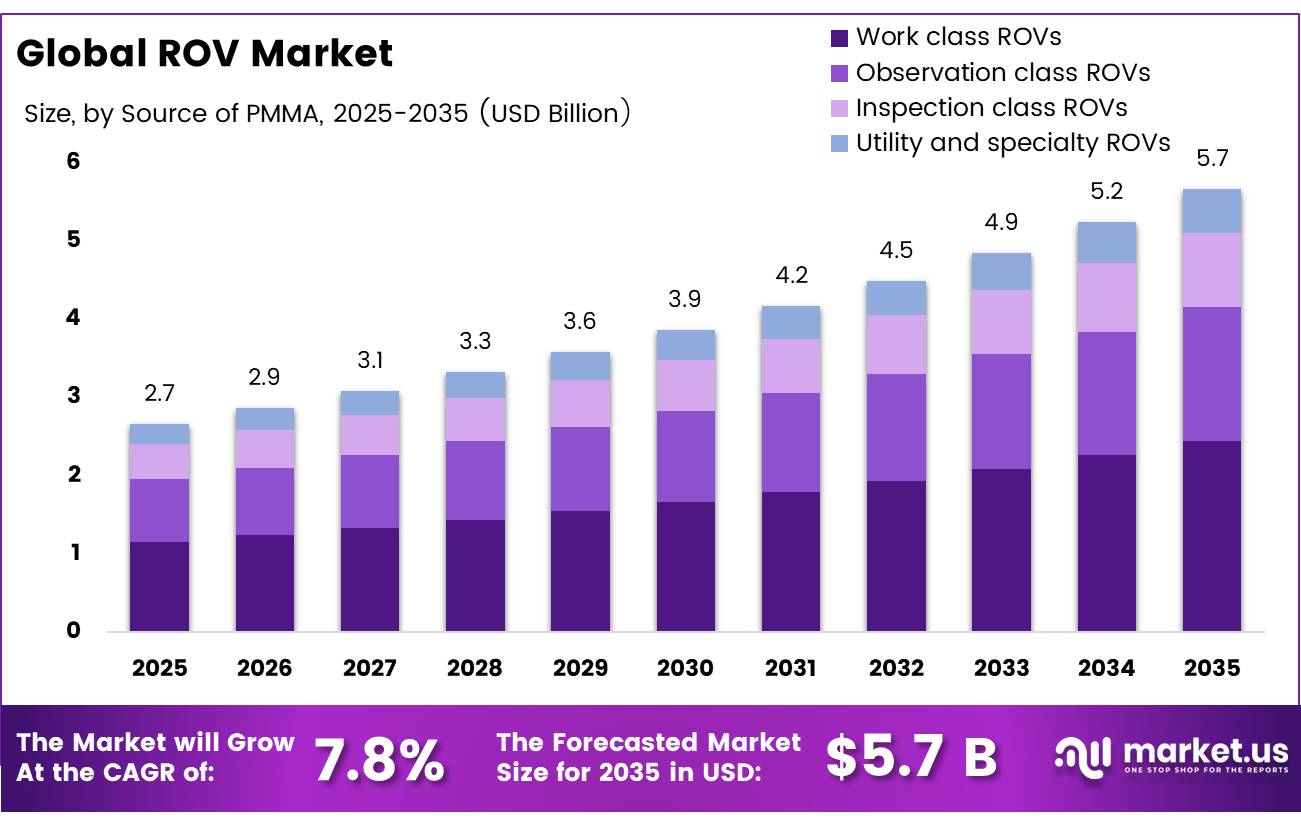
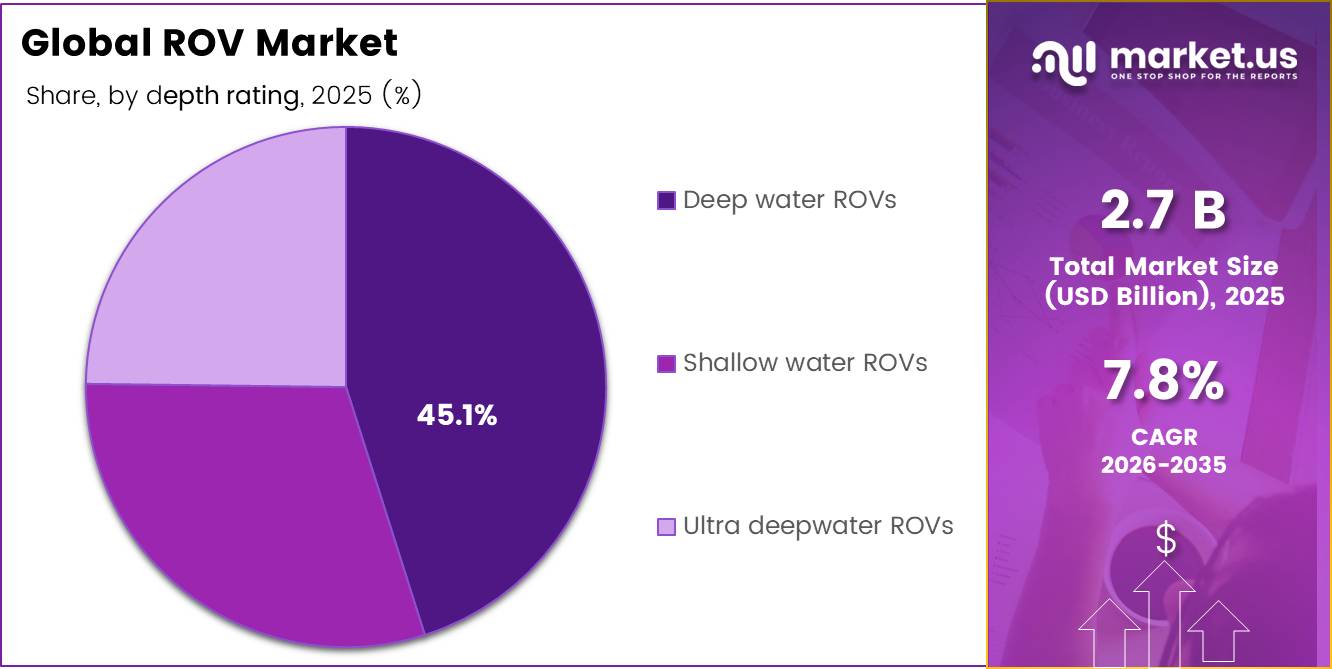
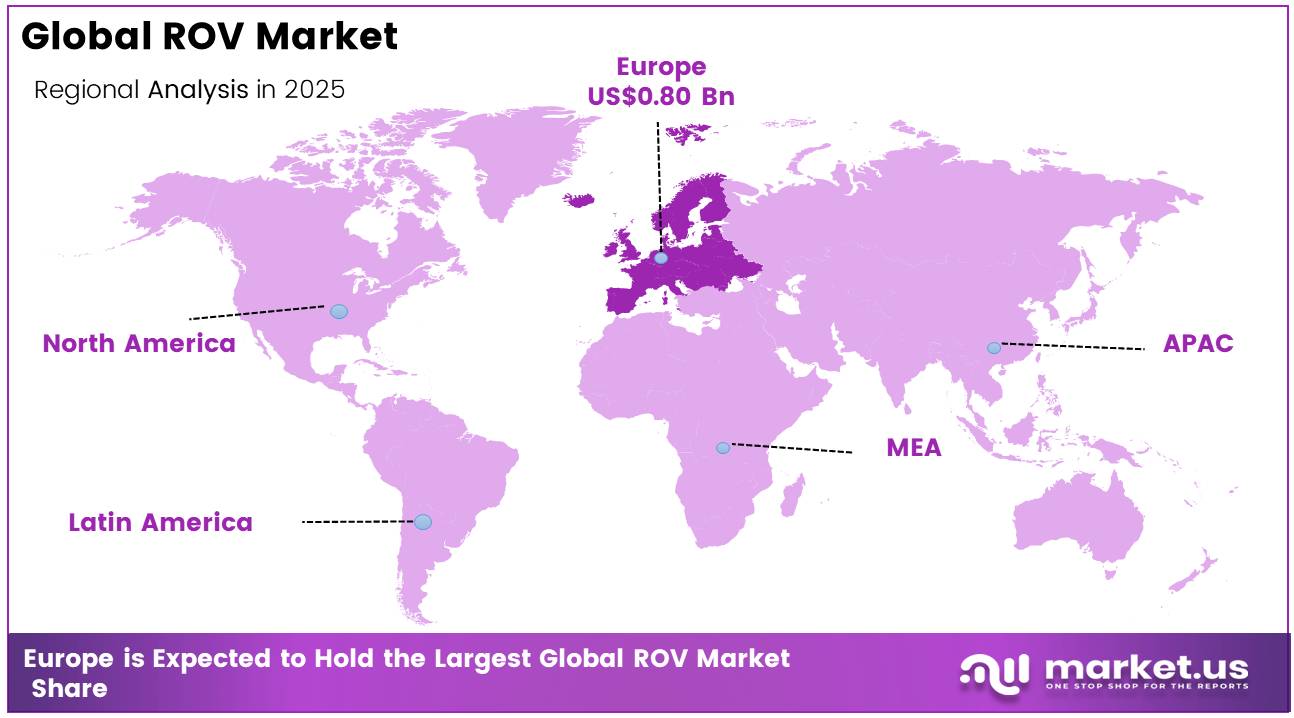
In 2025, the Global ROV Market was valued at USD 2.7 billion, and between 2026 and 2035, this market is estimated to register a CAGR of 7.8%, reaching about USD 5.7 billion by 2035. In 2025, Europe held a dominant market position, capturing more than a 30.1% share, holding USD 0.80 Billion revenue
Remotely Operated Vehicles (ROVs) market is a vital constituent of the subsea technology value chain for inspection, maintenance, and repairs in the offshore energy, defense, and marine scientific research sectors. The demand is structurally linked with the growth of deepwater oil and gas developments, the installation of offshore renewable energy technologies, and increased naval modernization programs, where complexities associated with operations continue to increase with greater depths being explored.
- The Bureau of Safety and Environmental Enforcement FY 2026 Budget Justifications (July 2025), approximately 15% of decommissioned platform jackets on the U.S. OCS are reefed annually under the Rigs-to-Reefs program, with BSEE confirming ongoing decommissioning activity across the OCS in FY 2025 and 2026 operations that rely extensively on ROV-based subsea inspection and site clearance verification.
Key Takeaways
- The global ROV market was valued at USD 2.7 billion in 2025.
- The market is projected to grow at a CAGR of 7.8% and is estimated to reach USD 5.7 billion by 2035.
- On the basis of Source of PMMA, Work class ROVs dominated the market, constituting 43.1% of the total market share.
- Based on the Depth Rating, the Deep water ROVs dominated the ROV market, with a substantial market share of around 45.1%.
- Based on the Application, Oil & Gas led the market, comprising 48.7% of the total market.
- Among the packaging, Vehicle control and navigation systems held a major share in the ROV market, 28.4% of the market share.
- In 2025, the Europe was the most dominant region in the ROV market, accounting for 30.1% of the total global consumption.
The offshore energy sector serves as the leading consumer of ROVs. According to the International Energy Agency, total upstream oil and gas investments are projected to be in the range of USD 570 billion in 2025, and roughly 40% will be invested in production from established fields, which rely significantly on subsea ROV interventions. The International Energy Agency further adds that deep offshore fields experience annual declines of 10.3%, increasing the requirement for continual subsea maintenance activities.
ROV Market Segments
Source of PMMA Analysis
Work class ROVs represents dominant Segment in the Market.
Work class ROVs dominate the global ROV market with a robust market share of 43.1%, owing to their importance in supporting deep water drilling, conducting well interventions, and maintaining subsea facilities. According to BOEM, offshore federal production in FY 2024 totaled approximately 668 million barrels of oil and 700 billion cubic feet of natural gas, with BOEM administering approximately 2,227 active OCS oil and gas leases spanning an area of 12.1 million acres as of April 2025. This substantial active acreage drives ongoing demand for heavy-duty ROV services.
The observation class ROVs, emerge as the fastest-growing category, fueled by offshore wind inspection requirements. In 2024, BSEE performed the first inspection of offshore wind turbines at the South Fork Wind project site, which represents America’s first commercial offshore wind facility with 130-megawatt capacity. Thus, this set a precedent and laid out a regulatory system governing future visual inspections. .
Depth Rating Analysis
Deep water ROVs a significant type.
Deepwater ROVs lead the way in terms of shares within the global ROV industry by their maximum operating depth with a market share of 45.1%, backed by increased subsea operations in all significant offshore producing regions. According to the U.S. Energy Information Administration, the average output of crude oil from the Federal Offshore Gulf of America was 1.77 million barrels per day in 2024, projected to be 1.80 million b/d in 2025 and 1.81 million b/d in 2026, with an addition of 13 new field developments in the period 2025-2026.
Ultra deepwater ROVs, represent the fastest-growing depth segment, underpinned by frontier field development at extreme depths. The EIA specifically highlights the Whale field, producing from a new Floating Production Unit located in more than 8,600 feet of water, which began operations in January 2025 exemplifying the accelerating shift toward ultra-deep-water environments that demand highly capable, pressure-rated ROV systems for subsea intervention and surveillance.
Application Analysis
Oil and gas Are the Most Widely Used
The oil and gas segment continues to represent the major application sector of the ROV market, holding 48.7% of market share due to the extensive offshore production structure that necessitates regular interventions under water. Offshore federal production for FY 2024 amounted to an estimated 668 million barrels of oil and 700 billion cubic feet of gas on about 2,227 operational leases occupying about 12.1 million acres of OCS, according to BOEM. Continuous support is required to maintain such a level of operations, which will be performed with the use of ROVs. Offshore leasing alone accounted for more than USD 7 billion paid to the U.S. Treasury in FY 2024, with no less than 30 lease sales scheduled in the Gulf of America from 2025 until 2040.
Offshore wind and renewables, the fastest growing application segment due to an increase in the subsea infrastructure that requires ROV-based inspection and monitoring services. As per the estimates from IRENA, the total offshore wind capacity reached close to 83 GW by 2024, while the Global Offshore Wind Alliance aims at achieving 2,000 GW of offshore wind power capacity by 2050. In 2024, U.S. Department of Energy’s National Offshore Wind R&D Consortium allocated funds to several asset inspection and monitoring projects through Solicitation 4.0 from DOE and BOEM.
Packaging Analysis
Vehicle control and navigation systems Held a Major Share of the ROV Market.
The vehicle control and navigation systems occupy the lion’s share of the ROV market with a revenue share of 28.4%, which can be attributed to the important role played by these components in positioning, station-keeping, subsea inspection accuracy, and deep-water operations. As per the report issued by the U.S. Department of Energy, the pipeline of offshore wind developments in the country stood at 80,523 MW in 2024, marking an upward movement of 53% compared to the previous year. In addition to that, global offshore wind capacity grew to 68,258 MW in 319 operating projects.
Vehicle cameras and lighting systems are the fast growing segment, forecasted to register steady growth on the back of high subsea inspections, offshore wind surveying activities, environmental monitoring applications, and subsea inspection operations. With government bodies like NOAA and BOEM continuously investing in underwater assessments and monitoring programs aimed at promoting renewable energy developments, there will be a rising demand for high-definition imaging and real-time inspection devices in ROVs.
Key Market Segments
By Source of PMMA
- Work class ROVs
- Observation class ROVs
- Inspection class ROVs
- Utility and specialty ROVs
By Depth Rating
- Deep water ROVs
- Ultra deepwater ROVs
- Shallow water ROVs
By Application Type
- Oil and gas
- Offshore wind and renewables
- Defense and security
- Scientific research and oceanography
- Subsea telecoms and utilities
- Other industrial uses
By Packaging
- Vehicle cameras and lighting systems
- Vehicle control and navigation systems
- Hydraulic tool control systems and manipulators
- Tether management systems
- Launch and recovery systems
- Other onboard sensors and payload
Drivers
Subsea telecom and power cable fault response market expansion
Cable resilience is emerging as a strong growth opportunity for ROV operators as repeated subsea telecom and power cable failures increase demand for faster inspection and repair services. In March 2024, several West African cable disruptions required repair vessel deployment, with restoration extending into April and May. Similarly, East African submarine cable outages in May 2024 were restored by 3 June 2024, taking nearly three weeks from initial damage.
Drivers Impact Analysis
| Driver | (~) % Impact on CAGR | Geographic Relevance | Impact Timeline |
|---|---|---|---|
| Deepwater oilfield tiebacks and brownfield subsea IRM demand | 2.10% | North America core, Brazil, West Africa, North Sea | Short term (≤ 2 years) |
| Offshore wind build-out and export/inter-array cable inspection intensity | 1.70% | EU core, China, UK, Taiwan, South Korea, U.S. East Coast | Medium term (2-4 years) |
| Well-control, safety, and inspection compliance raising mandatory ROV utilization | 1.20% | U.S. OCS, North Sea, EU waters, mature offshore basins | Short term (≤ 2 years) |
| Naval mine countermeasures and subsea infrastructure protection budgets | 1.40% | NATO navies, North America, Western Europe, Indo-Pacific | Medium term (2-4 years) |
| Subsea telecom and power cable fault response market expansion | 0.90% | East Africa routes, Mediterranean, North Sea, APAC corridors | Short term (≤ 2 years) |
| AI-enabled remote piloting, digital twin inspection, and crew-cost compression | 1.10% | Global, strongest in North America, EU, APAC service hubs | Medium term (2-4 years) |
Restraints
Skilled pilot shortage
Human capital shortages remain a major restraint for the ROV market because high-spec operations rely on skilled pilot-technicians, supervisors, survey engineers, and offshore personnel that require long training periods and specialized certification. In 2026, published offshore hiring benchmarks showed ROV pilot and technician day rates typically ranging from USD 350–600, while North Sea contract rates reached approximately GBP 300–700 per day, reflecting rising labor competition across offshore wind, oil and gas, and marine survey sectors. In addition, obtaining DP certification can take 12–18 months, limiting workforce expansion. As a result, contractors face higher crew costs, slower mobilization, and reduced project capacity, favoring larger operators with established training and global workforce networks.
Restraint Impact Analysis
| Restraint | (~) % Impact on CAGR | Geographic Relevance | Impact Timeline |
|---|---|---|---|
| Vessel day-rate inflation | -2.00% | North Sea, Brazil, U.S. Gulf, West Africa | Short term (≤ 2 years) |
| Long-lead subsea components | -1.60% | North America core, EU, APAC yards | Medium term (2-4 years) |
| Skilled pilot shortage | -1.30% | North Sea, Brazil, APAC corridors, U.S. Gulf | Short term (≤ 2 years) |
| Compliance and certification drag | -1.10% | U.S. OCS, EU waters, UK/Norway, Brazil | Short term (≤ 2 years) |
| Offshore wind project delays | -1.40% | UK, Germany, Japan, Taiwan, U.S. East Coast | Medium term (2-4 years) |
| Tariff and electronics cost pass-through | -0.90% | U.S. core, Mexico routes, China-linked supply chains | Short term (≤ 2 years) |
Opportunity
Offshore CCS monitoring platforms
Offshore carbon capture and storage (CCS) monitoring represents a future growth opportunity for the ROV market rather than a current demand driver, as most existing revenue still comes from oil, gas, and traditional subsea inspection. By February 2025, the Global CCS Institute reported 65 operational CCS facilities globally with 57 Mtpa capture capacity, while 42 additional projects under construction are expected to add 44 Mtpa. Europe alone had 13 facilities under development, supported by the EU Net-Zero Industry Act target of 50 million tonnes of CO₂ injection capacity per year by 2030. This expansion creates demand for ROV-enabled baseline surveys, continuous integrity monitoring, anomaly detection, and recurring inspection and analytics services across offshore storage infrastructure.
Opportunity Impact Analysis
| Opportunity | (~) % Potential CAGR | Geographic Relevance | Execution Window |
|---|---|---|---|
| Resident ROV-as-a-service | 2.40% | North Sea, Brazil, U.S. Gulf, Norway | Short term (≤ 2 years) |
| Offshore CCS monitoring platforms | 1.90% | North Sea, Norway, Denmark, UK, Benelux | Medium term (2-4 years) |
| Undersea infrastructure security | 1.70% | Baltic, North Sea, Mediterranean, Indo-Pacific | Short term (≤ 2 years) |
| Wind O&M robotics subscriptions | 1.50% | UK, Germany, Taiwan, South Korea, U.S. East Coast | Medium term (2-4 years) |
| Subsea data center support | 1.10% | East Asia, Israel, Nordics, Gulf coast hubs | Medium term (2-4 years) |
| Aquaculture and nearshore utility ROVs | 1.00% | Norway, Chile, Canada, APAC coastal markets | Short term (≤ 2 years) |
Challenge
Resident ROV-as-a-service
Resident subsea systems represent a future opportunity for the ROV market rather than a current growth driver, as adoption remains limited but offers strong long-term economic potential. Oceaneering’s Liberty resident system demonstrates this model through a self-contained docking station supported by a 550 kWh battery and remote onshore operations. Research during 2025–2026 indicates autonomous docking and persistent subsea operations are progressing toward commercial deployment.
By reducing 25%–40% of vessel-supported inspection days on existing offshore assets, service providers could improve EBITDA margins by approximately 400–700 basis points through higher utilization, lower offshore labor requirements, and recurring software-enabled service contracts, particularly in mature offshore regions.
Challenges Impact Analysis
| Challenge | (~) % Potential CAGR | Geographic Relevance | Mitigation Horizon |
|---|---|---|---|
| Tight offshore vessel capacity | -1.60% | North Sea, Brazil, U.S. Gulf, West Africa | Long term (≥ 4 years) |
| Structural ROV skills gap | -1.40% | North Sea, Brazil, APAC corridors, U.S. Gulf | Long term (≥ 4 years) |
| Fragmented digital/cyber readiness | -1.10% | North America core, EU regulatory hubs | Medium term (2-4 years) |
| Interoperability and standards lag | -1.00% | Global multi-operator basins | Medium term (2-4 years) |
| Capex cyclicality and macro shocks | -1.30% | Global offshore energy and infrastructure hubs | Long term (≥ 4 years) |
| Multi-domain mission complexity | -1.00% | NATO/EU seas, Indo-Pacific chokepoints | Medium term (2-4 years) |
Geopolitical Impact Analysis
Geopolitical Realignment and Supply Chain Fragmentation Reshaping ROV Manufacturing.
There are geopolitical factors, supply chain diversifications efforts, and increased awareness regarding maritime security issues that influence the global ROV market significantly today. Governments seek to enhance their domestic capabilities in terms of critical technology protection, subsea infrastructure protection, among others.
In May 2026, the AUKUS members, namely, the United States, the United Kingdom, and Australia, announced the development of an advanced unmanned undersea vehicle (UUV). The project demonstrates the strategic value of such technologies in the context of surveillance, reconnaissance, and security of critical underwater infrastructure like cables and pipelines. Thus, there are strong incentives for investing in domestically-made underwater systems, as well as in allied countries’ products.
On the other hand, governments are trying to diminish the vulnerability of supply chains related to critical minerals and electronics necessary for the operation of the ROV. According to the UK Critical Minerals Strategy of 2026, there are more than 50 critical mineral projects, and supply chain diversification is crucial because of geopolitical challenges. Likewise, the U.S. Department of the Interior Draft Critical Minerals List of 2025 listed 54 mineral commodities critical for both economic and national security of the United States.
Regional Analysis
Europe Held the Largest Share of the Global ROV Market.
Europe dominates the global ROV market at 30.1% owing to its well-developed offshore energy infrastructure and established offshore wind industry. It is one of the global epicenters for ROV deployment in various subsea operations in the North Sea. In this region, ROVs are extensively used in offshore wind construction, inspection services, and maintenance operations for oil and gas assets. As per figures released by the European Commission, offshore renewable energy capacity for the EU region stood at around 20.7 gigawatts in 2024 with additional plans in place under energy transition programs of this region.
Asia-Pacific is forecasted to experience the highest growth attributed to investments made in offshore wind power generation and offshore infrastructure construction. As reported by National Energy Administration of China, the installed offshore wind power capacity in the country surpassed 41 GW at the end of 2024 and remained the largest offshore wind market worldwide. Besides, there has been an increase in investments in oceanic research, offshore energy development, and subsea infrastructure construction activities in China, India, Japan, and South Korea.
Key Regions and Countries Covered
- North America
- The US
- Canada
- Europe
- Germany
- France
- The UK
- Spain
- Italy
- Russia & CIS
- Rest of Europe
- APAC
- China
- Japan
- South Korea
- India
- ASEAN
- Rest of APAC
- Latin America
- Brazil
- Mexico
- Rest of Latin America
- Middle East & Africa
- GCC
- South Africa
- Rest of MEA
Key Players Analysis
For ROV manufacturers to remain competitive, it has become vital to embrace the latest technologies and innovations aimed at enhancing performance and operational efficiency, as well as developing unique abilities to perform various underwater functions. The key strategy is associated with the adoption of advanced navigation and control systems, enhanced imaging sensors, and other intelligent devices to increase reliability, precision, and efficiency of operations in challenging conditions at sea.
Strategic partnerships with offshore wind farm owners, oil and gas companies, navies, and oceanographic agencies facilitate the development of long-term contracts and additional services related to vehicle operation. Modernization of the ROV fleet includes adoption of a modular platform approach that ensures easy installation of specific mission tools such as cameras, manipulators, and inspection equipment. Additionally, expanding networks of regional service centers near offshore facilities enable rapid repairs and upgrades of vehicles.
The Major Players in The Industry
- Oceaneering International Inc.
- Subsea 7 S.A.
- Fugro Group
- TechnipFMC PLC
- DOF Subsea AS
- Helix Energy Solutions Group Inc.
- C‑Innovation LLC
- Saipem S.p.A.
- Forum Energy Technologies Inc.
- ECA Group
- DeepOcean Group
- Kongsberg Maritime
- Teledyne Technologies Incorporated
- Saab Seaeye Ltd.
- VideoRay LLC
- Others
Key Development
- In August 2025 Oceaneering International Inc. won several contracts for underwater robotic equipment from Petrobras, having a value of around USD 180 million. The contract relates to inspection, maintenance, repair, and underwater positioning of offshore platforms in Brazil through the use of work-class ROVs.
- In June 2025 Fugro Group received four multi-year contracts from Petrobras, valued at roughly USD 340 million, for the provision of subsea inspection and monitoring services using modern ROVs and remote piloting technology.
Report Scope
| Report Features | Description |
|---|---|
| Market Value (2025) | USD 2.7 Bn |
| Forecast Revenue (2035) | USD 5.7 Bn |
| CAGR (2026-2035) | 7.8% |
| Base Year for Estimation | 2025 |
| Historic Period | 2020-2024 |
| Forecast Period | 2026-2035 |
| Report Coverage | Revenue Forecast, Market Dynamics, Competitive Landscape, Recent Developments |
| Segments Covered | By Source of PMMA (Work class ROVs, Observation class ROVs, Inspection class ROVs, Utility and specialty ROVs), By Depth Rating (Deep water ROVs, Ultra Deepwater ROVs, Shallow water ROVs), By Application (Oil and gas, Offshore wind and renewables, Defense and security, Scientific research and oceanography, Subsea telecoms and utilities, Other industrial uses), By Packaging (Vehicle cameras and lighting systems, Vehicle control and navigation systems, Hydraulic tool control systems and manipulators, Tether management systems, Launch and recovery systems, Other onboard sensors and payloads) |
| Regional Analysis | North America – The US & Canada; Europe – Germany, France, The UK, Spain, Italy, Russia & CIS, Rest of Europe; APAC– China, Japan, South Korea, India, ASEAN & Rest of APAC; Latin America– Brazil, Mexico & Rest of Latin America; Middle East & Africa– GCC, South Africa, & Rest of MEA |
| Competitive Landscape | Oceaneering International Inc., Subsea 7 S.A., Fugro Group., TechnipFMC PLC, DOF Subsea AS, Helix Energy Solutions Group Inc., C‑Innovation LLC, Saipem S.p.A., Forum Energy Technologies Inc., ECA Group, DeepOcean Group, Kongsberg Maritime, Teledyne Technologies Incorporated, Saab Seaeye Ltd., VideoRay LLC, Others. |
| Customization Scope | Customization for segments, region/country-level will be provided. Moreover, additional customization can be done based on the requirements. |
| Purchase Options | We have three licenses to opt for: Single User License, Multi-User License (Up to 5 Users), Corporate Use License (Unlimited Users and Printable PDF) |


