


Report Overview
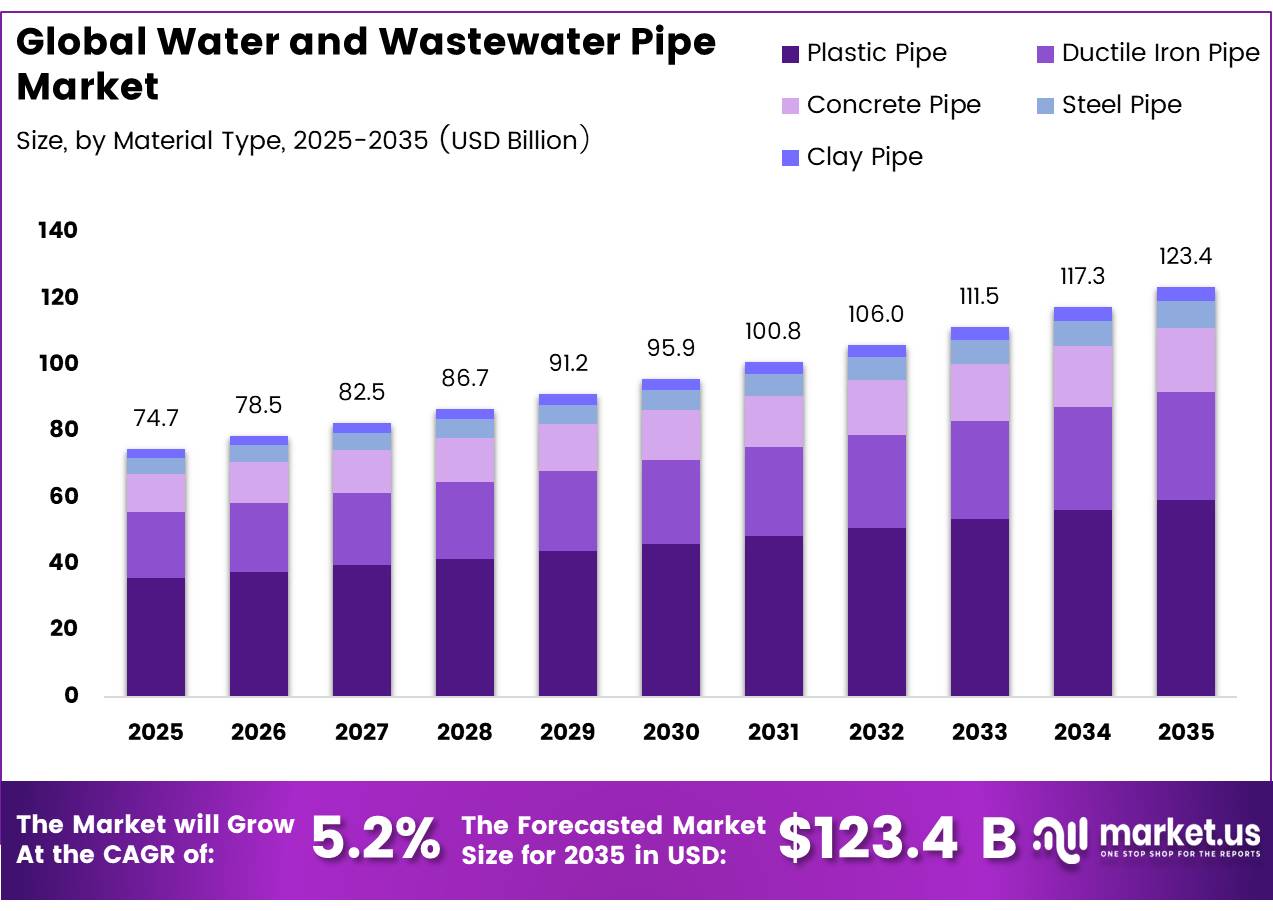
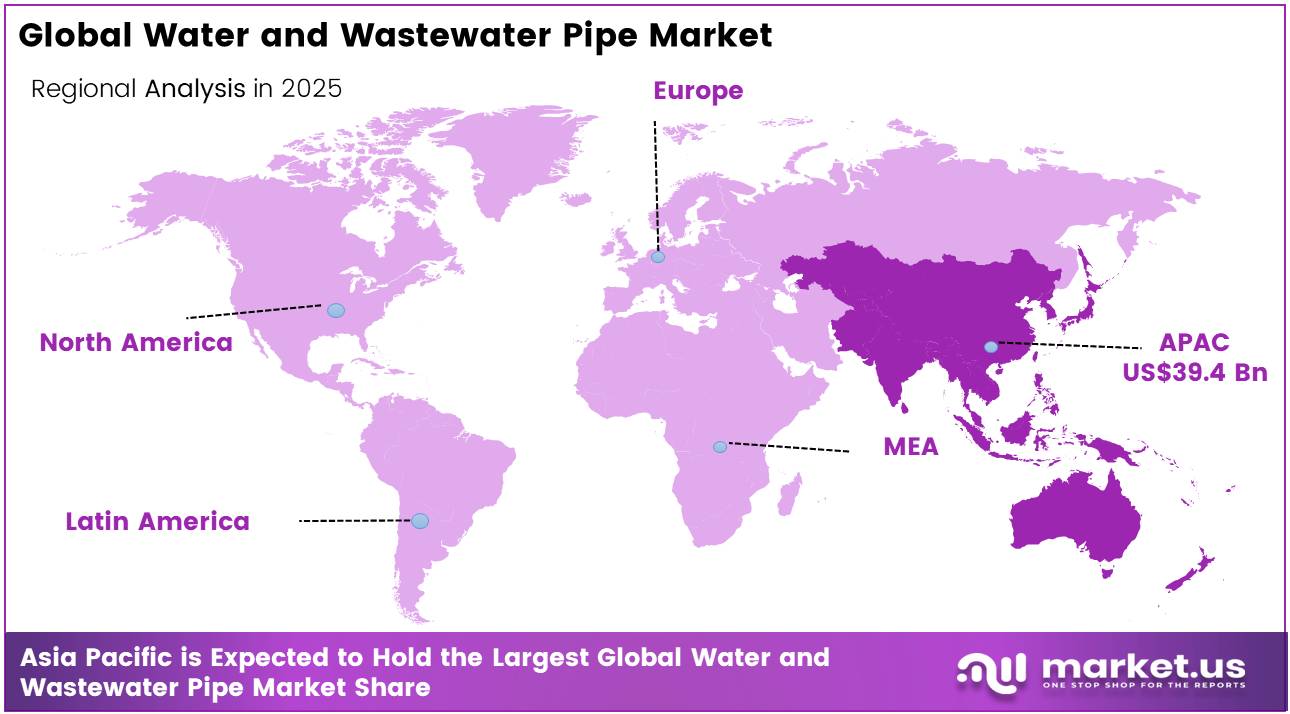
In 2025, the Global Water and Wastewater Pipe Market was valued at US$74.7 billion, and between 2026 and 2035, this market is estimated to register a CAGR of 5.2%, reaching about US$123.4 billion by 2035. In 2025, Asia Pacific held a dominant market position, capturing more than a 52.8% share, holding USD 39.43 Billion revenue.
Water and wastewater pipes carry treated water to users and transport sewage, industrial effluent and stormwater to treatment facilities. The industry includes PVC, polyethylene, ductile-iron, steel and concrete systems, alongside fittings, valves and monitoring equipment. Demand is shaped by ageing networks, urban expansion, leakage control, climate resilience and stricter water-quality rules.
- In August 2025, according to WHO and UNICEF, 2.1 billion people lacked safely managed drinking water and 3.4 billion people lacked safely managed sanitation, showing the scale of infrastructure still required worldwide.
- Utilities are replacing corroded mains, separating stormwater from sewage, enlarging transmission capacity and using trenchless installation. In December 2025, according to UN-Water, only 56% of household wastewater flows were safely treated in 2024, leaving 44% inadequately treated. This gap supports investment in sewer extensions, pressure pipelines, pumping connections and treatment-plant interlinks, particularly in fast-growing cities and underserved regions.
Government finance is strengthening project pipelines. In November 2025, according to the U.S. Environmental Protection Agency, USD 6.5 billion became available through the ninth WIFIA financing round, while USD 550 million was offered through State WIFIA. The EPA also reported that WIFIA had closed 154 loans, supplied USD 23 billion in financing and supported USD 51 billion of projects. These programmes create demand for replacement mains, large-diameter pipelines, sewer rehabilitation and resilient conveyance systems.
Regulation is changing pipe specifications. In January 2025, the revised EU Urban Wastewater Treatment Directive entered into force, extending collection and treatment requirements to urban areas with more than 1,000 inhabitants and requiring energy-neutral treatment plants by 2045. The European Commission reported 30,354 urban wastewater treatment plants and estimated EUR 6.6 billion in annual economic benefits by 2045. These rules encourage corrosion-resistant pipes, sealed sewers, reuse lines and networks able to handle micropollutants and heavier rainfall.
According to the WHO/UNICEF Joint Monitoring Programme (JMP) 2025 report, around 2.1 billion people, equivalent to 25% of the global population, still lacked access to safely managed drinking water in 2024. Although global coverage improved from 50% in 2015 to 60% in 2024, a significant share of the population remains underserved. At the same time, the FAO’s 2025 AQUASTAT Water Data Snapshot shows that global renewable freshwater availability per person declined by 7%, falling from 5,719 m³ in 2015 to 5,326 m³ in 2022.
According to UN-Habitat, the region currently has more than 2.2 billion urban residents, and this figure is projected to increase by 50% by 2050, adding approximately 1.2 billion additional urban inhabitants. The UN Department of Economic and Social Affairs (DESA) estimates that India, China, and Nigeria will collectively contribute 35% of global urban population growth through 2050. India alone is expected to add 416 million urban residents, while China is projected to add 255 million, creating substantial demand for new drinking water and wastewater pipeline networks.
Key Takeaways
- The global Water and Wastewater Pipe market was valued at USD 74.7 billion in 2025.
- The global market is projected to grow at a CAGR of 5.2% and is estimated to reach USD 123.4 billion by 2035.
- On the basis of material type, Plastic Pipe dominated the market, constituting 48% of the total market share.
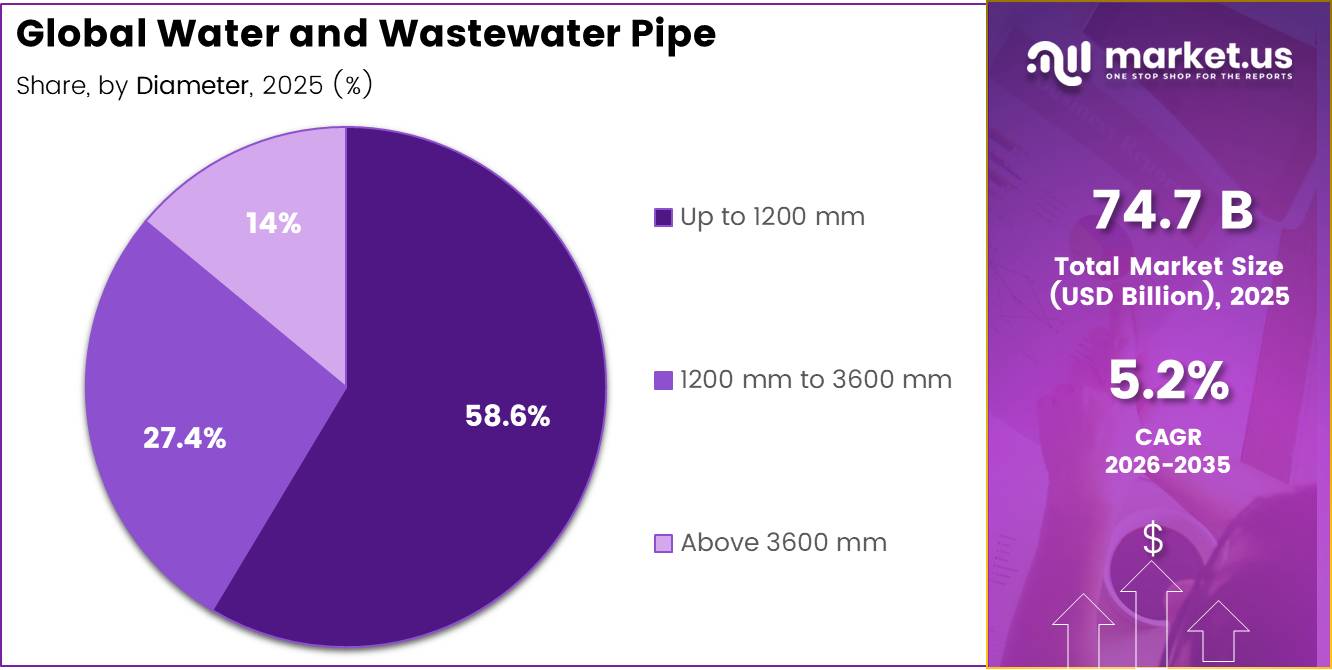
- Based on the Diameter, Up to 1200 mm dominated the Water and Wastewater Pipe market, with a substantial market share of around 58.6%.
- Based on the Application, Water Supply and Distribution led the market, comprising 62% of the total market.
- Among the end-uses, the Municipal held a major share in the Water and Wastewater Pipe market, 58.5% of the market share.
- In 2025, the Asia Pacific was the most dominant region in the Water and Wastewater Pipe market, accounting for 52.8% of the total global consumption.
Material Type Analysis
Plastic Water and Wastewater Pipe represents dominant Segment in the Market.
Plastic pipes dominate the global water and wastewater pipe market and are expected to maintain the largest 48% share over the forecast period. According to the U.S. EPA’s 7th Drinking Water Infrastructure Needs Survey and Assessment (DWINSA, 2023), nearly one-third of the existing pipe network in surveyed U.S. water systems is already made of plastic materials. Future demand is even stronger, with 54% of planned replacement pipe length and 47% of new pipe installations expected to use plastic pipes, primarily PVC and HDPE.
This preference is driven by their corrosion-free nature, which eliminates electrochemical deterioration, a major cause of the estimated 250,000–300,000 annual water main breaks in the United States. In addition, plastic pipes offer flexibility under changing soil conditions and feature smooth internal surfaces (Manning’s n ≈ 0.009), helping utilities reduce pumping energy costs and improve long-term operational efficiency.
The long-term investment outlook further supports segment growth. The EPA estimates a $625 billion drinking water infrastructure requirement over the next 20 years, with $422.9 billion (67%) dedicated to transmission and distribution pipe replacement and rehabilitation. The Bipartisan Infrastructure Law has also committed more than $50 billion to U.S. water infrastructure programs, accelerating adoption of PVC and HDPE systems.
Globally, the World Bank estimates annual water infrastructure spending at $164.6 billion, with an additional $140.8 billion per year required to achieve SDG targets. While ductile iron pipes maintain a significant 26.5% market share and account for 34% of planned U.S. replacement projects, particularly in high-pressure and large-diameter applications, their higher installation costs, greater weight, and susceptibility to soil-related corrosion continue to limit growth compared with plastic pipe alternatives.
Diameter Analysis
Up to 1200 mm a significant diameter
The up to 1,200 mm diameter segment accounted for 58.6% of the global water and wastewater pipe market, making it the largest category. Its dominance is driven by the extensive use of these pipes in residential connections, municipal water distribution networks, and sewer collection systems. Pipes ranging from 100 mm to 900 mm are the primary components of distribution infrastructure, supporting water delivery to households and commercial users, while larger transmission mains mainly serve as feeder systems.
According to the United Nations Department of Economic and Social Affairs, the global urban population has increased from 751 million in 1950 to more than 4.4 billion and is expected to grow by another 2.5 billion by 2050, with nearly 90% of this growth occurring in Asia and Africa. This urban expansion continues to generate significant demand for distribution-scale pipe networks.
The World Bank estimates that achieving global water and sanitation goals requires annual investments of USD 131–140 billion. In addition, the U.S. EPA’s 2023 Drinking Water Infrastructure Needs Survey identified USD 422.9 billion in requirements for pipeline rehabilitation and replacement. Rising concerns over water losses are also supporting demand, as utilities worldwide lose around 126 billion cubic meters of treated water annually, valued at up to USD 141 billion.
The 1,200–3,600 mm diameter represents fastest growing market,, supported by demand for bulk water transmission and inter-city conveyance systems. Rapid urbanization in developing regions is increasing the need for large-diameter pipelines connecting treatment facilities with distribution hubs. Growing population levels, projected to rise from 8.2 billion in 2024 to 10.3 billion by the mid-2080s, and the fact that 42% of global wastewater remains untreated, continue to support investments in large-scale water transport infrastructure.
Application Analysis
Water Supply and Distribution Are the Most Widely Used.
Water supply and distribution dominates the global water and wastewater pipe market with a 62.0% share, underpinned by persistent global access deficits and large-scale municipal pipe replacement programs. Potable water conveyance infrastructure forms the primary end-use base, encompassing service connections, distribution mains, and transmission pipelines.
The WHO/UNICEF Joint Monitoring Programmed reported in 2025 that 2.1 billion people still lack safely managed drinking water globally, sustaining structural demand for expanded pipe distribution networks. The EPA’s 7th Drinking Water Infrastructure Needs Survey identified $625 billion in 20-year investment needs for drinking water systems, with $422.9 billion allocated specifically to pipeline replacement and rehabilitation, reinforcing the segment’s dominant procurement position across both developed and developing economies.
Wastewater management represents the fastest growing market in the segment, supported by the growing urgency of sewer network expansion and effluent conveyance upgrades. The WHO/UNICEF JMP reported in 2025 that 3.4 billion people still lack safely managed sanitation globally, while the UN SDG progress report noted only 56% of domestic wastewater is safely treated, compelling governments to accelerate sewer pipe deployment and collection network construction.
End User Analysis
Municipal Held a Major Share of the Water and Wastewater Pipe Market.
The municipal segment is way ahead in the global water and wastewater pipe market, holding a 58.5% share. This is thanks to all the procurement for drinking water, sewage, and storm water stuff. They’re the biggest buyers out there, and governments are putting serious money into updating old pipes and expanding access. It threw more than $50 billion at the problem, marking the biggest federal water push ever. And get this: the EPA says nearly $630 billion will be needed just for wastewater and storm water over the next twenty years. That really shows how much spending is happening.
The agricultural sector is booming is the fastest-growing part right now. Driven by a surge in irrigation pipe needs in water-starved areas, it’s changing fast. The FAO reported a 7% drop in available water per person over the last ten years. Because of this, we’re seeing major investments in new piping to replace the old open-channel systems across South Asia, Sub-Saharan Africa, and the Middle East.
Key Market Segments
By Material Type
- Plastic Pipe
- Ductile Iron Pipe
- Concrete Pipe
- Steel Pipe
- Clay Pipe
By Diameter
- Up to 1200 mm
- 1200 mm to 3600 mm
- Above 3600 mm
By Application
- Water Supply and Distribution
- Wastewater Management
By End-User
- Municipal
- Industrial
- Agricultural
Drivers
SDG-aligned water and sewage capacity expansion and NRW reduction
SDG‑aligned water and sewage capacity expansion, combined with NRW reduction targets, is a distinct long‑term driver because it reflects structural policy commitments rather than discretionary capex, especially in emerging markets where baseline access and treatment gaps are still large. The global water and sewage market is projected to grow from about USD 760 billion in 2025 to roughly USD 1.05 trillion by 2030, implying sustained high‑single‑digit growth as governments strive to meet SDG 6 and to bring down untreated-discharge rates; Asia‑Pacific is the largest regional market today and North America is flagged as one of the fastest growing, but the steepest relative growth runway lies in South Asia, MENA and Sub‑Saharan Africa.
Strategically, this driver pushes manufacturers and EPCs toward value‑engineered, standardized product ranges that can be deployed at scale under national programs, while also favoring suppliers that can provide lifecycle‑support services, hydraulic modeling and performance guarantees; as these programs ramp over the next decade, they can realistically add about 2 percentage points of CAGR on top of organic, GDP‑driven pipe demand in the most under‑served geographies.
Drivers Impact Analysis
| Driver | (~) % Impact on CAGR Forecast | Geographic Relevance | Impact Timeline |
|---|---|---|---|
| Urbanization and aging pipe infrastructure renewal programs | +2.2% | North America core, EU, APAC mega-cities, Latin America spill-over | Medium term (2-4 years) |
| SDG-aligned water and sewage capacity expansion and NRW reduction | +2.0% | APAC corridors, MENA, Sub-Saharan Africa, Latin America | Long term (≥ 4 years) |
| Shift to plastic and composite pipes for corrosion resistance and lifecycle cost | +1.8% | North America, EU, India, China, GCC | Medium term (2-4 years) |
| Regulatory tightening on drinking-water quality and leakage standards | +1.7% | EU regulatory hubs, U.S., U.K., advanced APAC | Short term (≤ 2 years) |
| Climate resilience, flood control and stormwater network upgrades | +1.5% | North America core, EU, coastal APAC | Long term (≥ 4 years) |
| Private and blended-finance infrastructure investment momentum | +1.4% | Global, with APAC and North America leading | Medium term (2-4 years) |
Restraints
Volatile steel, resin and energy input costs
Volatile steel, resin and energy input costs restrain the water and wastewater pipe market because they compress margins, disrupt bid pricing, and cause utilities and EPCs to postpone or re-scope projects when tender prices overshoot budget envelopes, directly shaving growth off multi‑year capex pipelines. Ductile iron (DI) pipe producers are highly exposed to pig iron, steel scrap, ferroalloy and coke prices, all of which have seen double‑digit percentage swings in recent years due to iron ore cycles, export duties, and global freight shocks, while plastic pipe manufacturers face similar volatility in PVC and HDPE resins linked to naphtha and ethane feedstocks and regional cracker capacity utilization.
Strategically, manufacturers respond by shortening quote validity, including price‑variation clauses, and focusing on higher-margin or turnkey contracts, but these risk‑management measures also lead to tender cancellations, rebids, and delays when owners resist updated pricing, collectively pulling perhaps 1.5–2 percentage points off potential CAGR versus a world with more stable input costs, as some projects fall outside acceptable ROI windows and are pushed into later budget cycles.
Restraint Impact Analysis
| Restraint | (~) % Impact on CAGR Forecast | Geographic Relevance | Impact Timeline |
|---|---|---|---|
| Volatile steel, resin and energy input costs | -1.9% | North America core, EU, APAC manufacturing hubs | Short term (≤ 2 years) |
| Supply chain and logistics bottlenecks for large-diameter pipe | -1.7% | APAC corridors, North America, EU, Middle East | Medium term (2-4 years) |
| Competition and substitution between DI, steel and plastics | -1.6% | India, China, EU, Latin America | Long term (≥ 4 years) |
| Environmental and disposal concerns around PVC and concrete | -1.5% | EU regulatory hubs, North America, advanced APAC | Long term (≥ 4 years) |
| Project dependency on slow public procurement cycles | -1.4% | India, MENA, Latin America, parts of Africa | Medium term (2-4 years) |
| Quality, standards non-compliance and failure-driven distrust | -1.3% | India, SE Asia, emerging markets | Medium term (2-4 years) |
Opportunity
Trenchless rehab, HDPE lining and slum network upgrading platforms
India Infrastructure Research projects that roughly 650,000 km of water supply pipeline and about 27,750 km of wastewater pipeline are expected to be laid by 2030 and 2028 respectively under national programs, but much of this still assumes conventional open‑cut approaches, even in congested brownfield contexts where social disruption, land acquisition and traffic impacts are major constraints.
Academic work on sanitation upgrading in slum areas emphasizes the need for methodologies that account for spatial constraints, social disruption and cost‑effectiveness, pointing toward small‑diameter HDPE and trenchless methods as technically feasible but underutilized options in narrow alleys, heritage neighborhoods and informal settlements. Systematizing these methods as full platforms—combining tailored pipe products, HDD or pipe‑bursting service fleets, standardized design templates and social‑engagement toolkits—would allow contractors and pipe OEMs to unlock currently stalled or “too hard” projects, turning politically sensitive network gaps into executable programs.
This not only increases absolute kilometers installed but also commands premium margins for specialized services and products; if trenchless and slum‑upgrade platforms can capture even 10–20% of the projected new‑build and rehab kilometers in high‑density emerging cities by the mid‑2030s, the incremental revenue and higher ASPs could contribute roughly 2 percentage points of CAGR upside in those corridors above baseline expectations built on traditional engineering playbooks.
Opportunity Impact Analysis
| Opportunity | (~) % Potential CAGR Upside | Geographic Relevance | Execution Window |
|---|---|---|---|
| Smart, sensor-embedded “intelligent pipe” systems | +2.0% | North America, EU, APAC mega-cities | Medium term (2-4 years) |
| Trenchless rehab, HDPE lining and slum network upgrading platforms | +1.9% | India, Africa, Latin America, SE Asia | Medium term (2-4 years) |
| Performance-based, lifecycle EPC and O&M contracts | +1.7% | North America core, EU, GCC, India | Long term (≥ 4 years) |
| Digital twin–integrated pipe networks and data services | +1.6% | EU regulatory hubs, APAC digital leaders, U.S. utilities | Long term (≥ 4 years) |
| Low-carbon and circular pipe product portfolios | +1.5% | EU, U.K., North America, advanced APAC | Medium term (2-4 years) |
| Consolidation and regional pipe–services platforms | +1.4% | APAC corridors, MENA, Latin America | Medium term (2-4 years) |
Challenges
Volatile steel, resin and energy input costs
Volatile steel, resin and energy input costs are a persistent challenge rather than an absolute restraint because projects still proceed, but severe swings in pig iron, scrap, ferroalloy, PVC and HDPE resin prices, combined with electricity and fuel cost volatility, systematically erode margins, scramble tender economics and force repeated repricing that slows order conversion. Multiple market analyses highlight “persistent fluctuations in raw material prices” as a core challenge for the water and wastewater pipe sector, with price curves heavily influenced by global steel and petrochemical cycles, currency movements and freight rates, meaning that producers can see unit input costs move by 10–25% within a year while municipal and EPC contracts often lock selling prices for 6–18 months.
Strategically, manufacturers try to mitigate via hedging, shorter quote validity windows, price‑variation clauses and more flexible contract structures, but public procurement rules and customer resistance limit full pass‑through, so planned capex and capacity ramp‑ups are moderated and some high‑risk geographies or product niches are deprioritized, collectively exerting around a 1‑point drag on otherwise achievable CAGR as project phasing and investment decisions are repeatedly adjusted to raw‑material cycles rather than pure infrastructure need.
Challenges Impact Analysis
| Challenge | (~) % CAGR Friction Drag | Geographic Relevance | Mitigation Horizon |
|---|---|---|---|
| Volatile steel, resin and energy input costs | -1.3% | North America core, EU, APAC manufacturing hubs | Medium term (2-4 years) |
| Persistent logistics and supply chain instability | -1.1% | APAC logistics corridors, EU, North America | Medium term (2-4 years) |
| Material durability and failure-risk management complexity | -1.0% | Global, with India, SE Asia, aging OECD networks | Long term (≥ 4 years) |
| On-site construction, ground conditions and urban-congestion hurdles | -0.9% | Dense EU cities, India metros, Latin America | Medium term (2-4 years) |
| Modernization gap between legacy networks and smart-water systems | -0.9% | North America, EU, APAC emerging markets | Long term (≥ 4 years) |
| Talent, standards enforcement and QA/QC execution deficits | -0.8% | Global, acute in emerging markets | Long term (≥ 4 years) |
Geopolitical Impact Analysis
Geopolitical Realignment and Supply Chain Fragmentation Reshaping Water and Wastewater Pipe Manufacturing.
The global water and wastewater pipe market is facing significant geopolitical and supply-chain pressures that are increasing production and project costs across both steel and plastic pipe segments. In March 2025, the United States expanded Section 232 tariffs, imposing a 25% duty on all steel and aluminum imports and increasing affected steel import volumes from 7 million to 26 million metric tons. By August 2025, the measure was extended to 407 additional HTS codes, including steel pipe fittings under HTS 7307, which now face tariffs of up to 50%.
In Europe, proposed safeguards would reduce tariff-free steel import quotas from 33 million to 18 million tonnes and raise above-quota duties to 50% from July 2026. Meanwhile, China, which produces more than 53% of global crude steel and exported 107.72 million tonnes in the first eleven months of 2025, continues to influence global pricing, prompting countries such as India to introduce a 12% safeguard duty on selected steel imports. Although the World Bank projected a 10% decline in metals prices for 2025, tariff-driven costs continue to offset much of this benefit.
Logistics and energy markets are adding further pressure. According to UNCTAD, global maritime trade growth slowed to 0.5% in 2025 as geopolitical tensions disrupted shipping routes. Around 70% of cargo previously using the Red Sea is now rerouted through the Cape of Good Hope, adding 10–14 days to transit times and more than $1 million in fuel costs per voyage.
Freight rates on the Shanghai Rotterdam route rose 137% at the peak of the disruption, while insurance premiums for Red Sea transits increased by about 400%. At the same time, HDPE and PVC pipe manufacturers continue to face volatile resin costs linked to crude oil and natural gas markets. These combined factors are creating a margin-compression environment, increasing procurement risks and making pricing decisions more challenging for pipe manufacturers and infrastructure developers worldwide.
Regional Analysis
Asia Pacific Held the Largest Share of the Global Water and Wastewater Pipe Market.
Asia Pacific leads the global water and wastewater pipe market with 52.8%, thanks to rapid urban growth, government projects, and ongoing struggles with water shortages. According to the Asian Development Bank’s Asian Water Development Outlook 2025, while some progress has been made 2.7 billion more people are less insecure about water access since 2013 big issues remain.
Furthermore, as per Asian Development Bank around 1.5 billion folks in rural spots and 600 million in cities still need basic water and sanitation services, to tackle this, it’s estimated that Asia-Pacific needs to pony up $4 trillion by 2040. Right now, though, only 40% of that is covered by current public funds. So governments in China, India, and other parts of Southeast Asia have little choice but to push forward with expanding their pipe networks.
North America accounts for the fastest growing segment. The US Infrastructure Investment and Jobs Act, a huge federal water investment, is a big reason why. This initiative dishes out around $43.5 billion for water infrastructure through EPA programs, with another $50 billion set aside to revamp and upgrade pipes across the country over the next five years.
Key Regions and Countries Covered
- North America
- The US
- Canada
- Europe
- Germany
- France
- The UK
- Spain
- Italy
- Russia & CIS
- Rest of Europe
- APAC
- China
- Japan
- South Korea
- India
- ASEAN
- Rest of APAC
- Latin America
- Brazil
- Mexico
- Rest of Latin America
- Middle East & Africa
- GCC
- South Africa
- Rest of MEA
Key Players Analysis
Water and wastewater pipe manufacturers are navigating an increasingly competitive landscape by doubling down on what differentiates them better materials, smarter production, and tighter supply chain control. The push toward high-density polyethylene, advanced composite formulations, and improved PVC compounds reflects a clear industry-wide recognition that municipalities now demand pipes that last longer, resist corrosion more effectively, and perform reliably under higher pressures across both potable water and wastewater applications. Trenchless-compatible pipe design has become a particular area of investment focus, as urban utilities increasingly specify installation methods that minimize surface disruption, pushing manufacturers to engineer products with superior joint flexibility and wall integrity from the outset.
Behind the scenes, the commercial logic is equally deliberate. Securing polymer resin supply through vertical integration shields margins from petrochemical price swings, while expanding production footprint across Asia Pacific keeps manufacturers close to where the bulk of government-led urbanization spending is actually flowing. Compliance with domestic sourcing mandates such as Buy America requirements embedded in U.S. federal water funding is reshaping procurement qualification strategies. Long-term supply agreements with municipal water authorities and utilities serve a dual purpose: they provide revenue visibility and effectively raise switching costs, locking in positioning within high-value infrastructure replacement programs before competitors can enter.
The Major Players In The Industry
- JM Eagle, Inc.
- Aliaxis Holdings SA
- China Lesso Group Holdings Limited
- Orbia (Mexichem)
- Georg Fischer Ltd.
- The Supreme Industries Limited
- Sekisui Chemical Co., Ltd.
- Finolex Industries Ltd.
- Astral Pipes
- Westlake Corporation
- Advanced Drainage Systems, Inc.
- Uponor Corporation
- Wavin N.V.
- Pipelife International GmbH
- National Pipe and Plastics, Inc.
- Others
Key Development
- In September 2025, Advanced Drainage Systems, Inc. completed its $1 billion all-cash acquisition of National Diversified Sales from Norma Group SE, expanding into residential water management, irrigation, and access box solutions to solidify its position as a comprehensive end-to-end water solutions provider.
- In October 2024, Aliaxis Holdings SA launched a new PVC pipe line featuring integrated fiber optic sensing for real-time leak detection and pipeline integrity management across municipal water distribution networks.
Report Scope
| Report Features | Description |
|---|---|
| Market Value (2025) | USD 74.7 Bn |
| Forecast Revenue (2035) | USD 123.4 Bn |
| CAGR (2026-2035) | 5.2% |
| Base Year for Estimation | 2025 |
| Historic Period | 2020-2024 |
| Forecast Period | 2026-2035 |
| Report Coverage | Revenue Forecast, Market Dynamics, Competitive Landscape, Recent Developments |
| Segments Covered | By Material Type (Plastic Pipe, Ductile Iron Pipe, Concrete Pipe, Steel Pipe, Clay Pipe), By Diameter (Up to 1200 mm, 1200 mm to 3600 mm, Above 3600 mm), By Application (Water Supply and Distribution, Wastewater Management), By End Use (Municipal, Industrial, Agricultural) |
| Regional Analysis | North America – The US & Canada; Europe – Germany, France, The UK, Spain, Italy, Russia & CIS, Rest of Europe; APAC– China, Japan, South Korea, India, ASEAN & Rest of APAC; Latin America– Brazil, Mexico & Rest of Latin America; Middle East & Africa– GCC, South Africa, & Rest of MEA |
| Competitive Landscape | JM Eagle, Inc., Aliaxis Holdings SA, China Lesso Group Holdings Limited, Orbia (Mexichem), Georg Fischer Ltd., The Supreme Industries Limited, Sekisui Chemical Co., Ltd., Finolex Industries Ltd., Astral Pipes, Westlake Corporation, Advanced Drainage Systems, Inc., Uponor Corporation, Wavin N.V., Pipelife International GmbH, National Pipe and Plastics, Inc., Others. |
| Customization Scope | Customization for segments, region/country-level will be provided. Moreover, additional customization can be done based on the requirements. |
| Purchase Options | We have three licenses to opt for: Single User License, Multi-User License (Up to 5 Users), Corporate Use License (Unlimited Users and Printable PDF) |





































