


Report Overview
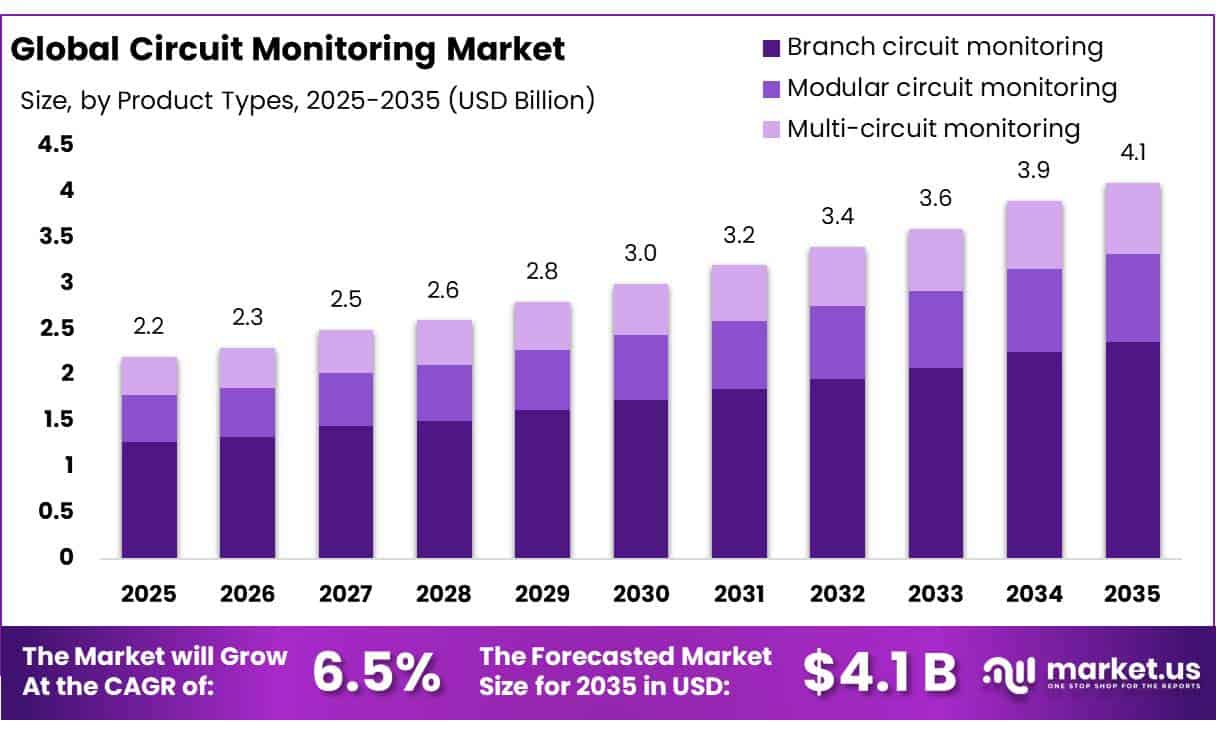
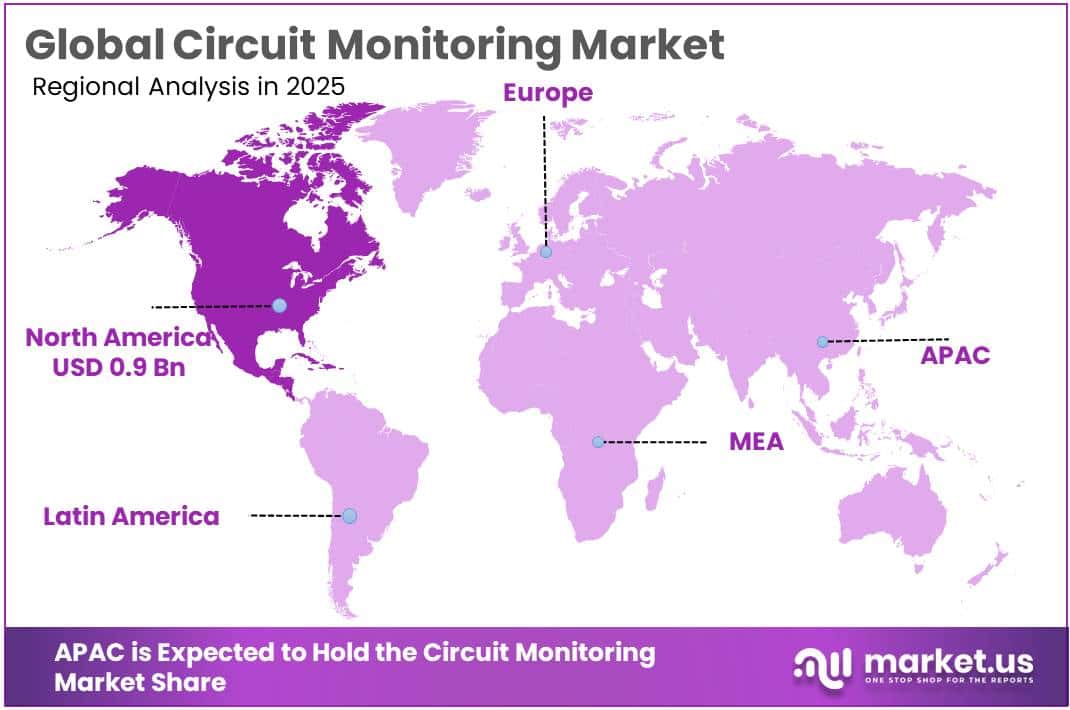
The Global Circuit Monitoring Market size is expected to be worth around USD 4.1 Billion by 2035, from USD 2.2 Billion in 2025, growing at a CAGR of 6.5% during the forecast period from 2026 to 2035. In 2025, North America held a dominant market position, capturing more than a 45.00% share, holding USD 0.9 Billion revenue.
Circuit monitoring is becoming an important part of industrial power management as factories, process plants, data centres and commercial facilities require continuous visibility into current, voltage, power quality, breaker status and branch-level consumption.
- The International Energy Agency expects global electricity demand to rise 3.6% in 2026 and 3.8% in 2027, compared with 3.0% growth in 2025. Higher electrical loading increases the value of real-time monitoring for preventing overloads, identifying abnormal consumption and supporting preventive maintenance.
Key Takeaways
- Circuit Monitoring Market size is expected to be worth around USD 4.1 Billion by 2035, from USD 2.2 Billion in 2025, growing at a CAGR of 6.5%.
- Branch circuit monitoring held a dominant market position, capturing more than a 57.80% share.
- Data Centers held a dominant market position, capturing more than a 41.5% share.
- Data Centers held a dominant market position, capturing more than a 41.5% share.
- North America remained the leading regional market in 2025, accounting for 45.00% of Circuit Monitoring demand and representing about USD 0.90 billion in value.
The industrial scenario is especially relevant in chemicals, where motors, pumps, compressors, heating systems and control networks depend on reliable electricity. Cefic reports that the EU chemical industry consumed 149 TWh of electricity and 324 TWh of natural gas in 2023, while chemical capacity utilisation remained around 74% in early 2026. These conditions encourage producers to improve energy visibility, identify inefficient equipment and manage electrical assets more closely when energy costs and production economics remain under pressure.
- The U.S. Department of Energy reported that American data centres used 176 TWh of electricity in 2023 and could consume 6.7% to 12% of total U.S. electricity by 2028, with annual usage potentially reaching 325 TWh to 580 TWh. As loads become denser and more dynamic, operators need branch-circuit information to balance capacity, detect abnormal current, manage cooling loads and reduce the risk of local electrical faults.
Government-backed grid modernisation is also creating a supportive environment. The U.S. Department of Energy is administering USD 10.5 billion through the Grid Resilience and Innovation Partnerships program, had announced more than USD 6 billion through its first two funding rounds, and announced about USD 1.9 billion for the SPARK funding opportunity in March 2026.
Europe provides another major pathway for circuit monitoring adoption. The European Commission estimates that EUR 584 billion of electricity-grid investment is needed during 2020–2030, including around EUR 170 billion for digitalisation, while about 40% of European distribution grids are already more than 40 years old.
By Product Types Analysis
Branch circuit monitoring leads the Product Type segment with a 57.80% share
In 2025, “Branch circuit monitoring” held a dominant market position, capturing more than a 57.80% share. The segment remains important because it allows operators to track individual electrical circuits and quickly identify overloads, unusual consumption patterns, capacity issues and equipment faults. This capability is increasingly valuable in data centres, factories and other power-intensive facilities.
- The U.S. Energy Information Administration reported in 2026 that data-centre servers accounted for an estimated 7% of U.S. commercial-sector electricity consumption in 2025. EIA also forecast U.S. electricity load to increase by 1.9% in 2026, reflecting rising loads from data centres and industrial facilities.
Modular circuit monitoring is gaining stronger industrial importance because its flexible design allows monitoring capacity to be expanded as electrical panels, production equipment, server racks and connected loads increase. This approach is particularly useful for large facilities that require monitoring systems to adapt without replacing the complete electrical-monitoring architecture.
U.S. electricity generation reached 4.43 thousand TWh in 2025, while commercial-sector electricity sales increased by 2.9% and industrial-sector electricity sales rose by 0.7% from the previous year. These government-reported figures indicate increasing electrical activity across sectors where scalable metering and monitoring can support energy management, fault detection and operational planning.
By End Users Analysis
Data Centers dominate the Circuit Monitoring Market with a 41.5% share
In 2025, “Data Centers” held a dominant market position, capturing more than a 41.5% share. Data centers depend heavily on circuit monitoring because servers, cooling equipment, UPS systems and power distribution units require continuous load tracking to avoid overloads and unexpected downtime.
- According to the U.S. Energy Information Administration, data-center servers accounted for an estimated 7% of U.S. commercial-sector electricity consumption in 2025. In March 2026, the EIA also identified 196 companies operating data centers across its pilot-study regions for a new energy-use survey.
Industrial facilities are an important end-user segment for circuit monitoring because manufacturing plants operate large numbers of motors, pumps, compressors, production lines and automated electrical systems. U.S. Energy Information Administration data show that industrial electricity sales reached 1,042,217 thousand MWh in 2025.
During the first five months of 2026, industrial-sector electricity sales reached 421,749 thousand MWh, while industrial electricity sales in May 2026 were 1.9% higher than in May 2025. This level of electricity use creates a strong operational need for circuit monitoring systems that help facilities identify overloaded circuits, detect abnormal equipment behaviour, improve maintenance planning and control power consumption across production operations.
By Applications Analysis
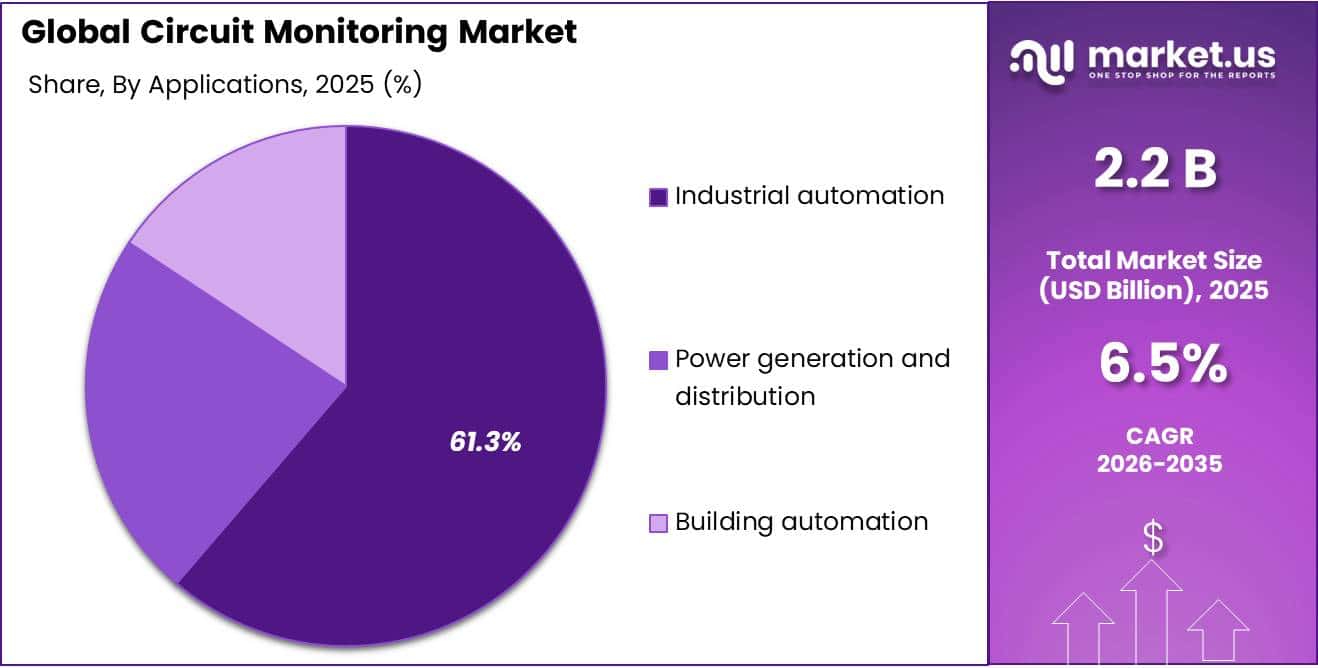
Industrial Automation dominates with a 61.00% share
In 2025, “Industrial automation” held a dominant market position, capturing more than a 61.00% share. Automated factories increasingly depend on circuit monitoring to track the electrical condition of robots, motors, drives, production machinery and control panels. According to the International Federation of Robotics, U.S. factories installed 38,000 industrial robots in 2025, representing an 11% year-over-year increase.
- Automotive facilities installed 13,500 units, while U.S. manufacturing reached a robot density of 307 robots per 10,000 employees. This expanding automation base supports demand for continuous current measurement, overload detection, energy monitoring and predictive maintenance at machine and production-line level.
Power generation and distribution is an important application for circuit monitoring because utilities require continuous information on electrical loads, feeder conditions, voltage behaviour and equipment performance.
The U.S. Energy Information Administration reported in March 2026 that U.S. electricity generation reached a record 4.43 thousand TWh in 2025, increasing 2.8% from the previous year. Renewable sources supplied around 24% of utility-scale generation, while natural gas accounted for about 41%.
Key Market Segments
By Product Types
- Modular circuit monitoring
- Branch circuit monitoring
- Multi-circuit monitoring
By End Users
- Data Centers
- Industrial facilities
- Commercial buildings
- Residential complexes
By Applications
- Industrial automation
- Power generation and distribution
- Building automation
Driver Analysis
AI Data-Center Power Density
AI infrastructure is the largest near-term demand catalyst because high-density GPU clusters move monitoring requirements from facility-level meter reading to branch-circuit-level visibility, where operators need to identify overloads, phase imbalance, harmonic distortion, breaker utilization, and stranded power before they compromise uptime.
- Global data-center electricity consumption is forecast to nearly double from roughly 485 TWh in 2025 to about 950 TWh by 2030, equivalent to approximately 3% of global electricity demand; AI-focused data centers grew electricity consumption by about 50% during 2025, versus 17% for the broader data-center category.
At rack level, GPU-intensive deployments can require 30-100 kW compared with historical enterprise-rack densities of roughly 5-15 kW, meaning a 10 MW facility operating at 95% occupancy can no longer manage distribution through periodic manual measurements or annual panel audits.
Drivers Impact Analysis
| Driver | (~) % Impact on CAGR Forecast | Geographic Relevance | Impact Timeline |
|---|---|---|---|
| AI data-center power density | +1.8% | North America, China, EU, APAC hubs | Medium term (2-4 years) |
| EPBD smart-building mandates | +1.2% | EU core, UK spill-over | Short term (≤ 2 years) |
| Grid-edge DER visibility | +1.1% | North America, EU, Australia, APAC | Long term (≥ 4 years) |
| EV charging load management | +1.0% | EU, North America, China, India | Medium term (2-4 years) |
| Electrified building retrofits | +0.9% | EU, North America, developed APAC | Long term (≥ 4 years) |
| Uptime and power-quality analytics | +0.8% | Data centers, hospitals, industry globally | Short term (≤ 2 years) |
Restraint Analysis
Legacy Panel Retrofit Cost
The installed base of commercial switchboards, panelboards, remote power panels, busways, and distribution boards was largely designed for manual meter reading and does not provide spare physical space, wiring pathways, communications ports, or safe access for high-channel-count circuit-monitoring equipment.
Retrofitting a 42-circuit panel can require split-core current transformers, voltage reference wiring, a multi-circuit meter, gateway, power supply, enclosure modifications, commissioning, arc-flash procedures, and network integration; hardware may represent only 25-40% of installed cost, while licensed electrical labor, planned shutdowns, testing, and documentation account for the balance.
A basic retrofit can cost approximately USD 4,000-12,000 per panel, and a mission-critical panel with redundant communications, revenue-grade measurement, cybersecurity hardening, and after-hours commissioning can reach USD 15,000-35,000; for a 20-panel office, hospital, or industrial site, this creates a USD 80,000-500,000 budget hurdle before analytics subscriptions are considered.
Restraint Impact Analysis
| Restraint | (~) % Impact on CAGR Forecast | Geographic Relevance | Impact Timeline |
|---|---|---|---|
| Legacy panel retrofit cost | -1.3% | North America, EU, developed APAC | Medium term (2-4 years) |
| Electronics tariff inflation | -1.0% | North America, China-linked supply chains | Short term (≤ 2 years) |
| Interoperability fragmentation | -0.9% | Global; EU, North America, APAC | Medium term (2-4 years) |
| Cybersecurity compliance burden | -0.8% | EU core, UK, North America spill-over | Medium term (2-4 years) |
| Projected ROI uncertainty | -0.7% | Commercial buildings, SMEs globally | Short term (≤ 2 years) |
| Skilled installer scarcity | -0.6% | North America, EU, Australia, APAC | Long term (≥ 4 years) |
Opportunity Analysis
Power Observability SaaS
The white space is a vendor-neutral subscription platform that ingests circuit-level electrical data, applies asset hierarchies and tariff logic, detects abnormal load signatures, forecasts feeder overload, benchmarks sites, supports tenant billing, and produces audit-ready utility, ESG, and maintenance reports; a typical enterprise portfolio of 50 sites and 5,000–15,000 monitored circuits could support USD 2-8 per circuit per month in recurring software and analytics fees, creating USD 120,000-1.44 million of annual recurring revenue with gross margins potentially 20-35 percentage points above hardware distribution.
The strategic payoff is a shift from lumpy panel-project revenue to a 5-10-year SaaS relationship with annual net revenue retention potentially above 105% as customers add sites, circuits, power-quality modules, and demand-response functions, while remote commissioning and self-service analytics can reduce customer-acquisition and field-service cost by an estimated 15-25%.
Opportunity Impact Analysis
| Opportunity | (~) % Potential CAGR Upside | Geographic Relevance | Execution Window |
|---|---|---|---|
| Power observability SaaS | +1.6% | North America, EU, China, APAC hubs | Medium term (2-4 years) |
| AI data-center capacity optimization | +1.4% | North America, China, EU, Singapore, Japan | Short term (≤ 2 years) |
| DER aggregation measurement stack | +1.2% | North America, EU, Australia, Japan | Medium term (2-4 years) |
| Managed power-quality services | +1.0% | Hospitals, industry, data centers globally | Medium term (2-4 years) |
| Electrical retrofit-as-a-service | +0.9% | North America, EU, developed APAC | Long term (≥ 4 years) |
| Fragmented metering M&A roll-up | +0.7% | India, Southeast Asia, Latin America, Europe | Short term (≤ 2 years) |
Challenges Analysis
Grid-Capacity Planning Mismatch
Circuit monitoring demand is increasingly attached to data-center, EV, battery, heat-pump, and electrification projects, yet the underlying expansion plans often move faster than utility interconnection and transmission capacity, creating a mismatch between monitoring equipment orders and the energized loads that justify full deployment. U.S. data-center power demand is projected to rise from 31 GW in 2025 to 41 GW in 2026 and 66 GW in 2027, but only roughly 50-60% of scheduled capacity is expected to arrive on time because supply-chain and labor constraints continue to delay construction and grid delivery.
Interconnection queues now reach approximately seven years in some U.S. markets, while the Netherlands can face load-connection waiting periods of up to 10 years; the IEA estimates around 20% of planned data-center projects globally could experience significant grid-related delays.
Suppliers need to pair hardware with phased deployment plans, temporary-generation and microgrid monitoring, load-study services, and modular systems that can begin at 10-20% of final capacity, but grid construction, permitting, and transformer availability make this a four-plus-year normalization challenge.
Challenges Impact Analysis
| Challenge | (~) % CAGR Friction Drag | Geographic Relevance | Mitigation Horizon |
|---|---|---|---|
| Grid-capacity planning mismatch | -1.1% | North America, EU, China, APAC data-center hubs | Long term (≥ 4 years) |
| Electrical-digital talent gap | -0.9% | North America, EU, Australia, developed APAC | Long term (≥ 4 years) |
| Legacy data normalization | -0.8% | Global commercial and industrial estates | Medium term (2-4 years) |
| OT cybersecurity lifecycle burden | -0.7% | EU, North America, Japan, South Korea | Medium term (2-4 years) |
| Sensor accuracy drift | -0.6% | Data centers, hospitals, industry globally | Medium term (2-4 years) |
| Complex multi-site commissioning | -0.5% | Global enterprise portfolios | Short term (≤ 2 years) |
Geopolitical Impact Analysis
The ongoing Russia–Ukraine war and the 2026 Middle East conflict are reshaping conditions for the Circuit Monitoring market by increasing energy-security concerns, logistics risk and the need for resilient electrical infrastructure.
UN Trade and Development reported that disruption around the Strait of Hormuz caused ship transits to fall by about 95% in 2026, while the route normally carries around one-quarter of global seaborne oil trade. Higher fuel, freight and insurance costs can raise procurement expenses for meters, sensors, controllers and other electronic monitoring components moved through international supply chains.
At the same time, conflict-related pressure on power systems is strengthening demand for real-time circuit visibility. The International Energy Agency notes that Ukraine’s firm electricity import capacity has been set at 2.1 GW during winter months, underlining the importance of flexible and closely monitored electricity networks. For industrial users, data centres and critical facilities, circuit monitoring helps identify overloads, abnormal consumption and equipment faults before they develop into wider outages.
Regional Insights
North America Leads with 45.00% Share and USD 0.90 Billion
North America remained the leading regional market in 2025, accounting for 45.00% of Circuit Monitoring demand and representing about USD 0.90 billion in value. The region benefits from a large base of data centers, advanced manufacturing facilities, commercial buildings, and modern power infrastructure that increasingly require circuit-level visibility.
In 2025, data-center servers alone represented an estimated 7% of U.S. commercial-sector electricity consumption, according to the U.S. Energy Information Administration. Rising server loads, grid modernization programs, and stronger attention to power reliability are encouraging wider installation of branch meters, smart sensors, and connected monitoring systems across critical facilities throughout the region.
Asia Pacific is expected to be the fastest-growing regional market, supported by rising electricity consumption, industrial expansion, data-center development, and continued grid digitalization. The International Energy Agency reported that China’s net electricity demand exceeded 9,500 TWh in 2025, while electricity consumption increased by 5.1% during the year. Southeast Asia also recorded electricity-demand growth of around 3% in 2025.
Key Regions and Countries Insights
- North America
- US
- Canada
- Europe
- Germany
- France
- The UK
- Spain
- Italy
- Rest of Europe
- Asia Pacific
- China
- Japan
- South Korea
- India
- Australia
- Rest of APAC
- Latin America
- Brazil
- Mexico
- Rest of Latin America
- Middle East & Africa
- GCC
- South Africa
- Rest of MEA
Key Players Analysis
ABB Ltd. remains a major circuit monitoring supplier through its Electrification portfolio, which includes circuit breakers, digital devices, switchgear, and power-management solutions. In 2025, ABB generated USD 33.22 billion in total revenue, while Electrification contributed USD 17.36 billion. Electrification orders reached USD 18.76 billion, rising 14%, and its year-end backlog increased 26% to USD 9.44 billion. Data-center demand was particularly strong, with several large Electrification orders totaling about USD 600 million during the year across critical industrial and commercial facilities.
Schneider Electric SE holds a strong position in circuit monitoring through its Energy Management business, including connected breakers, metering, power-quality monitoring, and digital energy-management platforms. In 2025, the company reported EUR 40.15 billion in revenue, with organic sales increasing 8.9%. Energy Management grew 10% organically during the year. Momentum continued into 2026, when first-half group revenue reached EUR 21.2 billion and Energy Management expanded 18% organically, supported by strong demand from data centers and electrification projects globally and modern infrastructure.
Eaton Corporation plc supports circuit monitoring through its electrical distribution, protection, metering, and intelligent power-management portfolio. In 2025, Electrical Americas generated USD 13.28 billion in net sales, increasing 16% from 2024, while operating profit reached USD 3.97 billion. Its operating margin stood at 29.9%. In the fourth quarter, Electrical Global sales reached USD 1.7 billion, up 10%, while operating profit increased 23% to USD 340 million, reflecting strong demand for electrical infrastructure and power-management solutions across major global end-use markets.
Top Key Players Outlook
- ABB Ltd.
- Schneider Electric SE
- Eaton Corporation plc
- Legrand S.A.
- Siemens AG
- Toshiba International Corporation
- Socomec Group S.A.
- OMRON Corporation
- Accuenergy Inc.
- NHP Electrical Engineering Products Pty Ltd.
- Acrel Co., Ltd.
- Packet Power, LLC
- CircuitMeter Inc.
- Senva Inc.
Anord Mardix
Recent Developments
- July 2026, Siemens announced a EUR 300 million investment in German power-distribution manufacturing, with plans to create up to 700 jobs. Financially, Siemens Smart Infrastructure generated EUR 22.989 billion in FY2025 revenue and ended the year with an order backlog of about EUR 19 billion, highlighting strong demand for electrification, monitoring and intelligent power-distribution technologies.
- In May 2026, Toshiba International Corporation expanded its product portfolio with the modular 3000 TP UPS, offering efficiency of 96.5% and capacities up to 200 kW, together with diagnostic and RemotEye IIoT monitoring functions.
Report Scope
| Report Features | Description |
|---|---|
| Market Value (2025) | USD 2.2 Bn |
| Forecast Revenue (2035) | USD 4.1 Bn |
| CAGR (2026-2035) | 6.5% |
| Base Year for Estimation | 2025 |
| Historic Period | 2020-2024 |
| Forecast Period | 2026-2035 |
| Report Coverage | Revenue Forecast, Market Dynamics, Competitive Landscape, Recent Developments |
| Segments Covered | By Product Types (Modular circuit monitoring, Branch circuit monitoring, Multi-circuit monitoring), By End Users (Data Centers, Industrial facilities, Commercial buildings, Residential complexes), By Applications (Industrial automation, Power generation and distribution, Building automation) |
| Regional Analysis | North America – US, Canada; Europe – Germany, France, The UK, Spain, Italy, Rest of Europe; Asia Pacific – China, Japan, South Korea, India, Australia, Singapore, Rest of APAC; Latin America – Brazil, Mexico, Rest of Latin America; Middle East & Africa – GCC, South Africa, Rest of MEA |
| Competitive Landscape | ABB Ltd., Schneider Electric SE, Eaton Corporation plc, Legrand S.A., Siemens AG, Toshiba International Corporation, Socomec Group S.A., OMRON Corporation, Accuenergy Inc., NHP Electrical Engineering Products Pty Ltd., Acrel Co., Ltd., Packet Power, LLC, CircuitMeter Inc., Senva Inc., Anord Mardix |
| Customization Scope | Customization for segments, region/country-level will be provided. Moreover, additional customization can be done based on the requirements. |
| Purchase Options | We have three licenses to opt for: Single User License, Multi-User License (Up to 5 Users), Corporate Use License (Unlimited User and Printable PDF) |





































