


Report Overview
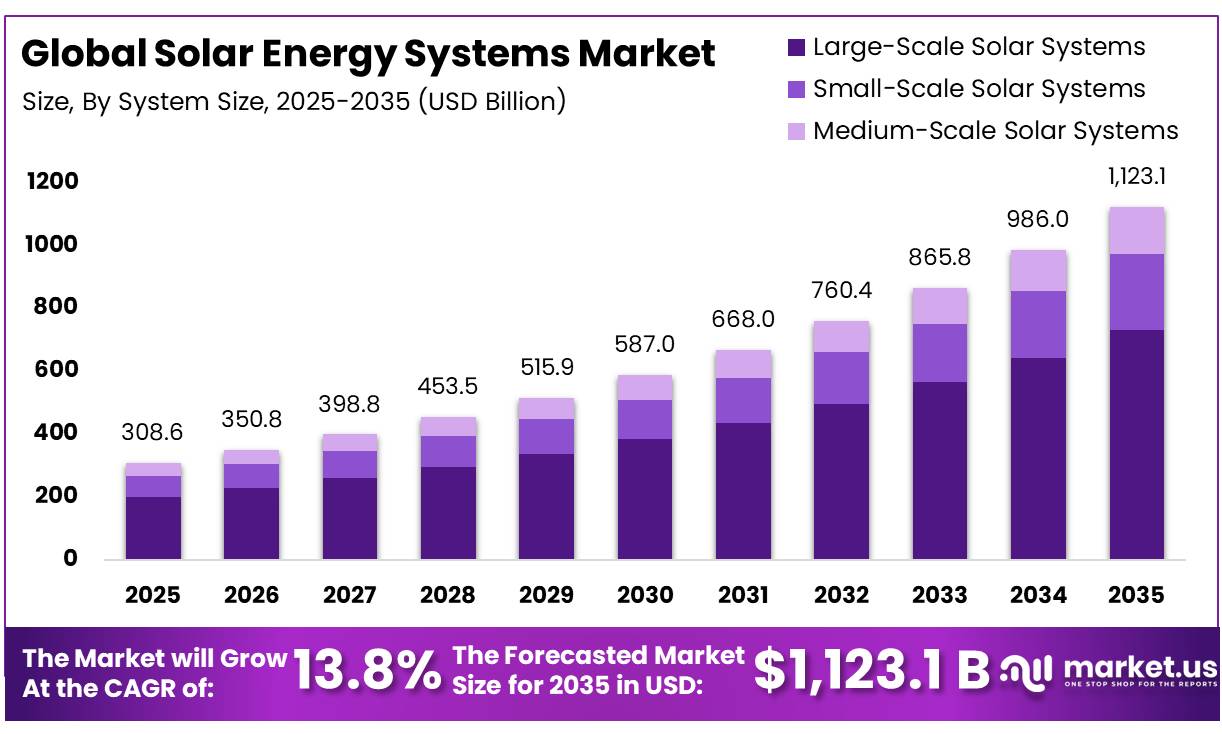
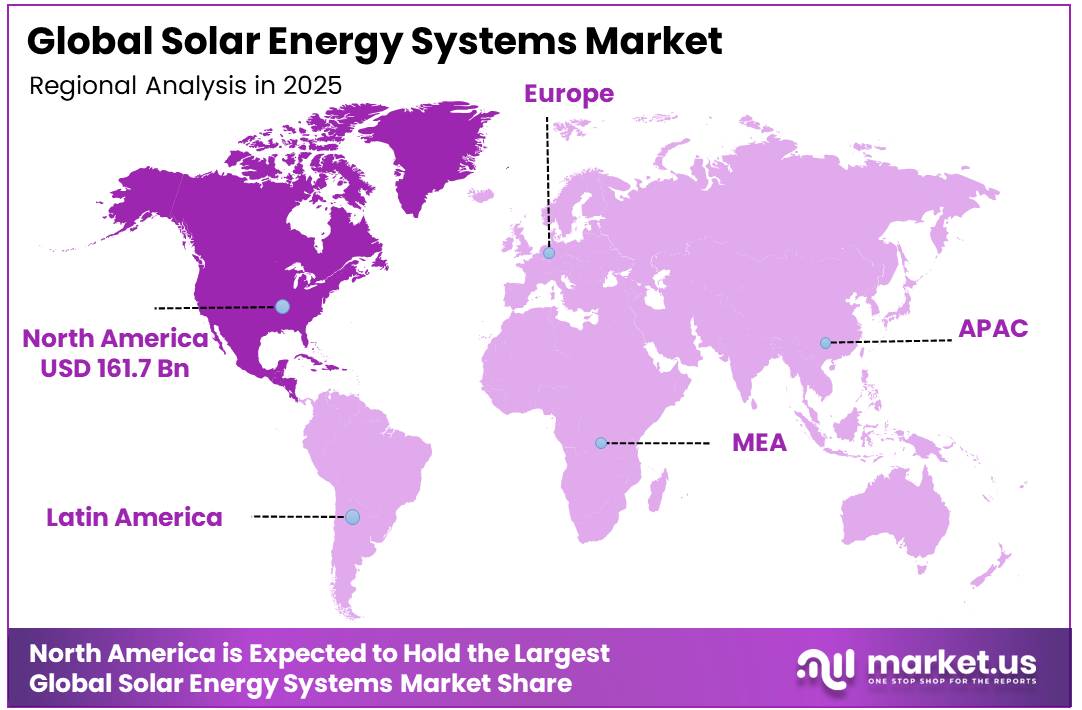
In 2025, the Global Solar Energy Systems Market was valued at USD 308.6 billion, and between 2026 and 2035, this market is estimated to register a CAGR of 13.8%, reaching about USD 1,123.1 billion by 2035. In 2025, North America led the market, achieving over 52.4% share with a revenue of USD 161.7 Billion.
Solar energy systems have moved from a supplementary generation option to a central part of power-sector planning. The industry includes utility-scale photovoltaic plants, rooftop systems, solar thermal equipment, inverters, trackers, monitoring platforms, and increasingly battery-integrated solutions.
- In 2025, global solar PV additions exceeded 600 GW, cumulative capacity reached about 2,800 GW, and solar supplied more than three-quarters of all new renewable capacity. This scale is strengthening procurement networks, engineering services, project finance, grid-connection activity, and long-term operations and maintenance demand across developed and emerging economies.
Key Takeaways
- The Global Solar Energy Systems Market was valued at USD 308.6 billion in 2025.
- The market is projected to grow at a CAGR of 13.8% and is estimated to reach USD 1,123.1 billion by 2035.
- On the basis of technology, Solar Photovoltaic (PV) dominated the market, constituting 85.1% of the total market share.
- Based on the product, Solar Panels dominated the market, with a substantial market share of around 43.2%.
- Based on the system type, Grid-Connected Solar Systems led the market, comprising 89.3% of the total market.
- On the basis of system size, Large-Scale Solar Systems dominated the market, constituting 65.2% of the total market share.
- Based on the installation type, Ground-Mounted Solar Systems dominated the market, with a substantial market share of around 68.1%.
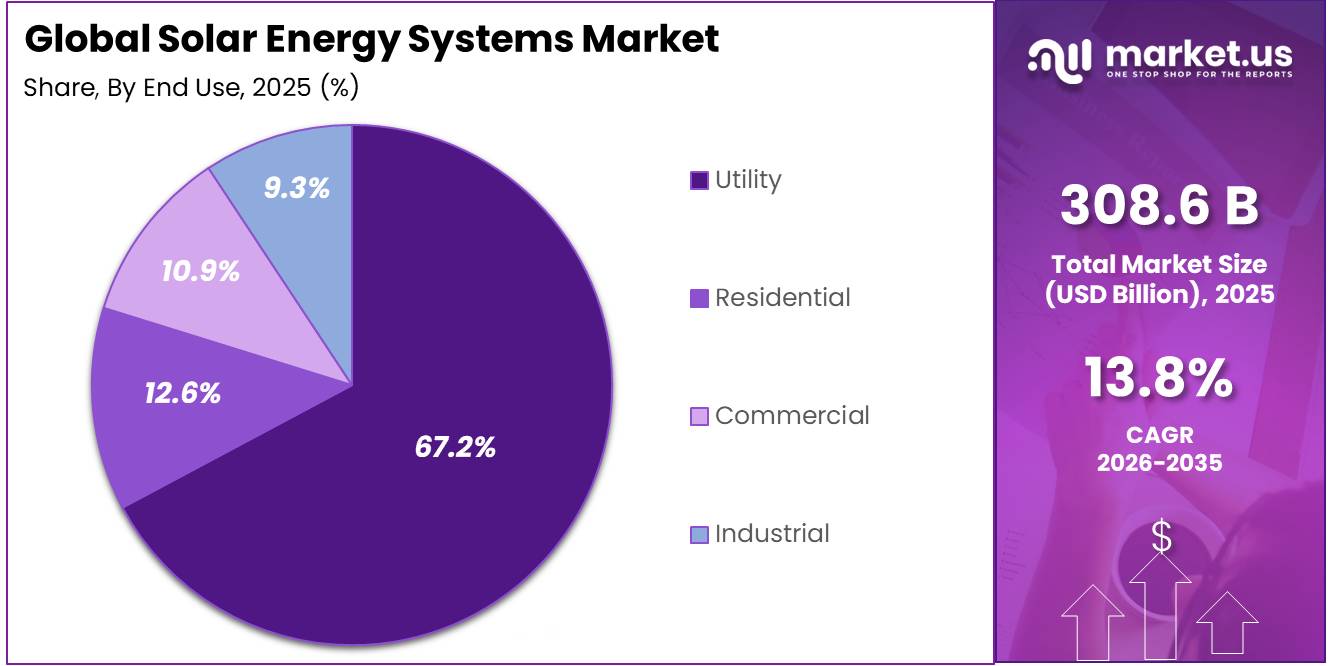
- Based on the end use, Utility led the market, comprising 67.2% of the total market.
- In 2025, North America was the most dominant region in the market, accounting for 52.4% of the total global consumption.
Cost competitiveness remains the strongest commercial driver. Standardised module production, higher cell efficiency, bifacial designs, improved trackers, digital asset management, and competitive auctions have reduced lifetime electricity costs. IRENA reported that newly commissioned utility-scale solar PV delivered electricity at a global weighted-average cost of USD 0.043 per kWh in 2024, around 41% below the cheapest new fossil-fuel alternative, while average installed cost fell to USD 691 per kW. This economics are encouraging utilities, businesses, municipalities, and households to use solar for cost control, decarbonisation, and greater long-term energy security.
- In 2025, solar PV generation increased by about 600 TWh, total output approached 2,800 TWh, and its share of global electricity exceeded 8%. However, grid congestion, permitting delays, curtailment, financing costs, and shortages of skilled installers continue to slow project conversion in several markets and raise development risk.
Government policy is widening the addressable market through auctions, tax support, rooftop obligations, public-building programmes, faster permitting, and grid investment. In the European Union, around 56.1 GW of solar capacity was added in 2025, installed capacity reached about 359 GW, and the REPowerEU pathway now targets at least 700 GW by 2030 Such measures create demand not only for panels, but also for inverters, mounting systems, cables, transformers, forecasting software, storage, recycling services, and locally manufactured components across the wider value chain.
Future growth opportunities will increasingly come from solar-plus-storage, community solar, agrivoltaics, floating PV, building-integrated systems, green-hydrogen production, and digital power trading. The IEA expects renewable capacity to expand by almost 4,600 GW between 2025 and 2030, with solar representing nearly 80% of that increase while annual solar generation growth is projected to average more than 600 TWh through 2030 Companies positioned around grid flexibility, long-duration storage, advanced inverters, module recycling, cybersecurity, and resilient supply chains are likely to capture the highest-value opportunities and recurring service revenues as electricity markets become more decentralised, automated, and reliability focused.
Technology Analysis
Solar Photovoltaic dominates the market with an 85.1% share due to its wide use across distributed and utility systems
In 2025, Solar Photovoltaic (PV) held a dominant market position, capturing more than an 85.1% share. Its leadership was supported by its modular structure, easier installation, and suitability for residential, commercial, and large power projects. The U.S. Energy Information Administration recorded 59,505.5 MW of estimated small-scale solar PV capacity in 2025. Residential small-scale PV systems also produced 63,274 thousand MWh of electricity during the year. These government figures show that PV technology has developed a broad operating base and remains the most widely adopted method for converting solar energy directly into electricity.
Concentrated Solar Power (CSP) is the fastest growing segment. In 2026, the technology is gaining attention because it can collect solar heat, store it in thermal materials, and release the energy when electricity or industrial heat is required. This gives CSP an important role in applications that need longer operating hours and high-temperature heat. The U.S. Department of Energy is supporting the development of next-generation CSP systems, including improved thermal storage, advanced receivers, and high-temperature power cycles.
Product Analysis
Solar Panels dominate the product segment with a 43.2% share
In 2025, Solar Panels held a dominant market position, capturing more than a 43.2% share. The segment remained central to solar energy systems because panels directly convert sunlight into usable electricity and are required across residential, commercial, and utility-scale installations.
- In January 2025, the U.S. Department of Energy reported that the Orion I, Orion II, and Orion III solar projects in Texas used 1.3 million solar panels manufactured in Ohio. These panels support a combined electricity-generation capacity of 875 MW, showing the large number of modules required for utility-scale solar energy systems. Larger projects also require thousands of interconnected panels, which keeps the segment ahead of other solar system products.
Charge Controllers are the fastest growing segment. In 2026, their demand is being supported by the expansion of off-grid, hybrid, and battery-backed solar systems. A controller manages electricity moving from the solar panels to the battery and protects the battery from overcharging. The parallel growth of panels and batteries is creating stronger demand for smart and maximum-power-point-tracking controllers that improve charging performance, manage changing sunlight conditions, and support reliable power supply in remote and backup applications.
System Type Analysis
Grid-Connected Solar Systems dominate with an 89.3% share, supported by strong utility integration
In 2025, Grid-Connected Solar Systems held a dominant market position, capturing more than an 89.3% share. Their leadership was supported by direct electricity supply to utility networks, net-metering programs, large solar parks, and growing investment in transmission infrastructure. In 2025, U.S. developers added 27.2 GW of utility-scale solar capacity to the electricity grid, directly supporting the expansion of grid-connected solar systems as utility-scale solar plants are designed to deliver electricity through interconnected transmission and distribution systems. Continued investment by utilities and independent power producers strengthened the adoption of grid-connected solar systems during the year.
Off-Grid Solar Systems is the fastest growing segment. In 2026, the International Renewable Energy Agency reported that solar power led the expansion of off-grid electricity capacity during 2025. Growth is being supported by demand from rural communities, farms, telecommunications sites, healthcare facilities, schools, and remote industrial operations where conventional electricity networks remain unavailable or unreliable. These systems can be installed without major transmission infrastructure and can be combined with batteries to provide electricity after sunset.
System Size Analysis
Large-Scale Solar Systems dominate with a 65.2% share as utility-scale capacity expands
In 2025, Large-Scale Solar Systems held a dominant market position, capturing more than a 65.2% share. Their leadership is supported by growing investment in utility-scale solar farms, centralized electricity generation, and large grid-connected projects. Government-backed renewable energy programs, long-term power purchase agreements, and improvements in transmission infrastructure are also encouraging developers to build larger solar facilities.
Small-Scale Solar Systems are the fastest-growing segment. Their expansion is supported by rising interest in rooftop installations, distributed power generation, modular system designs, and solutions that allow homes and smaller businesses to produce electricity close to the point of consumption. These systems can be expanded gradually and installed on existing properties, making them suitable for customers that do not require large, centralized solar facilities. Continued improvements in panels, inverters, monitoring platforms, and battery integration are also making smaller systems easier to operate and manage.
Installation Type Analysis
Ground-Mounted Solar Systems lead with a 68.1% share, supported by large utility-scale projects
In 2025, Ground-Mounted Solar Systems held a dominant market position, capturing more than a 68.1% share. Their leadership was supported by utility-scale developments that can accommodate large panel arrays, tracking systems, central inverters, and battery storage facilities.
- According to the U.S. Department of Energy, the panel-covered footprint of a ground-mounted photovoltaic array typically requires 3 to 4 acres per MWdc of installed capacity. When additional space for fencing, equipment, access routes, and unusable terrain is factored in, a complete ground-mounted solar project generally requires 5 to 6 acres per MWdc of total site area. Rooftop Solar Systems are the fastest-growing segment as on-site power adoption expands
Rooftop Solar Systems segment is the fastest-growing segment. During 2026, adoption is being supported by growing interest in on-site electricity generation across residential, commercial, and industrial buildings. Rooftop installations use existing building space, reduce the need for separate project land, and allow electricity to be consumed close to where it is generated. The segment is also benefiting from improved permitting processes, smart inverters, digital system monitoring, and the increasing use of distributed battery storage. These advantages are making rooftop systems more practical for property owners seeking greater control over electricity costs and energy resilience.
End Use Analysis
Utility End Use Dominates the Solar Energy Systems Market with a 67.2% Share
In 2025, Utility held a dominant market position, capturing more than a 67.2% share. Large solar installations remained widely preferred because they generate electricity at scale and supply power directly to centralized grids. Utility projects also support bulk power procurement, grid expansion, and long-term renewable energy requirements.
- According to the U.S. Energy Information Administration, developers planned to add 43.4 GW of new utility-scale solar capacity in 2026. This strong project pipeline is increasing demand for solar panels, inverters, tracking systems, transformers, energy storage solutions, and grid-management equipment.
Residential is the fastest growing segment. The segment is gaining momentum as households adopt rooftop solar to control electricity expenses, improve energy independence, and obtain backup power during grid interruptions. Wider access to home batteries, flexible financing, community solar programs, digital installation services, and supportive clean energy policies is making residential solar systems more accessible. The growing integration of solar panels with smart-home energy controls and battery storage is expected to strengthen residential adoption over the coming years.
Key Market Segments
By Technology
- Solar Photovoltaic (PV)
- Concentrated Solar Power (CSP)
- Solar Thermal
By Product
- Solar Panels
- Charge Controllers
- Batteries
- Inverters
- Others
By System Type
- Grid-Connected Solar Systems
- Off-Grid Solar Systems
- Hybrid Solar Systems
By System Size
- Large-Scale Solar Systems
- Small-Scale Solar Systems
- Medium-Scale Solar Systems
By Installation Type
- Rooftop Solar Systems
- Ground-Mounted Solar Systems
- Building-Integrated Solar Systems
- Floating Solar Systems
By End Use
- Utility
- Residential
- Commercial
- Industrial
Driver Analysis
India’s 500 GW Non-Fossil Target and MNRE Domestic Content Enforcement
India’s installed solar capacity has grown approximately 55.7 times, from 2.82 GW in 2014 to 157.05 GW as of the government’s latest published figures, anchored to the national target of 500 GW non-fossil capacity and roughly 280-293 GW of solar-specific capacity by 2030. The Central Electricity Authority’s own planning estimate implies the country must add roughly 40 GW of solar annually through 2030 to hit this trajectory, with MNRE committing to annual renewable bid issuance of 50 GW through 2027-28 to backstop the pipeline.
The compliance mechanism reshaping unit economics is the Approved List of Models and Manufacturers: List-I module certification has expanded from 23 manufacturers in 2019 to roughly 100 by early 2025, and as of June 1, 2026, MNRE has made it mandatory that ALMM-listed modules used in subsidy-backed and government-funded projects must themselves be fabricated from ALMM List-II certified domestic cells, closing a prior loophole that allowed imported-cell, domestically-assembled modules to qualify.
This cell-to-module localization mandate forces integrated capacity investment by players such as Waaree Energies, Adani Solar, and Reliance Industries (the latter enlisting HJT cells rated above 25% efficiency), converting India’s solar economics from an import-arbitrage, module-trading model into a vertically integrated domestic manufacturing model with materially higher upfront capital intensity but lower long-run tariff and BOM exposure.
Driver Impact Analysis
| Driver | (~) % Impact on CAGR Forecast | Geographic Relevance | Impact Timeline |
|---|---|---|---|
| U.S. tax-credit restructuring (technology-neutral 45Y/48E ITC phase-down plus 45X manufacturing credit) altering utility-scale project economics | +1.6% | North America core | Short term (≤ 2 years) |
| EU Solar Standard under the recast Energy Performance of Buildings Directive mandating solar-ready and solar-equipped construction | +2.1% | EU core, EEA spill-over | Medium term (2-4 years) |
| India’s 500 GW non-fossil capacity target with MNRE domestic content enforcement (ALMM List-I and List-II) | +2.4% | APAC corridors (India core), South Asia spill-over | Medium term (2-4 years) |
| China’s grid-parity self-consumption policy shift and distributed/C&I solar rebalancing under NEA rules | -1.2% | APAC core (China), global supply-chain spill-over | Short term (≤ 2 years) |
| Battery-storage co-location and attachment-rate acceleration under FERC/EIA interconnection reforms | +1.9% | North America core, EU, APAC corridors | Medium term (2-4 years) |
| Falling polysilicon-to-module cost curve and cell-efficiency gains (HJT/TOPCon) compressing system BOM | +1.4% | Global, APAC manufacturing core, South America spill-over | Long term (≥ 4 years) |
Restraint Analysis
US AD/CVD Tariffs on Southeast Asian Cells and Modules
The restraint originates from the US Department of Commerce’s April 2025 final affirmative determinations imposing antidumping duties as high as 271.28% on Vietnamese entities and countervailing duties reaching 3,403.96% on select Cambodian producers, following ITC’s June 2, 2025 injury finding and CBP duty collection effective June 16, 2025; the quantitative bottleneck manifests as blended landed-cost tariff bands of 14%–250% for Malaysia, 375%–972% for Thailand, and 650%–3,500% for Cambodia stacked atop pre-existing Section 201 and Section 301 duties, compressing module procurement economics for US developers who had sourced roughly 80% of cells from these four countries pre-2025; the strategic business impact is a forced and costly re-routing of supply chains toward higher-cost domestic or non-covered-origin cells, delayed CapEx deployment as developers renegotiate EPC contracts, and gross margin compression of an estimated 300-500 basis points for import-dependent installers through 2027 as inventory built ahead of the June 2025 order is depleted.
Restraint Impact Analysis
| Restraint | (~) % Impact on CAGR Forecast | Geographic Relevance | Impact Timeline |
|---|---|---|---|
| US AD/CVD Tariffs on Southeast Asian Cells/Modules | -2.8% | US utility-scale and C&I segments; Cambodia, Malaysia, Thailand, Vietnam export corridors | Short term (≤2 years) |
| Federal Tax Credit Rollback (OBBBA, Sec. 25D/48E/45X FEOC rules) | -2.2% | US residential and distributed generation core; indirect effect on domestic manufacturing supply chain | Medium term (2-4 years) |
| Grid Interconnection Queue Backlog | -1.9% | North America core (PJM, MISO, ERCOT, CAISO); emerging bottlenecks in EU transmission corridors | Long term (≥4 years) |
| UFLPA/CBP Forced-Labor Import Detentions | -1.4% | US import corridor; upstream Xinjiang polysilicon supply chain affecting global module producers | Medium term (2-4 years) |
| Critical Mineral (Silver) Cost and Supply Constraint | -1.1% | Global cell/module manufacturing base; APAC production corridors (China, India, Southeast Asia) | Long term (≥4 years) |
| EU CBAM Carbon Cost Pass-Through | -0.9% | EU-27 import market; exporting manufacturing hubs in China, Southeast Asia, India | Medium term (2-4 years) |
| India ALMM Domestic Content Mandate | -0.7% | India utility-scale and government-tendered projects (APAC corridor) | Short term (≤2 years) |
Opportunity Analysis
Agrivoltaics and Dual-Use Land Monetization
Baseline solar CAGR assumes conventional ground-mount or rooftop siting, but the emerging agrivoltaics model co-locating panels with crop or grazing land unlocks a land-constrained adjacent TAM that is not yet reflected in national capacity targets, including India’s 280 GW solar goal and EU agricultural-policy-linked renewable siting rules.
Early-stage economics suggest agrivoltaic installations can command a land-lease revenue premium of 20-30% over standard ground-mount leasing while improving crop-yield-adjusted land productivity by 15-60% depending on crop type, effectively creating a dual-revenue unit economic shift that baseline models do not price in; this represents a long-horizon regulatory and zoning white space, since most jurisdictions still lack standardized agrivoltaic permitting frameworks, making it a strategic pivot rather than a current driver of installed capacity growth.
Opportunity Impact Analysis
| Opportunity | (~) % Potential CAGR Upside | Geographic Relevance | Execution Window |
|---|---|---|---|
| Solar-plus-storage monetization via merchant/ancillary revenue stacking | +2.2% | U.S. core (ERCOT, CAISO), EU balancing markets | Medium term (2-4 years) |
| Distributed/rooftop solar securitization and yieldco roll-ups | +1.8% | North America, EU, APAC (India, Australia) | Medium term (2-4 years) |
| Agrivoltaics and dual-use land monetization | +1.5% | EU, India, APAC emerging markets | Long term (≥4 years) |
| Green hydrogen and solar-to-fuel adjacency | +2.5% | India, Middle East (govt.-backed zones), EU | Long term (≥4 years) |
| Domestic manufacturing incentive arbitrage (PLI/45X roll-up M&A) | +2.0% | India (PLI states), U.S. (IRA 45X zones) | Short term (≤2 years) |
| Uncaptured C&I open-access and captive solar in emerging APAC/Africa grids | +1.9% | APAC emerging markets (India state grids), Sub-Saharan Africa | Short-to-medium term (≤3 years) |
Challenges Analysis
Concentrated PV manufacturing
The concentration of over 80–90% of global wafer, cell, and module capacity in a single manufacturing hub, primarily in China’s coastal industrial clusters, creates a structurally fragile supply chain where a 5–10% disruption in local output or logistics can translate into 3–5 month lead-time extensions and 6–12% module price volatility for downstream developers in the EU, US, and India, imposing an estimated 1.4 percentage point drag on otherwise achievable global solar CAGR in 2026–2030.
At the polysilicon, ingot, and wafer stages, utilization rates above 85% and energy-intensive processes (often >60 kWh per kilogram of polysilicon) amplify sensitivity to regional power rationing, environmental inspections, or trade actions, which can temporarily remove 50–80 GW of module equivalent capacity from global availability and push EPC budgets up by 40–60 USD per kW in utility projects.
Shipping distance of 8,000–15,000 km to major import markets adds 20–35 days of transit and 3–5% logistics cost to system CAPEX, while ongoing antidumping, countervailing duty, and local-content initiatives in the US, India, and parts of Latin America force procurement teams to run multi-scenario sourcing plans that raise transaction and compliance costs by an estimated 2–3 USD per kW across portfolios.
Strategically, developers and utilities must accelerate diversification of supply by adding 50–70 GW per year of non‑China cell and module capacity through 2028, negotiate multi-year offtake contracts with tier‑1 manufacturers to cap price variance at <5% per year, and deploy more granular risk models that factor supplier concentration indices, shipment delay probabilities, and tariff exposure into levelized cost of electricity (LCOE) underwriting; this set of adjustments is technically feasible within a 2–4 year horizon but will continue to impose a measurable friction drag on global solar expansion until regional manufacturing ecosystems reach at least 40–50% of annual demand coverage.
Challenges Impact Analysis
| Challenge | (~) % CAGR Friction Drag | Geographic Relevance | Mitigation Horizon |
|---|---|---|---|
| Concentrated PV manufacturing | -1.4% | Global; China-centric, EU, US, India | Medium term (2-4 years) |
| Grid integration & flexibility gap | -1.2% | North America, EU, India, emerging Asia | Long term (≥ 4 years) |
| Skilled workforce & training lag | -1.0% | India, emerging Asia, Africa, LATAM | Medium term (2-4 years) |
| Critical minerals & polysilicon volatility | -0.9% | Global; US, EU, India, resource economies | Medium term (2-4 years) |
| Permitting, land use & social acceptance | -0.8% | EU, US, India, Latin America | Long term (≥ 4 years) |
| Quality, reliability & end-of-life management | -0.7% | Global utility & rooftop markets | Medium term (2-4 years) |
Geopolitical Impact Analysis
War-Driven Energy Security and Supply Chain Fragmentation Reshape Solar Markets
Ongoing conflicts in Ukraine and the Middle East are creating a two-sided impact on the Solar Energy Systems market. Red Sea insecurity has forced vessels onto longer routes around the Cape of Good Hope, increasing delivery times and freight costs for imported modules, inverters, batteries, and electrical equipment. UNCTAD reported that maritime trade growth slowed to 0.5% in 2025, while volatile shipping conditions continued to affect supply chains. Meanwhile, geopolitical restrictions are exposing the sector’s manufacturing concentration. The IEA noted in 2026 that the largest supplier controls more than 70% of manufacturing capacity for many clean-energy components, while 11 of 20 important energy minerals faced export controls during 2025.
However, war-related energy insecurity is also strengthening solar demand. Governments increasingly view domestic solar generation as protection against imported fuel shortages, price shocks, and political pressure. The European Union reduced the share of Russian gas in its total gas imports from 45% in 2021 to 12% in 2025, strengthening its focus on domestic renewable energy and diversified supply. Separately, EU solar capacity reached 359 GW after around 65.1 GW was installed during 2025. Globally, the IEA estimated that new solar PV capacity additions surpassed 600 GW in 2025, representing more than three-quarters of worldwide renewable capacity additions. Consequently, the market is shifting toward local manufacturing, diversified sourcing, battery storage, distributed generation, and long-term procurement agreements.
Regional Analysis
North America Leads While Asia Pacific Records the Fastest Solar Expansion
In 2025, North America held the dominant market position, capturing 52.4% of the Solar Energy Systems Market and generating USD 161.7 billion, based on the market values supplied for this analysis. IRENA’s official capacity table recorded 230,471 MW of installed solar capacity across North America at year-end. The region’s leadership is supported by large utility projects, expanding distributed generation, corporate electricity procurement, battery-linked installations, and established financing channels. The United States remains the region’s main deployment centre, while Canada and Mexico contribute additional growth through utility-scale procurement and commercial installations. Grid interconnection delays remain a constraint over the medium term.
Asia Pacific is the fastest-growing region in the Solar Energy Systems Market, supported by rapid electricity demand, strong manufacturing capabilities, and expanding utility-scale and rooftop installations. Governments across the region are encouraging renewable power through auctions, grid reforms, clean-energy targets, and investment incentives. The presence of major solar equipment producers also improves product availability and lowers project costs. Rising use of battery storage, smart grids, and distributed energy systems is further strengthening market expansion. Continued urbanisation, industrial growth, and the need for reliable low-carbon electricity are expected to keep Asia Pacific at the centre of future solar energy development.
Key Regions and Countries Covered
- North America
- The US
- Canada
- Europe
- Germany
- France
- The UK
- Spain
- Italy
- Russia & CIS
- Rest of Europe
- APAC
- China
- Japan
- South Korea
- India
- ASEAN
- Rest of APAC
- Latin America
- Brazil
- Mexico
- Rest of Latin America
- Middle East & Africa
- GCC
- South Africa
- Rest of MEA
Key Players Analysis
Sungrow Power Supply strengthens the solar energy systems market through inverters, storage platforms, and renewable project development. In 2025, revenue reached CNY 89.18 billion, rising 14.55%, while net profit attributable to shareholders increased 21.97% to CNY 13.46 billion. Photovoltaic inverter and power-conversion equipment generated CNY 31.14 billion, and energy-storage systems produced CNY 37.29 billion. Overseas markets contributed CNY 53.99 billion, representing 60.54% of revenue and showing its expanding international position across utility, commercial, and residential applications in key markets worldwide.
Huawei Technologies supports solar energy systems through smart photovoltaic inverters, energy storage, grid-forming technology, and AI-based plant management. In 2025, its Digital Power business generated CNY 77.31 billion, increasing 12.7% from 2024. Huawei’s total revenue reached CNY 880.94 billion, while research and development spending stood at CNY 192.3 billion, equal to 21.8% of revenue. Its digital power solutions have also supported more than 2 trillion kWh of cumulative green electricity generation across worldwide customer projects and renewable energy markets globally.
SMA Solar Technology remains a major solar systems supplier, focusing on residential, commercial, utility-scale inverters, energy management, and grid-stabilization solutions. In 2025, the company recorded EUR 1.516 billion in sales and sold inverter capacity of 19.9 GW. Its Large Scale and Project Solutions division generated EUR 1.269 billion, while the year-end order backlog reached EUR 1.352 billion. For 2026, SMA expects revenue between EUR 1.475 billion and EUR 1.675 billion, with positive EBITDA supporting business recovery efforts across key markets.
Wuxi Suntech Power has built a broad position in solar modules through crystalline-silicon research, manufacturing, and international distribution. Suntech reports more than 25 years of module experience, cumulative global shipments above 55 GW, over 600 authorized patents, and business coverage across more than 100 countries. Its wider network includes over 5,000 partners and 6 global factories. In June 2026, the company also secured Australian distribution agreements covering over 800 MW of module deployment across three years, strengthening its worldwide reach.
The Major Players in The Industry
- LONGi Green Energy Technology Co., Ltd.
- JinkoSolar Holding Co., Ltd.
- Trina Solar Co., Ltd.
- JA Solar Technology Co., Ltd.
- Tongwei Co., Ltd.
- Canadian Solar Inc.
- First Solar, Inc.
- Hanwha Qcells
- Risen Energy Co., Ltd.
- Sungrow Power Supply Co., Ltd.
- Huawei Technologies Co., Ltd.
- SolarEdge Technologies Inc.
- SMA Solar Technology AG
- Sharp Corporation
- Wuxi Suntech Power Co., Ltd.
- Other Key Players
Key Development
- In June 2025, LONGi Green Energy Technology launched its HIBC technology and a standard-size solar module delivering more than 700 W, 25.9% module efficiency, and power density above 259 W/m², showing its continued focus on higher energy output from limited installation space.
- In March 2025, JinkoSolar Holding Co., Ltd. partnered with Germany-based AIS GmbH to deliver a 66.5 MWh solar-plus-storage project, combining its SunTera energy storage technology with Tiger Neo solar modules.
Report Scope
| Report Features | Description |
|---|---|
| Market Value (2025) | USD 308.6 Bn |
| Forecast Revenue (2035) | USD 1,123.1 Bn |
| CAGR (2026-2035) | 13.8% |
| Base Year for Estimation | 2025 |
| Historic Period | 2020-2024 |
| Forecast Period | 2026-2035 |
| Report Coverage | Revenue Forecast, Market Dynamics, Competitive Landscape, Recent Developments |
| Segments Covered | By technology (Solar Photovoltaic (PV), Concentrated Solar Power (CSP), Solar Thermal), By product (Solar Panels, Charge Controllers, Batteries, Inverters, Others), By system type (Grid-Connected Solar Systems, Off-Grid Solar Systems, Hybrid Solar Systems), By system size (Large-Scale Solar Systems, Small-Scale Solar Systems, Medium-Scale Solar Systems), By installation type (Rooftop Solar Systems, Ground-Mounted Solar Systems, Building-Integrated Solar Systems, Floating Solar Systems), and By end use (Utility, Residential, Commercial, Industrial) |
| Regional Analysis | North America – The US & Canada; Europe – Germany, France, The UK, Spain, Italy, Russia & CIS, Rest of Europe; APAC– China, Japan, South Korea, India, ASEAN & Rest of APAC; Latin America– Brazil, Mexico & Rest of Latin America; Middle East & Africa– GCC, South Africa, & Rest of MEA |
| Competitive Landscape | LONGi Green Energy Technology Co., Ltd., JinkoSolar Holding Co., Ltd., Trina Solar Co., Ltd., JA Solar Technology Co., Ltd., Tongwei Co., Ltd., Canadian Solar Inc., First Solar, Inc., Hanwha Qcells, Risen Energy Co., Ltd., Sungrow Power Supply Co., Ltd., Huawei Technologies Co., Ltd., SolarEdge Technologies Inc., SMA Solar Technology AG, Sharp Corporation, Wuxi Suntech Power Co., Ltd., Other Key Players |
| Customization Scope | Customization for segments, region/country-level will be provided. Moreover, additional customization can be done based on the requirements. |
| Purchase Options | We have three licenses to opt for: Single User License, Multi-User License (Up to 5 Users), Corporate Use License (Unlimited Users and Printable PDF) |





































