


Report Overview
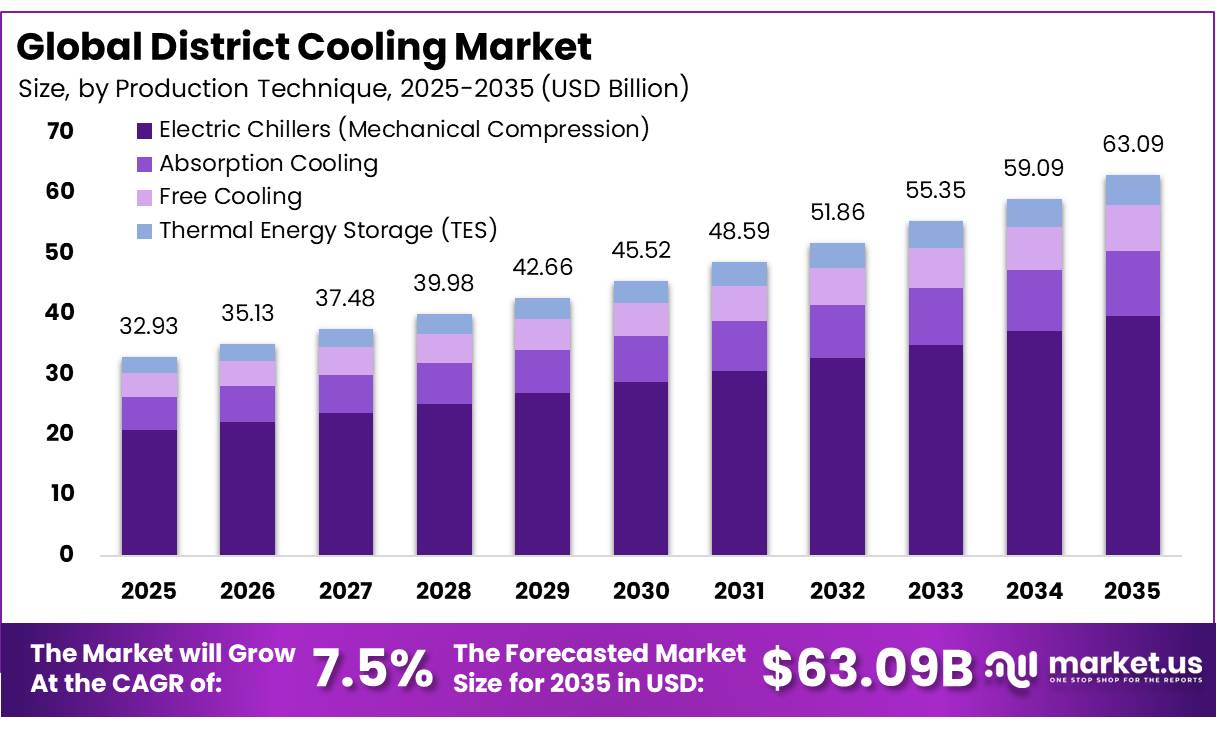
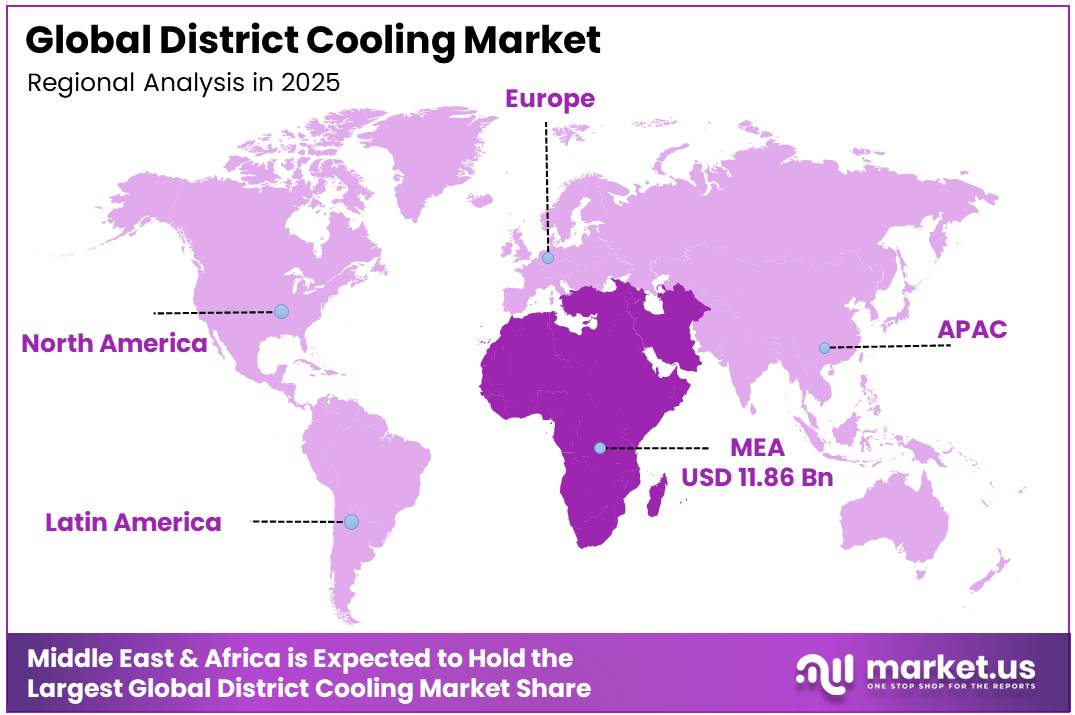
In 2025, the District Cooling Market was valued at USD 32.93 billion, and Between 2026 and 2035, this market is estimated to register a CAGR of 7.5%, reaching about USD 63.09 billion by 2035. In 2025, the Middle East and Africa led the market, achieving over 36.08% share with a revenue of USD 11.88 billion.
District cooling is an energy-efficient urban cooling solution that produces chilled water at a centralized plant and distributes it through insulated underground pipelines to multiple residential, commercial, industrial, and institutional buildings for air conditioning. Compared with conventional building-level cooling systems, district cooling significantly reduces electricity consumption, lowers greenhouse gas emissions, improves equipment efficiency, and minimizes peak power demand.
- According to the International Energy Agency (IEA) Electricity 2025, global electricity demand is forecast to grow by nearly 4% annually through 2027, with rising cooling demand during heatwaves identified as one of the key drivers of electricity consumption, particularly in urban regions.
Key Takeaways
- The Global District Cooling Market was valued at USD 32.93 billion in 2025.
- The market is projected to grow at a CAGR of 7.5% and is estimated to reach USD 63.09 billion by 2035.
- Electric chillers are identified as the dominant production technique, holding a 63.19% share in 2025, underpinned by proven scalability and established supply chains across large-scale commercial developments.
- Fossil fuels remain the dominant energy source, accounting for a 71.26% share, though renewable-powered district cooling plants are identified as the fastest-growing sub-segment across the forecast period.
- Chillers are recognized as the leading component, holding a 34.51% share, serving as the central chilled water production unit within every plant configuration.
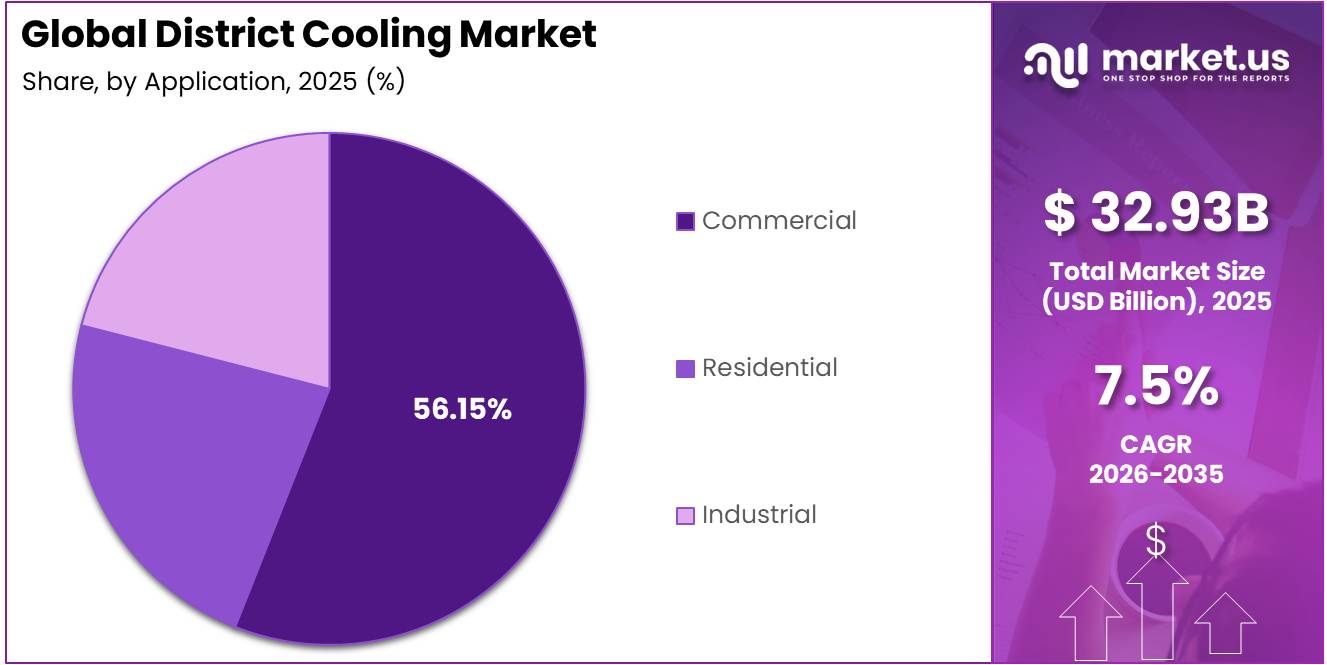
- Commercial applications account for the largest share at 56.15%, driven by urban office, hospitality, retail, and mixed-use developments concentrated across Gulf cities.
- The Middle East and Africa region is confirmed as the dominant market at 36.08% revenue share, supported by extreme climatic conditions, government-mandated cooling frameworks, and an active mega-project development pipeline through 2035.
The technology is increasingly being integrated into smart cities, mixed-use developments, airports, hospitals, universities, and commercial districts as governments and utilities pursue low-carbon urban infrastructure and energy security objectives. The global industrial landscape for district cooling is expanding alongside rising urbanization, increasing cooling demand, and investments in sustainable energy infrastructure.
- According to the IEA Policies Database in 2026, Saudi Arabia’s National Renewable Energy Program aims to generate 50% of its electricity from renewables by 2030, a target that is altering the energy input profile for all newly awarded district cooling concessions in the Kingdom. This initiative is actively transforming the energy infrastructure for new developments in the country.
Space cooling has been identified as the fastest-growing source of energy demand in the global buildings sector, rising approximately 4% annually through 2035, with over 80% of projected cooling electricity demand by 2050 concentrated in emerging economies. Looking ahead, AI-powered load forecasting, predictive chiller management, and smart grid integration are being incorporated into district cooling operations, improving energy efficiency and enabling dynamic participation in grid balancing markets.
District Cooling Market Segmentation
Production Technique Analysis
Electric Chillers (Mechanical Compression) represents dominant Segment in the Market.
Electric Chillers (Mechanical Compression) remain the leading production technique in the district cooling market, accounting for 63.19% of total market share. Their dominance is supported by high energy efficiency, reliable cooling performance, and compatibility with large-scale chilled water networks. Widely deployed centrifugal and screw compressor systems offer strong operational flexibility and proven performance, making them the preferred choice for district cooling operators. Their extensive use across GCC cooling networks further strengthens market adoption.
- Tabreed’s connected capacity of 57 million Refrigeration Tons as of December 2025 is predominantly served through electric chiller-based central plants across the UAE, Saudi Arabia, and Oman. Grid electricity tariff levels, chiller COP ratings, and capital cost of centrifugal compressor units are the primary economic determinants of electric chiller adoption.
Absorption cooling is the fastest growing segment in the district cooling market, driven by the increasing use of waste heat, renewable thermal energy, and combined heat and power (CHP) systems to improve overall energy efficiency. Unlike conventional electric chillers, absorption cooling systems use heat from sources such as industrial waste heat, district heating networks, natural gas, biomass, or solar thermal energy, reducing dependence on electricity during peak cooling periods.
Source Analysis
Fossil Fuels leads the market.
Fossil fuel based electricity sources account for 71.26% of the district cooling market, making them the dominant energy source segment. This leadership is largely attributed to the historical development of district cooling infrastructure in GCC countries, where natural gas-powered electricity generation has supported large-scale cooling operations for decades. Established power networks, long-term utility agreements, and competitive energy pricing continue to support the widespread use of fossil-fuel-derived electricity in district cooling facilities.
- According to the IEA’s World Energy Investment 2025 report, published on 5 June 2025, Saudi Arabia has set a target of 130 GW of renewable capacity by 2030, up from less than 5 GW currently operational, directly reshaping the electricity input profile of new district cooling concessions awarded across the Kingdom.
Renewable energy is emerging as the fastest-growing source segment as governments pursue decarbonization and clean energy targets. Expanding solar PV capacity, supportive energy policies, and increased availability of green financing are encouraging district cooling operators to incorporate renewable power into plant operations. The transition toward low-carbon cooling systems is expected to gain momentum as sustainability goals, ESG commitments, and renewable energy mandates influence future district cooling investments and infrastructure development.
Component Analysis
Chillers Held a Major Share of the district cooling market.
Chillers hold the largest share of the district cooling market, accounting for 34.51% of total revenue. Their strong market position is driven by high cooling capacity, operational reliability, and efficient performance under continuous load conditions. Water-cooled electric chillers are widely used in commercial and mixed-use developments because they offer favorable lifecycle economics and effective thermal management. Their ability to deliver stable cooling output makes them a critical component of modern district cooling networks.
- According to the U.S. Department of Energy’s Federal Energy Management Program guidance, updated in October 2024, a 300-ton water-cooled centrifugal chiller meeting federal full-load efficiency requirements operates at 544 kW per ton.
The free cooling segment is gaining attention as a key future technology trend within district cooling infrastructure. Increasing interest in deep lake water cooling, seawater air conditioning, and seasonal thermal energy storage systems is supporting market expansion. These solutions reduce electricity consumption by utilizing naturally available cooling resources, helping operators improve energy efficiency and sustainability. As smart city projects and climate-focused developments expand, free cooling technologies are expected to secure a larger role in new installations.
Application Analysis
District Cooling Market Are Mostly Utilized in the Commercial Sector.
The commercial sector dominates the district cooling market, accounting for 56.15% of total demand. Large office buildings, airports, hotels, shopping centers, healthcare facilities, and mixed-use developments generate substantial cooling requirements, making commercial applications the primary end-use segment. Rapid urbanization, expanding business districts, and large-scale real estate developments continue to drive demand for centralized cooling infrastructure. High cooling load density and energy efficiency benefits further support commercial sector adoption.
- In March 2026, The district cooling supply agreement between Empower and Meraas for City Walk Phase 3 and Verve Building, delivering over 17,500 RT, highlights the strong role of commercial real estate developments in driving district cooling demand. Large mixed-use projects continue to be primary adoption points due to high cooling loads and dense urban configurations.
Residential district cooling is emerging as a significant growth opportunity, particularly in high-density urban developments and apartment complexes. Growing awareness of energy-efficient cooling solutions, stricter building regulations, and increasing focus on sustainable urban planning are encouraging adoption in the residential sector. However, factors such as metering infrastructure costs, consumer billing mechanisms, and regulatory frameworks continue to influence market penetration.
Key Market Segments
By Production Technique
- Electric Chillers (Mechanical Compression)
- Absorption Cooling
- Free Cooling
- Thermal Energy Storage (TES)
By Source
- Fossil Fuels (Natural Gas, Oil, Coal)
- Renewable Energy
By Component
- Chillers
- Cooling Towers
- Heat Exchangers
- Distribution Pipes & Pumps
- Control Systems
- Others
By Application
- Commercial
- Residential
- Industrial
Driver Analysis
Mandatory Regulatory Frameworks & Building Energy Codes
Government-enacted regulatory mandates constitute the single most structurally transformative driver for the global district cooling market, converting latent demand into contracted, investable load. Abu Dhabi’s Department of Energy operationalized its first comprehensive district cooling regulatory framework under Law No. 11 of 2018 and Regulation No. 45, making Abu Dhabi the first MENA jurisdiction to mandate licensed DC operators, minimum plant capacities of 5,000 tons of refrigeration (17.6 MW), and mandatory feasibility studies for developments exceeding 40,000 m² gross floor area.
In Europe, the revised Energy Performance of Buildings Directive entered into force on 28 May 2024 with a transposition deadline of May 2026, requiring all new EU buildings to achieve zero-emission status by 2030, identifying efficient district heating and cooling as a qualifying renewable-aligned supply source, and mandating the renovation of the 16% worst-performing non-residential buildings by 2030. This regulatory convergence across GCC, EU, and South Asia directly transforms the commercial risk profile of district cooling operators moving from market-pull to regulatory-push demand, enabling multi-decade concession agreements, and supporting project finance on debt-to-equity ratios in the 70:30 range typical for regulated utility infrastructure.
Drivers Impact Analysis
| Driver | (~) % Impact on CAGR | Geographic Relevance | Impact Timeline |
|---|---|---|---|
| Mandatory Regulatory Frameworks & Building Energy Codes | +1.8% | GCC Core (UAE, KSA), EU transposing EPBD 2024, India (BEE/ICAP mandate pipeline) | Medium Term (2–4 years) |
| Surging Urbanization & Peak Cooling Demand Growth | +2.1% | South & Southeast Asia (India, Singapore, Thailand), MENA megaprojects, APAC corridors | Short–Medium Term (1–4 years) |
| Energy Efficiency Imperatives & Grid Decarbonization Targets | +1.5% | North America, EU, UAE, Saudi Arabia, India; Global spillover | Medium Term (2–4 years) |
| Thermal Energy Storage (TES) & Smart Grid Technology Integration | +1.2% | North America core, EU innovation corridors, Singapore, UAE smart districts | Medium–Long Term (3–6 years) |
| Kigali Amendment HFC Phase-Down Regulatory Compliance | +0.9% | Global; Article 5 Group II nations (India, ASEAN) front-loaded; Developed economies (EU, North America) already advanced | Long Term (≥4 years) |
| Public-Private Partnership (PPP) & Cooling-as-a-Service (CaaS) Business Model Innovation | +1.3% | GCC (Saudi Arabia, UAE), India smart cities/SEZs, Singapore, emerging APAC | Medium–Long Term (3–7 years) |
Restraint Analysis
Water-cost and water-stress exposure
Water is a direct operating-cost and resilience variable for water-cooled systems, and the restraint has sharpened because cooling infrastructure is increasingly assessed not only on electricity efficiency but also on water intensity, with U.S. federal guidance for cooling systems and data-center design emphasizing cooling-water efficiency, dry heat rejection where possible, and optimized chilled-water temperatures to control both energy and water use.
This matters commercially because Singapore’s government-announced water-price increase lifted potable water rates from S$2.74 to S$3.24 per cubic metre by 2025, while NEWater used mainly for industrial and air-conditioning cooling rose by 17 cents per cubic metre in two stages, directly pressuring plant OPEX and making water-tariff escalation a nontrivial margin headwind for operators in dense tropical markets; when that pattern is layered onto drought risk and summer heat intensity in Gulf and Indian cities, sponsors face higher lifecycle uncertainty, more expensive make-up water assumptions, and growing incentives to delay or redesign projects toward hybrid or lower-water configurations.
Restraint Impact Analysis
| Restraint | (~) % Impact on CAGR | Geographic Relevance | Impact Timeline |
|---|---|---|---|
| High upfront network CapEx | -1.9% | India urban cores, GCC new districts, SEA metros | Medium term (2-4 years) |
| Tariff and utility regulation gaps | -1.4% | GCC, India, Southeast Asia | Medium term (2-4 years) |
| Water-cost and water-stress exposure | -1.2% | GCC, Singapore, India heat corridors | Short term (≤ 2 years) |
| Building-code retrofitting friction | -1.0% | EU, North America core, India mixed-use stock | Medium term (2-4 years) |
| Power-grid and peak-demand risk | -1.6% | India, Southeast Asia, MENA summer peaks | Short term (≤ 2 years) |
| Heat-resilience redesign burden | -0.9% | North America core, EU south, APAC heat zones | Long term (≥ 4 years) |
Opportunity Analysis
Cooling-as-a-Service
That pivot can expand serviceable demand by unlocking customers constrained by upfront capex, especially in mixed-use and institutional districts where building owners can trade 15% to 25% lower lifecycle cooling cost and 20% to 35% lower in-building HVAC capex for long-duration service contracts, while operators can widen EBITDA margins by roughly 300 to 500 basis points through centralized controls, predictive maintenance, and contract bundling across metering, billing, and uptime SLAs, an approach made more bankable by mature regulatory structures in places like Dubai and Abu Dhabi and benchmark-pricing precedent in Singapore’s mandated zone.
Opportunity Impact Analysis
| Opportunity | (~) % Potential CAGR | Geographic Relevance | Execution Window |
|---|---|---|---|
| Cooling-as-a-Service | +1.8% | GCC core, India metros, SE Asia | Short term (≤ 2 years) |
| Mandated-zone expansion | +2.2% | Singapore, UAE, Hong Kong, India new cities | Medium term (2-4 years) |
| Thermal storage arbitrage | +1.5% | UAE, Singapore, Hong Kong, high-peak APAC | Short term (≤ 2 years) |
| Data center heat-cooling integration | +2.0% | UAE, Singapore, North Asia urban hubs | Medium term (2-4 years) |
| Brownfield campus retrofits | +1.3% | EU, GCC, Hong Kong, India institutional clusters | Medium term (2-4 years) |
| Utility roll-up platforms | +1.7% | GCC, India, SE Asia emerging markets | Long term (≥ 4 years) |
Challenges Analysis
Capex‑heavy PPP complexity
Capex‑heavy PPP complexity manifests as a persistent governance and financing friction in district cooling, where typical greenfield systems require upfront investments of 150–300 million USD per 150–250 MWth of cooling capacity, with asset lives exceeding 30 years and multi‑stakeholder concession structures that can involve three to six public agencies and two to four private consortia per project, driving transaction cycles of 24–36 months instead of the 12–18 months assumed in idealized roll‑out models.
This extended cycle translates operationally into a 10–20% delay in commissioning pipelines relative to planned trajectories, with average financial closure slippage of 6–12 months and cost‑of‑capital spreads that are 80–120 bps higher than sovereign benchmark rates in many emerging markets due to perceived regulatory and offtake risk; as a result, even where demand is strong, the annual capacity addition curve is structurally flattened, pulling down achievable CAGR by an estimated 1.4 percentage points versus a scenario with streamlined, single‑agency concessions and standardized risk‑sharing templates.
Strategically, utilities and city authorities are being forced to institutionalize PPP toolkits standardized performance‑based concession contracts, pooled risk‑guarantee funds of 200–500 million USD at national or city level, and pre‑approved tariff frameworks calibrated to 15–20 year NPV stability while simultaneously building internal PPP units staffed with 15–30 specialists per large city to compress transaction times by 20–30% and mitigate the drag, yet the time required to mature these institutional capabilities and align national procurement rules means this challenge will continue exerting long‑run friction on growth well into the early 2030s.
Challenges Impact Analysis
| Challenge | (~) % CAGR Friction | Geographic Relevance | Mitigation Horizon |
|---|---|---|---|
| Capex-heavy PPP complexity | -1.4% | MENA urban hubs, Asia megacities, EU cores | Long term (≥ 4 years) |
| Grid & thermal integration gaps | -1.2% | EU cores, North America metros, APAC corridors | Medium term (2-4 years) |
| Cooling demand forecasting error | -0.9% | Global heat-stressed cities | Medium term (2-4 years) |
| Skilled district energy talent deficit | -0.8% | Emerging Asia, MENA, Latin America | Long term (≥ 4 years) |
| Construction & permitting lead-time drag | -1.0% | North America metros, EU cores, India GCC | Medium term (2-4 years) |
| Customer connection & tariff alignment | -0.7% | EU cores, GCC hubs, Singapore-style city states | Short term (≤ 2 years) |
Geopolitical Impact Analysis
Regional Conflict and Red Sea Disruptions Are Extending Project Timelines Across the World’s Largest District Cooling Market.
Geopolitical tensions in the Middle East, particularly the Gaza–Israel conflict and related regional spillovers, are affecting infrastructure markets such as district cooling. The Middle East remains the dominant hub for global district cooling capacity and project activity. Red Sea shipping disruptions have forced rerouting of vessels via southern Africa, increasing transit times and raising freight costs for centrifugal chillers, pre-insulated piping, heat exchangers, and electrical switchgear used in cooling infrastructure projects.
These logistics pressures are extending project delivery timelines and increasing contractor mobilisation costs across Gulf construction markets. Labour conditions are tightening, and tender contingencies are rising. According to the IEA Global Energy Review 2026, Middle East electricity demand grew at nearly 4% in 2025 despite geopolitical tensions, reflecting resilient cooling-driven energy consumption. However, financial close timelines are lengthening as lenders price in higher regional risk, while operators like Tabreed and Empower remain better positioned due to strong balance sheets and integrated supply chains.
Regional Analysis
Middle East and Africa Held the Largest Share of the Global District Cooling Market.
In 2025, the Middle East and Africa dominated the global district cooling market, holding about 36.08% of the total market share, due to decades of concentrated infrastructure investment, government policy support, and climatic conditions that make centralised cooling a structural necessity rather than an optional amenity. The UAE hosts the world’s highest concentration of district cooling capacity per capita. Qatar Cool operates the world’s largest single district cooling facility at The Pearl Island.
Cooling is projected to remain the single largest driver of electricity demand growth across MENA through 2035, with cooling and desalination together accounting for close to 40% of the region’s total projected electricity demand increase. Qatar’s KAHRAMAA regulatory framework and Saudi Arabia’s Vision 2030 mega-project pipeline are generating a sustained multi-year development cycle that is expected to maintain this region’s market leadership well beyond the forecast period.
Key Regions and Countries Covered
- North America
- The US
- Canada
- Europe
- Germany
- France
- The UK
- Spain
- Italy
- Russia & CIS
- Rest of Europe
- APAC
- China
- Japan
- South Korea
- India
- ASEAN
- Rest of APAC
- Latin America
- Brazil
- Mexico
- Rest of Latin America
- Middle East & Africa
- GCC
- South Africa
- Rest of MEA
Key Players Analysis
The Global District Cooling Market is consolidated and oligopolistic particularly within the GCC, where a small number of incumbents control the majority of installed capacity across established service territories. Tabreed, Empower, and Qatar Cool collectively dominate district cooling operations across the UAE and Qatar. Tabreed’s connected capacity of 1.57 million Refrigeration Tons across 91 plants in six countries represents the world’s most diversified district cooling portfolio.
At the equipment, piping, and technology layer, the competitive landscape is considerably more fragmented. Danfoss, LOGSTOR, ADC Energy Systems, and Stellar Energy compete across heat exchangers, pre-insulated distribution piping, and plant engineering services a segment in which no single player commands dominant market position and competition operates on a genuinely global basis. Sembcorp Industries operates over 17 GW of installed power capacity across multiple markets and continues expanding district cooling solutions for integrated urban developments, supporting energy-efficient infrastructure and sustainable city planning initiatives.
Fortum Oyj operates approximately 4.3 GW of heat production capacity and supplies district heating and cooling services across Nordic countries, while advancing low-carbon energy systems and improving urban energy efficiency. Enwave Energy Corporation delivers district energy services to more than 700 buildings through approximately 41 km of distribution networks, providing sustainable heating and district cooling solutions across major Canadian metropolitan areas.
The Major Players In The Industry
- National Central Cooling Company PJSC (Tabreed)
- Emirates Central Cooling Systems Corporation (Empower)
- Emirates District Cooling LLC (Emicool)
- ENGIE SA
- Veolia Environnement S.A.
- Dalkia (an EDF Group company)
- Keppel District Cooling / Keppel DHCS Pte Ltd
- Sembcorp Industries Ltd
- Fortum Oyj
- Enwave Energy Corporation
- Qatar District Cooling Company (Qatar Cool)
- LOGSTOR (district energy piping specialist)
- Danfoss A/S (district energy solutions)
- ADC Energy Systems LLC
- Stellar Energy
- Other Players
Key Development
- In May 2026, Tabreed reported Q1 2026 revenue of AED 486 million and connected capacity of 57 million Refrigeration Tons up 18% year-on-year confirming continued organic and acquisition-led expansion across the UAE, Saudi Arabia, Oman, Egypt, and India, with Palm Jebel Ali and PAL Cooling integration progressing on schedule.
- March 2026, Empower signed a district cooling supply agreement with Meraas, a subsidiary of Dubai Holding, to deliver over 17,500 Refrigeration Tons to City Walk Phase 3 and Verve Building in Dubai, expanding its commercial real estate cooling portfolio in line with Dubai’s urban growth trajectory.
Report Scope
| Report Features | Description |
|---|---|
| Market Value (2025) | USD 32.93 Bn |
| Forecast Revenue (2035) | USD 63.09 Bn |
| CAGR (2026-2035) | 7.5% |
| Base Year for Estimation | 2025 |
| Historic Period | 2020-2024 |
| Forecast Period | 2026-2035 |
| Report Coverage | Revenue Forecast, Market Dynamics, Competitive Landscape, Recent Developments |
| Segments Covered | By Production Technique (Electric Chillers, Absorption Cooling, Free Cooling, and Thermal Energy Storage), By Source (Fossil Fuels, Renewable Energy), By Component (Chillers, Cooling Towers, Heat Exchangers, Distribution Pipes & Pumps, Control Systems, and Others), By Application (Commercial, Residential, and Industrial) |
| Regional Analysis | North America – The US & Canada; Europe – Germany, France, The UK, Spain, Italy, Russia & CIS, Rest of Europe; APAC– China, Japan, South Korea, India, ASEAN & Rest of APAC; Latin America– Brazil, Mexico & Rest of Latin America; Middle East & Africa– GCC, South Africa, & Rest of MEA |
| Competitive Landscape | National Central Cooling Company PJSC (Tabreed), Emirates Central Cooling Systems Corporation (Empower), Emirates District Cooling LLC (Emicool), ENGIE SA, Veolia Environnement S.A., Dalkia (an EDF Group company), Keppel District Cooling / Keppel DHCS Pte Ltd, Sembcorp Industries Ltd, Fortum Oyj, Enwave Energy Corporation, Qatar District Cooling Company (Qatar Cool), LOGSTOR (district energy piping specialist), Danfoss A/S (district energy solutions), ADC Energy Systems LLC, Stellar Energy, and Other Players |
| Customization Scope | Customization for segments, region/country-level will be provided. Moreover, additional customization can be done based on the requirements. |
| Purchase Options | We have three licenses to opt for: Single User License, Multi-User License (Up to 5 Users), Corporate Use License (Unlimited Users and Printable PDF) |





































