


Report Overview
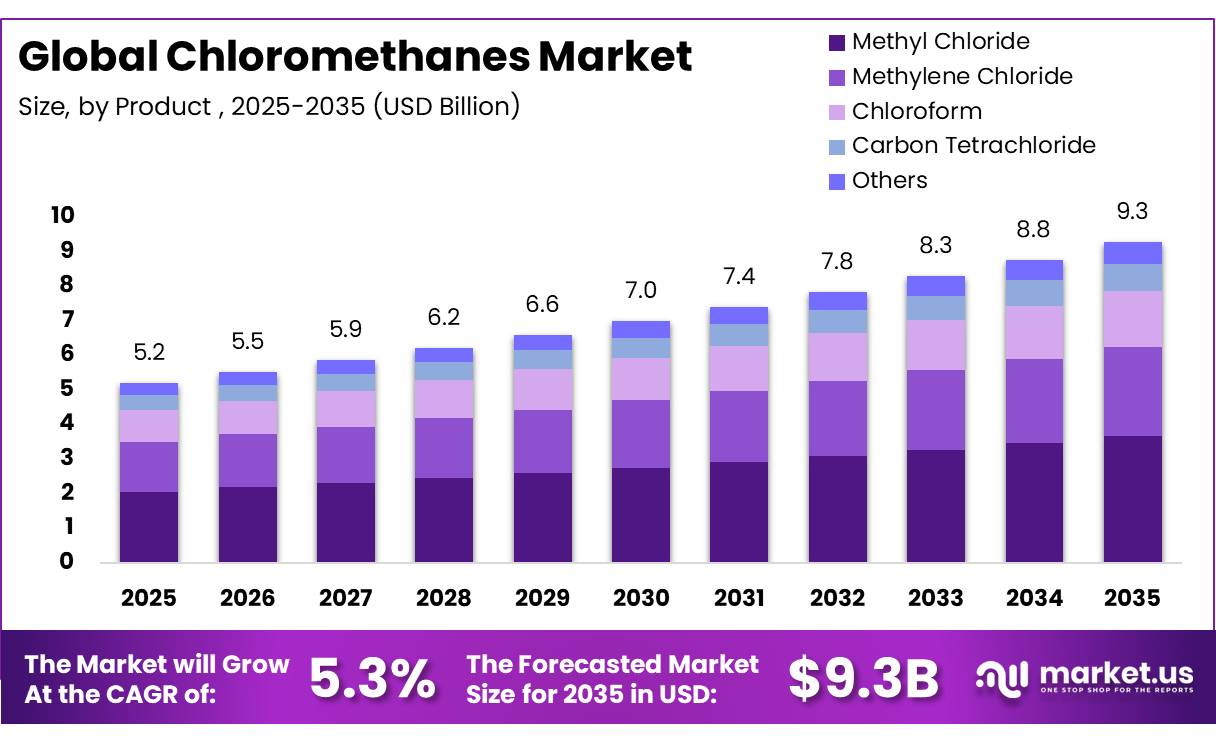
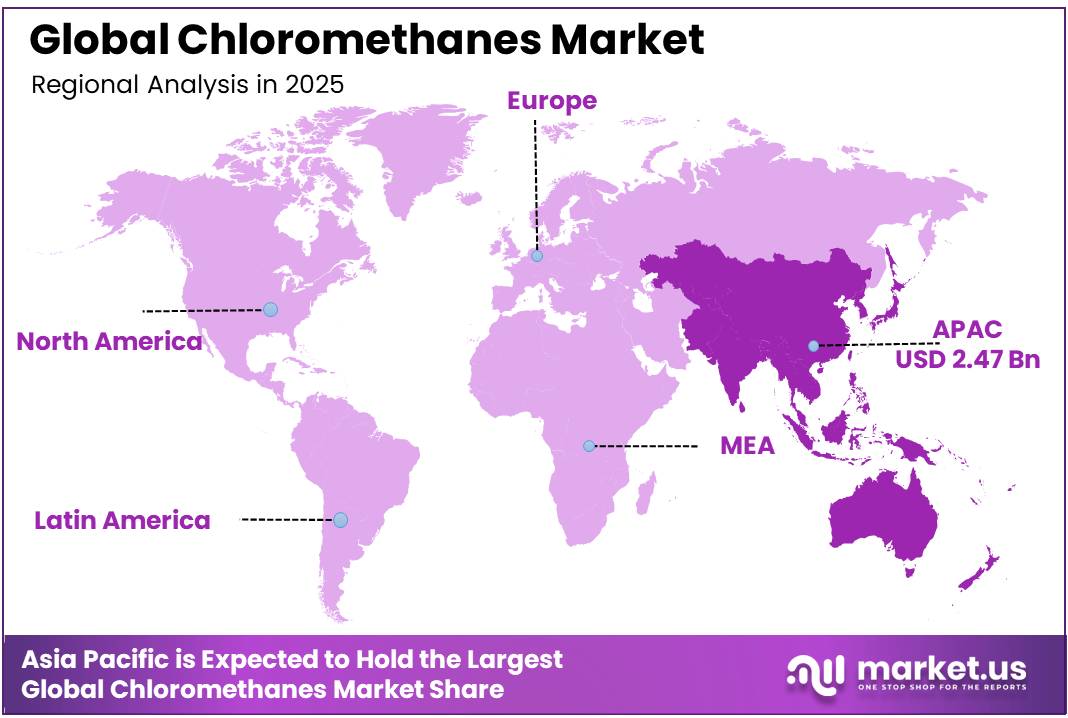
In 2025, the Global Chloromethanes Market was valued at USD 5.2 billion, and between 2026 and 2035, this market is estimated to register a CAGR of 5.3%, reaching about USD 9.3 billion by 2035. Asia Pacific held a dominant market position, capturing more than a 47.50% share, holding USD 2.47 billion in revenue.
Chloromethanes comprise methyl chloride, methylene chloride, chloroform, and carbon tetrachloride, forming an integrated group of chlorinated intermediates used across solvents, pharmaceuticals, refrigerant production, silicone manufacturing, adhesives, coatings, and chemical processing. Their industrial position depends on access to chlorine, methane, energy, and tightly controlled production infrastructure.
- Euro Chlor reported that European chlorine output reached 7,787,394 tonnes in 2025, down 1% from 2024, indicating a softer feedstock environment but continued large-scale operating capacity.
- In the United States, EPA Chemical Data Reporting places annual methylene chloride production within a 100–500 million pound range, confirming its substantial industrial relevance.
Key Takeaways
- The global chloromethanes market was valued at USD 5.2 billion in 2025.
- The global market is projected to grow at a CAGR of 5.3% and is estimated to reach USD 9.3 billion by 2035.
- On the basis of product type, Methyl Chloride dominated the market, constituting 39.4% of the total market share.
- Based on application, Silicone Polymers dominated the chloromethanes market, with a substantial market share of around 47.90%.
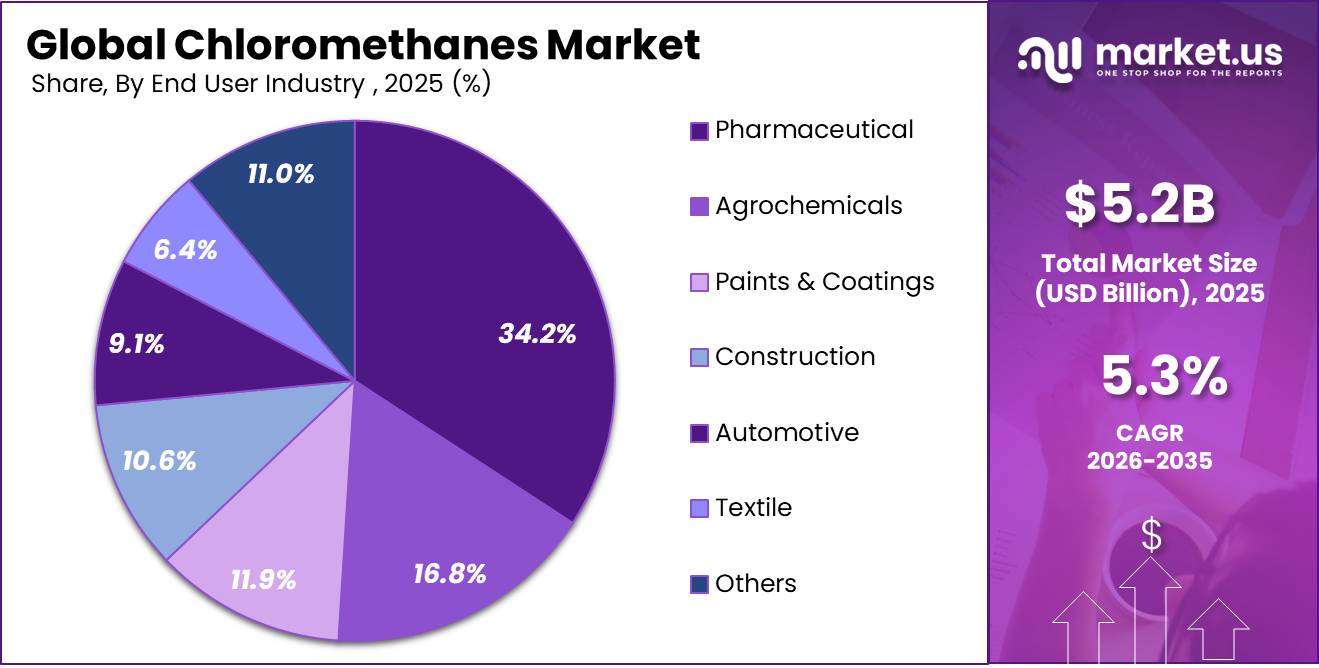
- Among the end-user industries, the Pharmaceutical sector held a major share in the chloromethanes market, accounting for 34.2% of the market share.
- In 2025, Asia Pacific was the most dominant region in the chloromethanes market, accounting for 47.50% of the total global market.
Demand remains strongest where chloromethanes perform as reaction intermediates or high-efficiency processing agents. Methyl chloride supports silicone production, while methylene chloride is used in metal cleaning, vapor degreasing, refrigerant chemicals, sealants, and adhesive removers. However, regulatory pressure is materially changing product use patterns.
- EPA’s April 2024 rule prohibited all consumer uses and most industrial and commercial uses of methylene chloride, while permitting selected applications under workplace protection requirements. In November 2025, EPA extended compliance dates for non-federal laboratories by 18 months. These controls are encouraging closed-system handling, solvent recovery, emission reduction, worker monitoring, and substitution in lower-value applications.
Future opportunities are expected to concentrate in controlled industrial uses, specialty pharmaceutical processing, electronics, refrigerant intermediates, and silicone-based products. World Semiconductor Trade Statistics reported global semiconductor sales of USD 795.6 billion in 2025, rising 26.2% year over year, supporting demand for high-purity silicone materials and associated methyl chloride consumption.
Growth prospects will therefore depend less on unrestricted solvent use and more on high-purity grades, efficient chlorination technologies, recycling systems, and integrated supply agreements. Producers capable of meeting stricter exposure, traceability, and environmental standards are likely to secure stronger positions in regulated, technology-intensive applications.
Product Analysis
Methyl Chloride dominates with 39.4% due to its wide use in silicone polymer production and chemical processing.
In 2025, Methyl Chloride held a dominant market position, capturing more than a 39.4% share in the chloromethanes market by product. In the June 2025 market view, its lead was supported by strong consumption in silicone polymers, where it acts as an important intermediate for methyl chlorosilanes. Its demand also remained steady across chemical synthesis and downstream industrial uses, making it the preferred product in this category.
Methylene Chloride emerged as the growing segment. Its growth was supported by its continued use as an industrial solvent, especially in applications requiring strong solvency and fast evaporation. The segment also gained attention from end-use industries that need efficient cleaning, extraction, and processing solutions.
Application Analysis
Silicone Polymers dominate with 47.90% due to strong use in downstream chemical and industrial applications.
In 2025, Silicone Polymers held a dominant market position, capturing more than a 47.90% share in the chloromethanes market by application. In the June 2025 market view, this segment led due to the wide use of chloromethanes as a key input in silicone-based products. Demand remained strong from industries using silicone polymers for sealants, coatings, construction materials, automotive parts, and specialty chemical formulations. Its stable performance was also supported by regular industrial consumption, where silicone materials are valued for durability, flexibility, and heat resistance.
Industrial Solvent emerged to be as the growing segment. Its growth was supported by steady use in cleaning, extraction, processing, and formulation activities across different industries.
End User Industry Analysis
Pharmaceutical dominates with 34.2% due to steady demand for solvents and chemical intermediates.
In 2025, Pharmaceutical held a dominant market position, capturing more than a 34.2% share in the chloromethanes market by end user industry. In the June 2025 market view, this segment led due to the regular use of chloromethanes in drug formulation, chemical synthesis, and processing activities. Its strong position was supported by the pharmaceutical industry’s need for reliable chemical inputs that help in controlled production and specialty applications.
Agrochemicals emerged as the growing segment. Its growth was supported by the use of chloromethanes in crop protection chemicals and related formulations, where efficient chemical processing remains important.
Key Market Segments
By Product
- Methyl Chloride
- Methylene Chloride
- Chloroform
- Carbon Tetrachloride
- Others
By Application
- Silicone Polymers
- Industrial Solvent
- Refrigerant
- Laboratory Chemicals
- Adhesives and Sealants
- Herbicide
- Others
- Industrial Gas Adsorption
- Local Anesthetic
By End User Industry
- Pharmaceutical
- Agrochemicals
- Paints & Coatings
- Construction
- Automotive
- Textile
- Others
Driver Analysis
Methanol-chlorine cost relief from lower energy pressure
In the U.S., Henry Hub spot gas was around $2.88 per MMBtu on July 14, 2026, while the EIA outlook cited in late 2025 pointed to full-year averages of $3.56 per MMBtu for 2025 and $4.01 per MMBtu for 2026, levels that are materially below the crisis-era peaks seen in earlier years and far more supportive for chlor-alkali, methanol, and derivative operations than the 2022 energy shock environment; this lowers variable-cost stress across integrated producers, especially in North America, and can widen export arbitrage into higher-cost importing regions.
The resulting forecast uplift of about +0.8 percentage points is justified not by headline demand alone but by improved unit economics: lower fuel and utility costs reduce cash-cost floors, help preserve plant run rates, and make merchant chloromethane pricing more competitive for silicone and chemical-processing customers.
Drivers Impact Analysis
| Driver | (~) % Impact on CAGR Forecast | Geographic Relevance | Impact Timeline |
|---|---|---|---|
| Silicone chain pull via methyl chloride intermediates | +1.4% | APAC core, North America core, EU specialty | Medium term (2-4 years) |
| Refrigerant transition support from HFC-32 exempt uses | +0.9% | North America core, APAC HVAC corridors | Short term (≤ 2 years) |
| Methanol-chlorine cost relief from lower energy pressure | +0.8% | North America core, China-linked export corridors, EU spill-over | Short term (≤ 2 years) |
| Methylene chloride regulation reshaping product mix | +0.6% | North America core, selective global compliance spill-over | Short term (≤ 2 years) |
| Industrial output normalization lifting solvent and process demand | +0.7% | EU, North America, APAC manufacturing belts | Medium term (2-4 years) |
| Soda ash and caustic integration improving chlor-alkali optionality | +0.5% | China core, Turkey-US feedstock linkages, global merchant trade | Long term (≥ 4 years) |
Restraint Analysis
Workplace exposure tightening
Even where chloromethanes remain legal, tightening occupational controls raise the delivered cost-to-serve because chloromethane and related chlorinated solvents carry strict handling requirements: OSHA lists methyl chloride with a 100 ppm 8-hour PEL, a 200 ppm ceiling, and a 300 ppm peak limit for 5 minutes in any 3 hours, while EPA’s methylene chloride rule imposes a far lower 8-hour exposure limit of 2 ppm and 15-minute STEL of 16 ppm for covered uses, plus monitoring, regulated areas, downstream notification, and recordkeeping; the operational consequence is that producers and toll users must fund additional air monitoring, closed-transfer upgrades, ventilation retrofits, respirator programs, and compliance labor, with even mid-sized sites facing six-figure annual recurring EHS overhead and CapEx retrofits that can delay debottlenecking or line restarts by two to four quarters, which is why the restraint is best modeled as a 0.9 percentage-point CAGR deduction centered on North America and multinational customers exporting into jurisdictions that benchmark to similarly conservative exposure governance.
Restraint Impact Analysis
| Restraint | (~) % Impact on CAGR Forecast | Geographic Relevance | Impact Timeline |
|---|---|---|---|
| Methylene chloride bans | -1.4% epa+1 | North America core, EU epa+1 | Short term (≤ 2 years) epa |
| Workplace exposure tightening | -0.9% epa | North America core, EU, Japan/Korea import users epa | Short term (≤ 2 years) epa |
| Hazardous-gas logistics friction | -0.8% osha | APAC corridors, North America, EU osha | Medium term (2-4 years) |
| Trade and tariff uncertainty | -0.7% census+1 | North America core, China-linked routes, EU export chains census+1 | Short term (≤ 2 years) |
| Feedstock cost volatility | -0.6% bea+1 | EU, North America, Northeast Asia bea+1 | Medium term (2-4 years) |
| Legacy toxicity perception | -0.5% epa+1 | EU, North America core epa+1 | Long term (≥ 4 years) |
Opportunity Analysis
Import-substitution capacity
This is not a baseline driver because current trade flows merely show existing demand; the real upside emerges when regional producers deploy new or debottlenecked chloromethane assets specifically to displace imports in structurally exposed markets, thereby capturing logistics margin, tariff shelter, and faster delivery economics that the baseline forecast does not assume.
Official 2024 trade data show sizable methylene chloride import concentrations in countries such as Turkey and Brazil, while India’s Directorate General of Trade Remedies has continued formal scrutiny of import competition in methylene chloride, indicating a policy environment conducive to local replacement strategies; under a localization model, producers can typically shorten lead times by 20 to 35 days, trim delivered cost by 6% to 10%, improve asset utilization by 8% to 12%, and unlock regional TAM expansion of roughly 1.2 to 1.5 times current served demand by adding just-in-time contracts and smaller lot sizes previously uneconomic under import dependence.
Opportunity Impact Analysis
| Opportunity | (~) % Potential CAGR Upside | Geographic Relevance | Execution Window |
|---|---|---|---|
| Pharma-grade solvent pivot | +1.4% | India, EU, North America | Short term (≤ 2 years) |
| Import-substitution capacity | +1.8% | India, Brazil, Turkey, LATAM | Medium term (2-4 years) |
| Electronics cleaning reformulation | +1.1% | East Asia, EU, U.S. specialty uses | Medium term (2-4 years) |
| Tolling and compliance services | +0.9% | U.S., EU, Japan | Short term (≤ 2 years) |
| Silicone chain integration | +1.6% | China, India, Southeast Asia | Medium term (2-4 years) |
| Distressed-asset M&A roll-up | +2.0% | North America, EU, India | Long term (≥ 4 years) |
Challenges Analysis
Chlorine chain energy volatility
A major chloromethane challenge in 2026 is the energy sensitivity of the upstream chlor-alkali chain, because chlorine availability and pricing remain indirectly tied to electricity economics rather than purely to end-market demand, and Eurostat reported average EU non-household electricity prices at €18.37 per 100 kWh in the second half of 2025, still well above pre-crisis norms despite a 3.5% half-on-half decline.
Since chlor-alkali units are electricity-intensive and chlorine co-product balancing determines utilization rates, even moderate power-price swings can compress operating windows, distort caustic-chlorine economics, and trigger short-run output optimization that leaves chloromethane producers facing irregular chlorine sourcing, wider contract-index resets, and higher inventory buffers; operationally, that can mean 5% to 12% quarterly variance in chlorine-linked input costs, 2 to 5 percentage-point swings in plant operating rates during stressed utility periods, and 10 to 20 days of extra feedstock coverage requirements for risk-managed procurement.
The challenge therefore acts as an estimated -1.0 percentage-point drag on growth potential, and mitigation requires multi-year power hedging, co-location near stable electrochemical clusters, deeper tolling arrangements with chlor-alkali producers, and more dynamic product-mix planning to preserve margins through electricity-cycle volatility rather than assuming smooth upstream availability.
Challenges Impact Analysis
| Challenge | (~) % CAGR Friction Drag | Geographic Relevance | Mitigation Horizon |
|---|---|---|---|
| Exposure compliance retrofits | -1.2% | North America core, EU regulatory hubs | Medium term (2-4 years) |
| Chlorine chain energy volatility | -1.0% | EU regulatory hubs, APAC manufacturing belts | Medium term (2-4 years) |
| Methanol feedstock spread instability | -0.8% | North America core, Middle East export nodes, APAC import hubs | Short term (≤ 2 years) |
| Hazard-operations talent thinning | -0.7% | North America core, EU regulatory hubs, developed APAC | Long term (≥ 4 years) |
| Cross-border logistics elongation | -0.6% | APAC logistics corridors, North America trade lanes, India-linked routes | Short term (≤ 2 years) |
| Monitoring and data burden | -0.5% | North America core, EU regulatory hubs | Medium term (2-4 years) |
Geopolitical Impact Analysis
Geopolitical Realignment and Supply Chain Fragmentation Reshaping Chloromethanes Manufacturing.
Current geopolitical tensions are reshaping the chloromethanes market through feedstock security, energy-price pressure, trade barriers, and stricter compliance across global manufacturing networks. Chloromethanes production depends on availability of chlorine, methanol, and chlor-alkali operations, making producers sensitive to cost differences and disrupted chemical trade flows. In 2025, Cefic reported that EU27 chemical capacity utilisation stood at 74% in the first quarter, while European gas prices remained 3.3 times higher than in the United States, weakening regional competitiveness for energy-linked chemical production.
Trade disruptions have increased uncertainty for chlorinated solvent and intermediate supply chains. Cefic noted that EU27 chemical export values to the United States declined after March 2025, while the EU27 chemical trade surplus in 2025 stood €7.3 billion below the 2024 level. This pressure is relevant for chloromethanes because downstream demand is tied to silicone polymers, pharmaceuticals, agrochemicals, coatings, and industrial solvents.
In parallel, regulatory actions are reshaping regional demand and operating models. The U.S. EPA finalized a 2024 rule prohibiting most industrial, commercial, and consumer uses of methylene chloride, while REACH registration rules continue to affect chlorinated solvents placed on the EU market. These developments are pushing producers toward tighter compliance, localized supply planning, and feedstock flexibility. However, higher energy costs, trade uncertainty, and solvent-use restrictions continue to expose chloromethanes manufacturers to cost volatility, approval delays, and uneven regional demand recovery.
Regional Analysis
Asia Pacific dominates with 47.50% due to strong chemical manufacturing and downstream industrial demand.
In 2025, Asia Pacific held a dominant position in the chloromethanes market, capturing more than a 47.50% share, valued at around USD 2.47 billion. The region’s lead was supported by strong demand from pharmaceuticals, agrochemicals, silicone polymers, industrial solvents, construction, automotive, and textile applications. Chloromethanes remained widely used across regional chemical processing because they serve as important intermediates and solvents in several downstream industries.
Asia Pacific also benefited from a broad manufacturing base, steady industrial output, and growing consumption from end-use sectors that require cost-effective and reliable chemical inputs. In the June 2025 market view, the region continued to remain ahead due to its strong production ecosystem and expanding downstream chemical usage.
Key Regions and Countries Covered
- North America
- The US
- Canada
- Europe
- Germany
- France
- The UK
- Spain
- Italy
- Russia & CIS
- Rest of Europe
- APAC
- China
- Japan
- South Korea
- India
- ASEAN
- Rest of APAC
- Latin America
- Brazil
- Mexico
- Rest of Latin America
- Middle East & Africa
- GCC
- South Africa
- Rest of MEA
Key Players Analysis
Chloromethanes producers focus on strengthening product consistency, cost efficiency, and supply reliability to maintain competitiveness. A key priority is stable production across major product types such as methyl chloride, methylene chloride, chloroform, and carbon tetrachloride, as these chemicals support silicone polymers, industrial solvents, refrigerants, laboratory chemicals, adhesives, sealants, herbicides, and other industrial applications. Producers also work on improving process efficiency, purity control, and safe handling standards to meet demand from regulated and performance-driven end-use sectors.
Strategic market positioning is supported by strong feedstock access, integrated chlor-alkali operations, and steady links with downstream industries. Manufacturers emphasize long-term supply arrangements, regional production strength, and operational flexibility to manage raw material price movement and compliance pressure. In high-demand regions, especially Asia Pacific, producers continue to align production with pharmaceutical, agrochemical, paints and coatings, construction, automotive, textile, and cosmetic industry requirements, helping them strengthen market share across value-added application segments.
Market Key Players
- Dow Chemical
- AkzoNobel N.V.
- Occidental Chemical Corporation
- Ineos
- Solvay S.A.
- Kem One
- Shin-Etsu Chemical C. Ltd.
- Gujarat Alkalies & Chemicals Ltd.
- Tokuyama Corporation
- AGC Chemicals Ltd.
Key Development
- In September 2025, INEOS Inovyn announced the mothballing of its chloromethane production facility in Tavaux, France, due to weak market demand, regulatory challenges, and higher operating and energy costs. The company stated that it would optimize chloromethane production at its Rosignano site in Italy to reduce customer impact.
- In February 2026, Shin-Etsu Chemical’s new silicone products plant in Zhejiang Province, China, was scheduled for completion. The project includes a 40,000 m² site, with 20,000 m² reserved for future expansion, and an expected investment of around ¥2.1 billion.
Report Scope
| Report Features | Description |
|---|---|
| Market Value (2025) | USD 5.2 Bn |
| Forecast Revenue (2035) | USD 9.3 Bn |
| CAGR (2026-2035) | 5.3% |
| Base Year for Estimation | 2025 |
| Historic Period | 2020-2024 |
| Forecast Period | 2026-2035 |
| Report Coverage | Revenue Forecast, Market Dynamics, Competitive Landscape, Recent Developments |
| Segments Covered | By Product (Methylene Chloride, Methyl Chloride, Carbon Tetrachloride, Chloroform, and Others), By Application (Refrigerant, Industrial Solvent, Silicone Polymers, Laboratory Chemicals, Industrial Gas Adsorption, Herbicide, Local Anesthetic, Adhesives and Sealants, and Others), By End User Industry (Pharmaceutical, Agrochemicals, Textile, Automotive, Construction, Paints & Coatings, Cosmetic Industry, and Others) |
| Regional Analysis | North America – The US & Canada; Europe – Germany, France, The UK, Spain, Italy, Russia & CIS, Rest of Europe; APAC– China, Japan, South Korea, India, ASEAN & Rest of APAC; Latin America– Brazil, Mexico & Rest of Latin America; Middle East & Africa– GCC, South Africa, & Rest of MEA |
| Competitive Landscape | Dow Chemical, AkzoNobel N.V., Occidental Chemical Corporation, Ineos, Solvay S.A., Kem One, Shin-Etsu Chemical C. Ltd., Gujarat Alkalies & Chemicals Ltd., Tokuyama Corporation, and AGC Chemicals Ltd. |
| Customization Scope | Customization for segments, region/country-level will be provided. Moreover, additional customization can be done based on the requirements. |
| Purchase Options | We have three licenses to opt for: Single User License, Multi-User License (Up to 5 Users), Corporate Use License (Unlimited Users and Printable PDF) |





































