


Report Overview
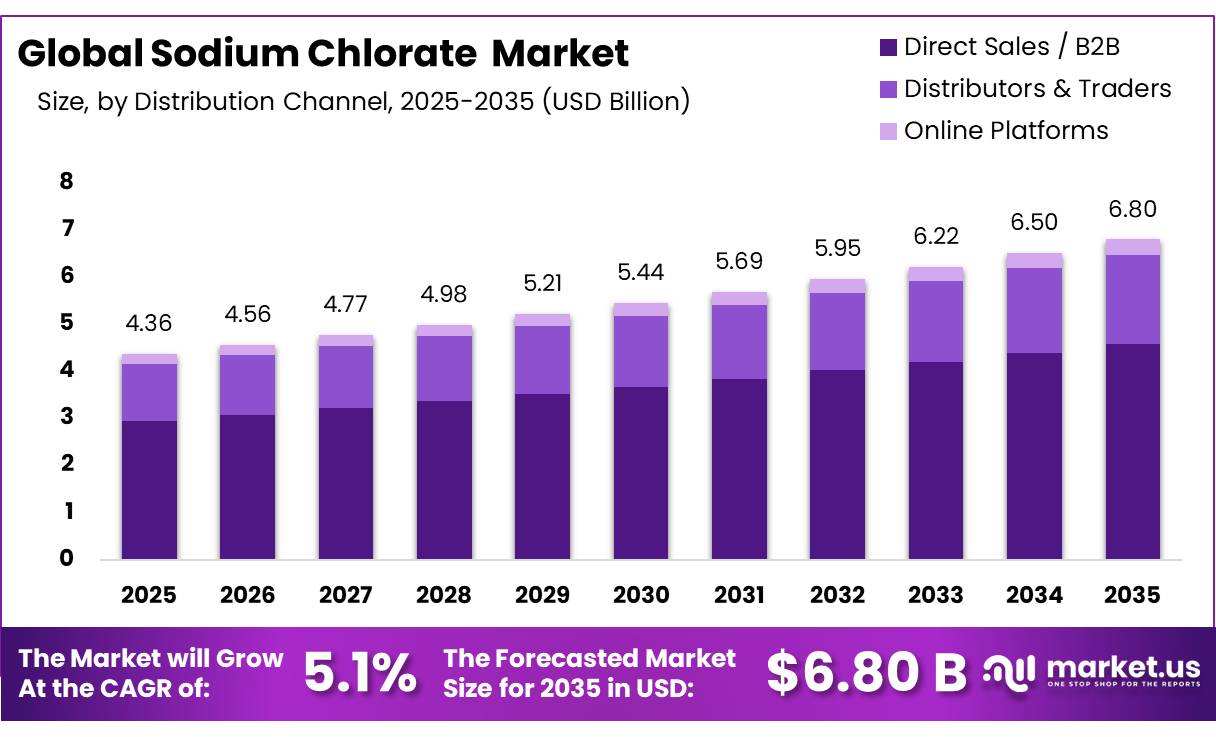
In 2025, the Global Sodium Chlorate Market was valued at USD 4.36 billion, and between 2026 and 2035, this market is estimated to register a CAGR of 5.1%, reaching about USD 6.80 billion by 2035. Asia-Pacific held a dominant market position, capturing more than a 39.2% share and holding USD 1.71 billion in revenue.
The global sodium chlorate market is the commercial industry built around the production, distribution, and application of sodium chlorate, a white crystalline inorganic compound with the chemical formula NaClO₃, across a wide and commercially important range of industrial processes.
- In March 2023, according to the U.S. Environmental Protection Agency, five manufacturing facilities reported sodium chlorate production in the United States, with plants located in four states: Georgia, South Carolina, Utah, and Washington. The EPA also reported that U.S. customers represented roughly 75% of North American sodium chlorate sales, while approximately 70% of North American production capacity was located in Canada, indicating a highly concentrated and cross-border supply structure.
Key Takeaways
- The Global Sodium Chlorate Market was valued at US$ 4.36 billion in 2025.
- The market is projected to grow at a CAGR of 5.1% and is estimated to reach US$ 6.80 billion by 2035.
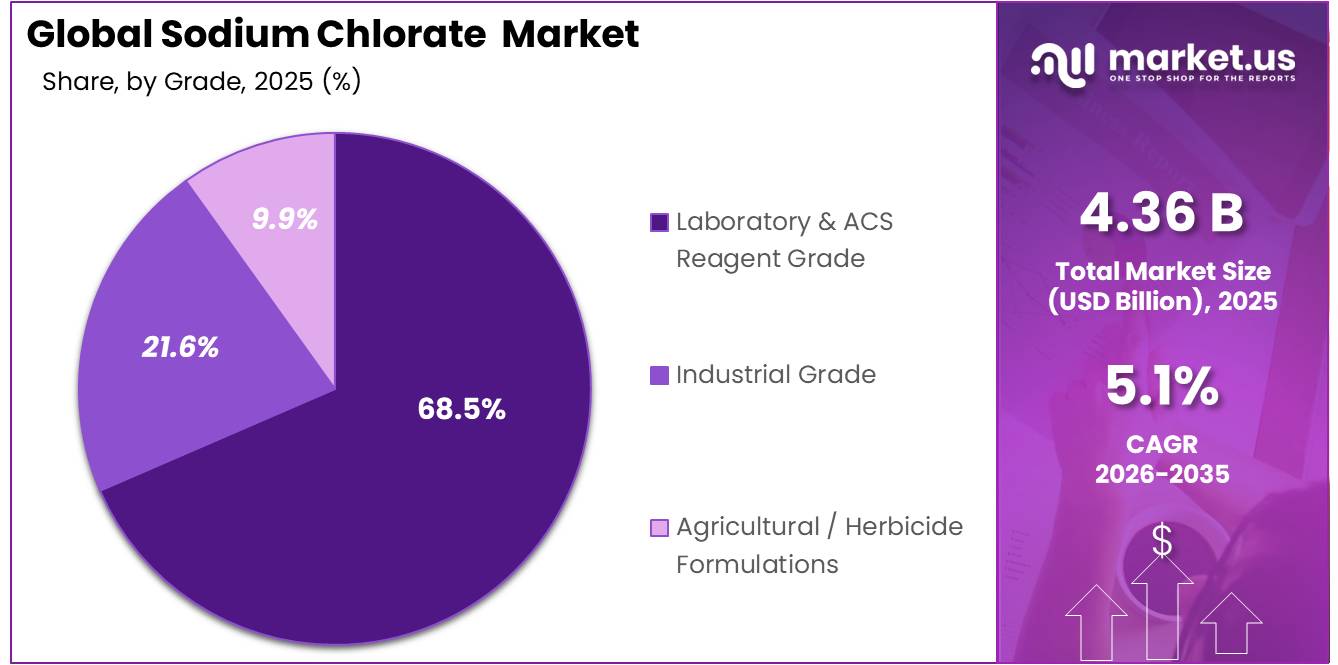
- On the basis of grade, laboratory and ACS reagent grade dominated the market, constituting 68.5% of the total market share.
- Based on purity, NaClO₃ purity above 99.5% dominated the sodium chlorate market, with a substantial market share of around 54.6%.
- Based on form, crystalline dominated the sodium chlorate market, with a substantial market share of around 63.4%.
- Based on end-use industry, pulp and paper held a major share, accounting for 62.1% of the market share.
- Based on distribution channel, direct sales/B2B led the market, comprising 67.5% of the total market.
- In 2025, Asia-Pacific was the most dominant region in the sodium chlorate market, accounting for 39.2% of the total global consumption.
Produced primarily through the electrolysis of sodium chloride solution, sodium chlorate is most widely recognized as the key raw material in generating chlorine dioxide, the bleaching agent that the global pulp and paper industry depends on to produce the bright, clean, and high-quality paper products that billions of consumers and businesses use every single day.
- In February 2026, according to the U.S. Geological Survey, the United States produced an estimated 40 million metric tons of salt in 2025, while producers sold or used about 39 million metric tons, valued at approximately USD 2.6 billion. The chemical industry accounted for nearly 42% of total salt sales, and salt in brine represented around 90% of the salt used as chemical feedstock. This supports sodium chlorate production because the compound is manufactured through the electrolysis of sodium chloride brine.
Beyond its dominant role in paper bleaching, sodium chlorate serves as a powerful oxidizing agent in chemical manufacturing, water treatment, mining and metal processing, and agriculture, where it functions as a non-selective herbicide. The market spans laboratory and industrial-grade applications through to high-purity reagent formulations, with crystalline form commanding the largest commercial share due to its stability, ease of handling, and suitability for long-distance transportation across global supply chains.
- According to the U.S. EPA, producing chlorine dioxide through sodium chlorate-based manufacturing requires approximately 11 kilowatt-hours of electricity per kilogram, compared with around 5 kWh/kg for an equivalent bleaching quantity of chlorine and 1 kWh/kg for oxygen. This high electricity requirement explains why power availability and industrial electricity prices strongly influence sodium chlorate production costs and plant competitiveness.
Grade Analysis
Laboratory and ACS Reagent Grade Represents the Dominant Segment in the Market.
Laboratory and ACS reagent grades represent a key segment within the sodium chlorate market, accounting for a 68.5% market share, supported by applications that require high chemical purity and consistent performance. This grade is widely used in analytical laboratories, research activities, quality testing, and precision chemical synthesis, where small impurities can affect reaction accuracy and safety. The expanding research base supports the consumption of high-purity laboratory chemicals and analytical reagents used in controlled experiments and material testing.
- In December 2025, according to Eurostat, research and development expenditure across the European Union reached an estimated EUR 403.1 billion in 2024, rising by 3.6% from EUR 389.2 billion in 2023.
Agricultural/herbicide formulation grade is fastest growing segment, serves the crop protection sector where sodium chlorate’s non-selective oxidising action makes it an effective and low-cost tool for pre-harvest desiccation of cotton, flax, and other crops, and for weed control in non-crop areas including railways, roads, and industrial sites.
Purity Analysis
NaClO₃ Purity Above 99% Represents the Dominant Segment in the Market.
Sodium chlorate with purity above 99% accounts for 54.6% of the market the dominant purity tier because the most commercially significant and highest-volume applications of sodium chlorate require the highest possible oxidising agent purity to function reliably and safely at scale. In chlorine dioxide generation for pulp bleaching by far the largest single application of sodium chlorate globally the efficiency of the chlorate-to-chlorine-dioxide conversion reaction is directly dependent on the purity of the sodium chlorate feed.
Lower-purity material introduces impurities into the generator that can reduce conversion efficiency, create unwanted by-products, and require more frequent system maintenance costs that large-scale pulp mills are acutely motivated to avoid. In water treatment applications, high-purity sodium chlorate ensures that the chlorine dioxide generated for drinking water disinfection meets the strict safety specifications that food-contact and drinking water applications require without introducing trace contaminants that would fail regulatory testing.
- In April 2024, according to Environment and Climate Change Canada, more than 95% of sodium chlorate produced globally was used to manufacture chlorine dioxide for pulp bleaching, while approximately 99% of North American production, equal to nearly 600,000 tonnes in Canada, was historically consumed by the pulp and paper sector.
The 98% to 99% purity tier is fastest growing segment, serves the broad industrial market where a slight reduction in purity is commercially acceptable in exchange for a meaningfully lower input cost particularly in agricultural herbicide formulations and general industrial chemical processing where the oxidising requirements are less stringent than in food-contact or pharmaceutical-adjacent applications.
Form Analysis
Crystalline Represents the Dominant Form Segment in the Market.
Crystalline sodium chlorate leads the form segment with 63.4% share and its commercial dominance reflects both its technical performance advantages and its practical logistics superiority over solution-form alternatives. Crystalline sodium chlorate is chemically stable, hygroscopic at standard storage conditions, and can be transported and stored in standard bulk containers over long distances without the significant degradation or hazard escalation that can affect liquid chemical shipments under variable temperature and handling conditions.
For large-scale industrial buyer’s pulp mills, chemical manufacturers, and mining operators that receive sodium chlorate in bulk quantities from suppliers potentially located hundreds or thousands of kilometres away, the handling simplicity, storage safety, and supply chain predictability of crystalline product are commercially essential qualities that solution-form cannot match at equivalent cost.
- In 2026, according to the U.S. National Institute of Standards and Technology, crystalline sodium chlorate had a measured density of 2.490 grams per cubic centimetre at 20°C, an average particle size of 192 ± 159 micrometres, and a stated purity of at least 99.0%.
End-Use Industry Analysis
Pulp and Paper Represents the Dominant End-Use Segment in the Market.
Pulp and paper accounts for 62.1% of total sodium chlorate end-use demand the dominant segment and this dominance is structural, durable, and non-discretionary in a way that makes the pulp and paper application the most commercially reliable demand anchor in the entire market. Every tonne of bleached kraft pulp produced anywhere in the world that uses an elemental chlorine-free bleaching process requires sodium chlorate as the feedstock for generating the chlorine dioxide that does the bleaching work.
The global boom in e-commerce packaging, the substitution of plastic packaging with paper-based alternatives, and the sustained growth of tissue and hygiene product consumption in emerging markets are all contributing to pulp production growth that keeps sodium chlorate demand structurally elevated.
- In December 2025, according to the Food and Agriculture Organization of the United Nations, global wood pulp production increased by 3% to 189 million tonnes in 2024, while international wood pulp trade rose by 2% to a record 73 million tonnes. This large production base supports sustained sodium chlorate consumption because the chemical is used to generate chlorine dioxide for pulp bleaching.
Mining and metal processing is fastest-growing segment and uses sodium chlorate as an oxidising agent in uranium ore processing and certain gold extraction processes a niche but high-value application where sodium chlorate’s performance characteristics are genuinely difficult to replicate with alternative chemistries.
Distribution Channel Analysis
Direct Sales/B2B Represents the Dominant Distribution Channel in the Market.
Direct sales and B2B procurement channels account for 67.5% of sodium chlorate distribution the dominant channel and this reflects the fundamental commercial reality of the sodium chlorate market: it is overwhelmingly an industrial product sold in large volumes to large institutional buyers through long-term supply relationships rather than a consumer product purchased through retail channels.
Pulp mills, chemical plants, water utilities, and mining operations all procure sodium chlorate in bulk quantities typically measured in hundreds or thousands of tonnes per year through direct supply agreements with producers or their authorised distributors that specify price, volume, delivery schedule, product specification, and quality documentation requirements in contractual arrangements that provide both parties with the supply security and commercial predictability that large-scale industrial operations require.
Online platforms are the fastest-growing distribution channel primarily serving laboratory and analytical grade buyers, research institutions, and small commercial users who value the convenience, price transparency, and broad product selection that digital procurement platforms offer relative to traditional distributor relationships.
Key Market Segments
By Grade
- Laboratory & ACS Reagent Grade
- Industrial Grade
- Agricultural / Herbicide Formulations
By Purity
- NaClO₃ Purity Above 99.5%
- NaClO₃ Purity 98%–99.5%
- NaClO₃ Purity Below 98%
By Form
- Crystalline
- Solution
By End-Use Industry
- Pulp & Paper
- Chemical Manufacturing
- Mining & Metal Processing
- Others
By Distribution Channel
- Direct Sales / B2B
- Distributors & Traders
- Online Platforms
Driver Analysis
Pulp output recovery lifts bleaching chemical pull-through
FAO reported that, after the 2023 downturn, global forest-product conditions improved in 2024, with wood pulp output up around 2% and paper and paperboard output up about 4% to 5%, while trade in wood and paper products rose 1.4% to $486 billion in 2024; that matters because sodium chlorate demand scales with chlorine-dioxide generation at bleached chemical pulp mills, so even low-single-digit pulp volume recovery can produce meaningful incremental chlorate offtake when mill operating rates normalize across Brazil, Chile, Scandinavia, Canada, China, and Southeast Asia.
Drivers Impact Analysis
| Driver | (~) % Impact on CAGR Forecast | Geographic Relevance | Impact Timeline |
|---|---|---|---|
| Pulp output recovery lifts bleaching chemical pull-through | +1.4% | APAC core, Latin America core, North America core, Nordics | Short term (≤ 2 years) |
| Industrial power inflation reshapes chlorate cost curves and pricing | +1.1% | North America core, EU core, APAC industrial belts | Short term (≤ 2 years) |
| Compliance-led chlorine dioxide bleaching sustains chlorate intensity | +0.9% | EU, North America, export-oriented APAC mills | Medium term (2-4 years) |
| Paper and board trade stabilization improves mill operating rates | +0.8% | APAC corridors, Latin America spill-over, EU, North America | Short term (≤ 2 years) |
| Energy-security and CBAM-era sourcing favor regionalized chemical supply | +0.6% | EU, Nordics, Middle East-Europe corridors | Medium term (2-4 years) |
| Capacity utilization discipline tightens merchant availability | +0.5% | North America, Brazil-Chile corridor, Northern Europe | Medium term (2-4 years) |
Restraint Analysis
Power cost volatility
In the United States, average wholesale day-ahead electricity prices rose across most major hubs in 2025 while Henry Hub natural gas averaged $3.52/MMBtu, up 56% from 2024, and the 2025 annual average industrial retail electricity price stood at 8.87 cents/kWh, creating a direct cost pass-through problem for chlorate units that can consume several MWh per tonne depending on cell design and current efficiency.
The restraint is strongest in merchant-power regions and in export-exposed plants that cannot fully reprice contracts quarterly, so even a 10% to 15% swing in delivered power can compress EBITDA margins by roughly 150 to 300 basis points, defer debottlenecking projects by 6 to 12 months, and justify a modeled -1.6 percentage-point deduction to 2026-based CAGR expectations in power-sensitive supply chains.
Restraint Impact Analysis
| Restraint | (~) % Impact on CAGR Forecast | Geographic Relevance | Impact Timeline |
|---|---|---|---|
| Power cost volatility | -1.6% | North America core, EU, APAC import corridors | Short term (≤ 2 years) |
| Carbon compliance burden | -1.1% | EU, EEA-linked trade routes, export suppliers into EU | Medium term (2-4 years) |
| Oxidizer logistics limits | -0.9% | North America core, EU, APAC corridors, LATAM export lanes | Short term (≤ 2 years) |
| Hazard-control CapEx | -0.8% | North America core, EU, Japan, Korea | Medium term (2-4 years) |
| Utility reliability stress | -0.7% | U.S. South and Midwest, Canada pulp belts, Nordic and APAC power-tight zones | Short term (≤ 2 years) |
| Trade and customs friction | -0.6% | EU border markets, U.S. import channels, seaborne APAC routes | Medium term (2-4 years) |
Opportunity Analysis
On-site chlorate at new pulp hubs
FAO’s pulp-and-paper capacity statistics confirm that global capacity planning and short-term forecasts remain active through 2025 updates, creating a visible project funnel that can be converted into chlorate-linked captive supply, utility-sharing, and indexed take-or-pay models rather than simple spot sales.
In strategic terms, suppliers that secure bundled power-salt-logistics packages at new pulp hubs can move from a commodity sale to a 10- to 15-year infrastructure annuity, with estimated delivered-cost savings of 8% to 14% from freight avoidance, working-capital release of 12 to 20 days through pipeline or short-haul delivery, and EBITDA margin uplift of 200 to 350 basis points relative to export-based merchant models; that economics supports an incremental +1.6 percentage-point CAGR upside if 12% to 18% of new pulp capacity additions through 2030 are captured under integrated contracts in Brazil, Indonesia, India, and other emerging fiber basins.
Opportunity Impact Analysis
| Opportunity | (~) % Potential CAGR Upside | Geographic Relevance | Execution Window |
|---|---|---|---|
| On-site chlorate at new pulp hubs | +1.6% | Latin America, APAC emerging | Medium term (2-4 years) |
| Water-treatment grade diversification | +1.1% | North America core, EU | Short term (≤ 2 years) |
| Low-carbon premium contracts | +0.9% | EU, Nordics, Canada | Short term (≤ 2 years) |
| Chlor-alkali hydrogen monetization | +1.3% | North America, EU, Middle East | Medium term (2-4 years) |
| Brownfield roll-up near salt/power nodes | +1.8% | U.S. Gulf, Canada, Scandinavia, China | Medium term (2-4 years) |
| Specialty oxidant export corridors | +0.7% | Africa, Southeast Asia, LATAM | Long term (≥ 4 years) |
Challenges Analysis
Logistics & trade volatility
Logistics and trade volatility have become a structural challenge for sodium chlorate, whose global flows depend heavily on cross‑border shipments between production hubs and pulp, water‑treatment, and specialty chemical demand clusters, with recent disruptions in the Gulf region and broader chemical supply chains adding roughly 1.0 percentage point friction drag to potential CAGR through longer lead times, higher freight costs, and elevated working capital.
Transit times on key corridors that previously averaged 18–24 days door‑to‑door for bulk chemicals have stretched to 28–35 days during periods of port congestion or route disruptions, forcing buyers to carry safety stocks 20–40% higher than pre‑2020 norms and tying up an extra 5–10 days of inventory equivalent in the supply chain.
Freight rates for hazardous oxidizers have seen periodic surcharges of 15–30% due to insurance and routing constraints, effectively increasing delivered chlorate costs by 20–40 USD per tonne on long‑haul routes and widening price dispersion between domestic and import‑dependent buyers. Over a two‑ to four‑year horizon, firms move toward more localised chlorate sourcing, renegotiate long‑term contracts with flexible delivery windows, and build buffer capacity near demand centers, which stabilizes end‑use operations but lowers the effective growth speed of internationally traded sodium chlorate volumes relative to underlying consumption trends in pulp and water‑treatment sectors.
Challenges Impact Analysis
| Challenge | (~) % CAGR Friction Drag | Geographic Relevance | Mitigation Horizon |
|---|---|---|---|
| High power intensity | -1.3% | Global chlor-alkali hubs | Long term (≥ 4 years) |
| Environmental compliance load | -0.8% | EU, India, North America | Medium term (2-4 years) |
| Logistics & trade volatility | -1.0% | Global export corridors | Medium term (2-4 years) |
| Safety & skills gap | -0.7% | Emerging & mid-tier plants | Long term (≥ 4 years) |
| Asset aging & capex lag | -0.9% | Legacy pulp regions | Long term (≥ 4 years) |
| Feedstock & power mix risk | -1.2% | Coal-reliant, gas-exposed markets | Medium term (2-4 years) |
Geopolitical Impact Analysis
Supply Concentration and Trade Policy Shifts Are Creating Strategic Vulnerabilities Across Multiple Application Segments
The sodium chlorate market is more directly and immediately exposed to geopolitical energy policy developments than most industrial chemical markets because electricity is not just an input cost in sodium chlorate production, it is the dominant input cost, representing the majority of the total manufacturing cost structure. This means that any geopolitical event, policy decision, or market development that materially changes industrial electricity prices in a major sodium chlorate producing country has an immediate and direct impact on the competitiveness of that country’s producers relative to their international counterparts.
The energy market disruptions caused by the Russia-Ukraine conflict, which sent European industrial electricity prices to historic highs in 2022 and 2023, created a significant and lasting competitiveness challenge for European sodium chlorate producers that has been only partially resolved by the subsequent normalisation of energy markets. Producers in regions with access to cost-competitive renewable electricity particularly Scandinavian and Canadian hydropower gained a meaningful structural cost advantage during this period that has reinforced their long-term competitive position relative to higher-energy-cost producers.
Trade policy developments particularly the escalating US-China tariff regime introduced and expanded in 2025 are creating supply chain complexity for sodium chlorate market participants who depend on Chinese-origin chemical intermediates, processing equipment, or downstream sodium chlorate product.
China is a significant producer of sodium chlorate and related chlorine chemistry and the progressive elevation of trade barriers between the US and China is reshaping the flow of sodium chlorate and related chemical products across the Pacific trade corridor in ways that are creating both cost pressures and supply security concerns for buyers who had built their procurement strategies around the availability of competitively priced Chinese-origin material.
Regional Analysis
Asia Pacific Leads the Global Sodium Chlorate Market.
In 2025, Asia Pacific dominated the global sodium chlorate market, holding 39.2% of total global consumption a commanding lead built on the region’s position as the world’s fastest-growing industrial chemical consumption base, with China, Japan, and South Korea collectively driving the region’s pulp and paper, chemical manufacturing, water treatment, and mining sector demand for sodium chlorate across a broad and diversified application landscape.
China drives the overwhelming majority of Asia Pacific’s market share through its enormous and rapidly modernising pulp and paper industry, its large-scale chemical manufacturing sector that uses sodium chlorate as a precursor in specialty chlorine compound production, and its expanding municipal water treatment infrastructure where chlorine dioxide generated from sodium chlorate is being adopted at increasing scale as a preferred disinfection technology. 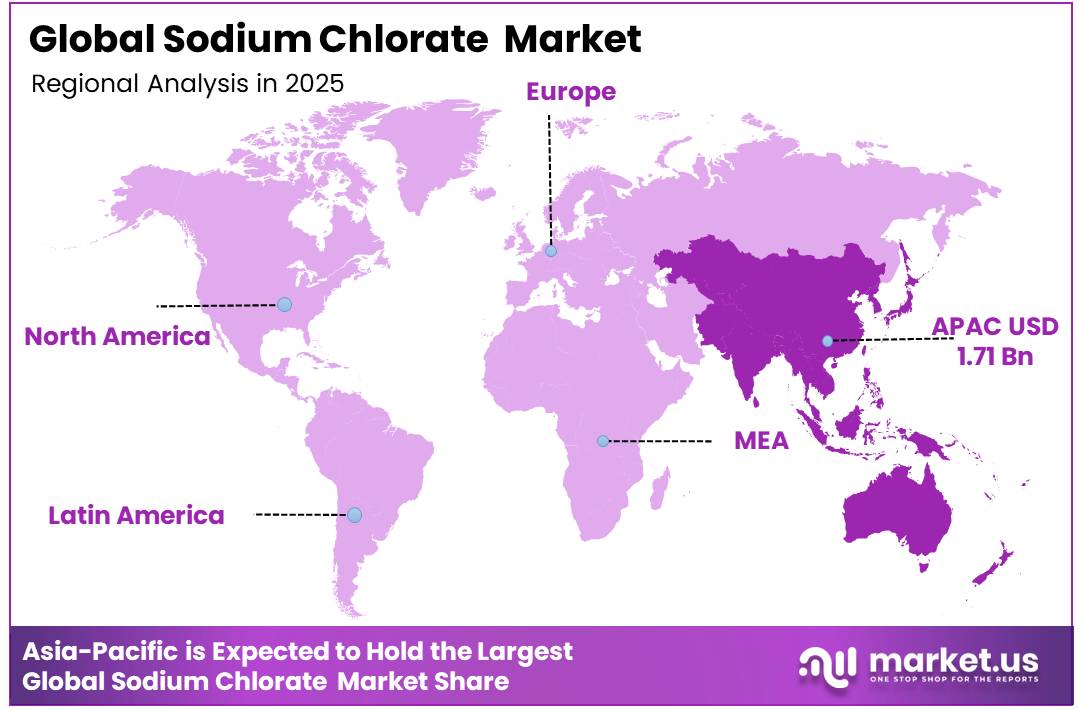
Southeast Asia particularly Indonesia, Vietnam, and Thailand is generating growing demand as the region’s paper and packaging industry expands rapidly alongside rising e-commerce penetration and increasing consumer goods consumption. New pulp mill investments across the region are adding sodium chlorate demand that was not present in previous years and the region’s chemical manufacturing base is growing rapidly enough to create meaningful incremental demand beyond the already significant pulp and paper application.
This combination of established and large-scale demand from the region’s industrial powerhouses and fast-growing new demand from Southeast Asia’s emerging industrial base ensures that Asia Pacific maintains its commanding lead in global sodium chlorate consumption through the forecast period.
Key Regions and Countries Covered
- North America
- The US
- Canada
- Europe
- Germany
- France
- The UK
- Spain
- Italy
- Russia & CIS
- Rest of Europe
- APAC
- China
- Japan
- South Korea
- India
- ASEAN
- Rest of APAC
- Latin America
- Brazil
- Mexico
- Rest of Latin America
- Middle East & Africa
- GCC
- South Africa
- Rest of MEA
Key Players Analysis
The global sodium chlorate market exhibits moderate consolidation with leading players including Nouryon, Kemira, Erco Worldwide, Arkema, Chemtrade Logistics, American Elements, Ercros S.A., Spectrum Chemical, and Thermo Fisher Scientific collectively holding a dominant share of global production capacity through large-scale electrochemical manufacturing facilities, long-established customer relationships with the world’s major pulp producers and water treatment operators, and proprietary process technology that optimises energy consumption and product purity in ways that smaller and less capitalised competitors struggle to replicate.
Smaller regional producers and Chinese manufacturers compete primarily in domestic and local markets where cost and proximity advantages outweigh the brand, quality, and supply security credentials of the international majors. Chinese producers hold a significant share of domestic Asian demand but face growing quality and regulatory scrutiny from international pulp and chemical buyers who require purity documentation and environmental compliance credentials that not all Chinese facilities have historically maintained to the standards that export market buyers demand.
The Major Players in The Industry
- ERCO Worldwide
- Nouryon Chemicals
- Kemira Oyj
- Arkema Group
- Chemtrade Logistics Inc.
- Canexus Corporation
- Olin Corporation
- Clariant AG
- Tronox Holdings Plc
- Qemetica (formerly Ciech S.A.)
- Osaka Soda Co., Ltd.
- China Salt Inner Mongolia Chemical Co., Ltd.
- Jiangsu Sanjili Chemical Co., Ltd.
- Weifang Yaxing Chemical Co., Ltd.
- Shree Chlorates Pvt. Ltd.
Key Development
- In November 2025, Chemtrade expanded its wider chemical portfolio by completing the Polytec acquisition, while its 2025 acquisitions of Polytec and selected Thatcher Group assets reached a combined value of US$180 million.
- In August 2025, Nouryon signed a long-term supply agreement with Arauco to build fully integrated sodium chlorate and chlorine dioxide facilities for Arauco’s USD 4.6 billion pulp mill in Mato Grosso do Sul, Brazil. The investment will increase Nouryon’s sodium chlorate capacity in Brazil and South America by 20% and its global capacity by almost 10%.
Report Scope
| Report Features | Description |
|---|---|
| Market Value (2025) | USD 4.36 Bn |
| Forecast Revenue (2035) | USD 6.80 Bn |
| CAGR (2026-2035) | 5.1% |
| Base Year for Estimation | 2025 |
| Historic Period | 2020-2024 |
| Forecast Period | 2026-2035 |
| Report Coverage | Revenue Forecast, Market Dynamics, Competitive Landscape, Recent Developments |
| Segments Covered | By Grade (Laboratory and ACS Reagent Grade, Industrial Grade, and Agricultural/Herbicide Grade), By Purity (NaClO₃ Purity Above 99%, NaClO₃ Purity 98% to 99%, and NaClO₃ Purity Below 98%), By Form (Crystalline and Solution), By End-Use Industry (Pulp and Paper, Chemical Manufacturing, Mining and Metal Processing, and Others), By Distribution Channel (Direct Sales/B2B, Distributors and Traders, and Online Platforms) |
| Regional Analysis | North America – The US & Canada; Europe – Germany, France, The UK, Spain, Italy, Russia & CIS, Rest of Europe; APAC– China, Japan, South Korea, India, ASEAN & Rest of APAC; Latin America– Brazil, Mexico & Rest of Latin America; Middle East & Africa– GCC, South Africa, & Rest of MEA |
| Competitive Landscape | ERCO Worldwide, Nouryon Chemicals, Kemira Oyj, Arkema Group, Chemtrade Logistics Inc., Canexus Corporation, Olin Corporation, Clariant AG, Tronox Holdings Plc, Qemetica (formerly Ciech S.A.), Osaka Soda Co., Ltd., China Salt Inner Mongolia Chemical Co., Ltd. Jiangsu Sanjili Chemical Co., Ltd. Weifang Yaxing Chemical Co., Ltd. Shree Chlorates Pvt. Ltd. |
| Customization Scope | Customization for segments, region/country-level will be provided. Moreover, additional customization can be done based on the requirements. |
| Purchase Options | We have three licenses to opt for: Single User License, Multi-User License (Up to 5 Users), Corporate Use License (Unlimited Users and Printable PDF) |





































