


Report Overview
Global Workwear Market size is expected to be worth around USD 32.5 Billion by 2035 from USD 21.2 Billion in 2025, growing at a CAGR of 4.4% during the forecast period 2026 to 2035. This steady climb shows workwear as a compliance-anchored category rather than a discretionary one. Buyers replace garments on mandated cycles, so vendors gain predictable, recurring revenue rather than volatile one-time sales.
Safety Apparel spans protective apparel, footwear, gloves, high-visibility gear, and flame-resistant clothing sold to employers across hazardous industries. Therefore the market structures around institutional procurement, not individual choice. Employers buy in bulk against safety standards, which means product certification and durability matter more than styling. This dynamic favors suppliers who can prove compliance and deliver at scale across multiple worksites.
Key Takeaways
- Global Workwear Market size will reach USD 32.5 Billion by 2035, up from USD 21.2 Billion in 2025, at a CAGR of 4.4%.
- Apparel led Product Type with a 48.70% share.
- Cotton and Cotton Blends led Material Type with a 39.80% share.
- Manufacturing and Industrial led Application with a 31.60% share.
- Large Enterprises led End User with a 57.40% share.
- Offline Distribution led Distribution Channel with a 67.90% share.
- General Workwear led Protection Level with a 46.20% share.
- Industrial and Manufacturing led End-Use Industry with a 35.80% share.
- Europe dominated with a 34.60% share, valued at USD 7.33 Billion.
Government safety policy anchors demand across this market. In the United States, OSHA enforcement intensified through 2024 and 2025, with serious-violation penalties reaching over USD 16,000 per citation. This means non-compliant employers face costs far above garment prices. Therefore procurement becomes non-discretionary, and suppliers who lead with certified compliance capture the least price-sensitive share of institutional spend.
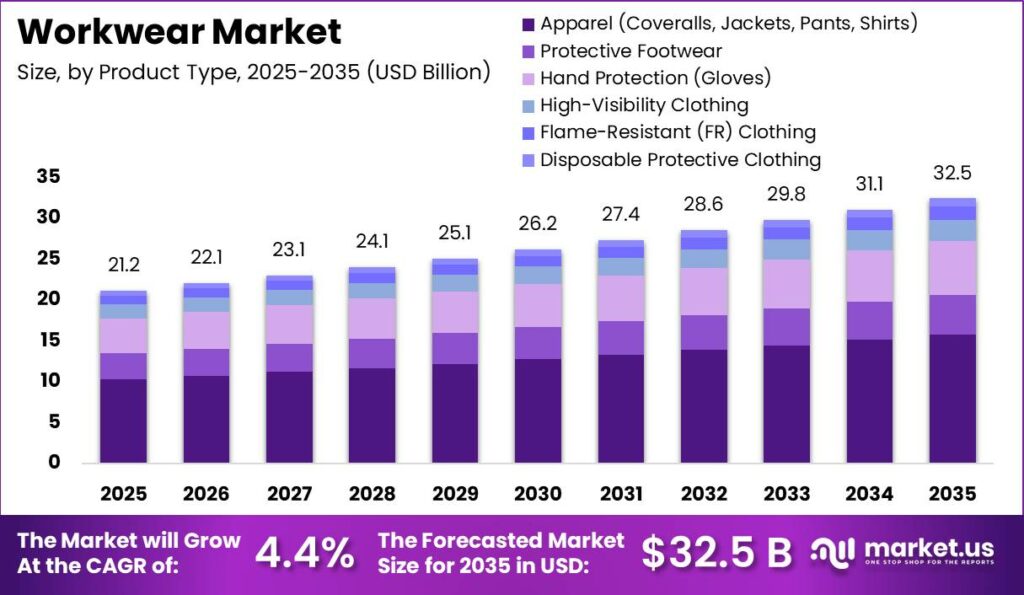
Data from the Bureau of Labor Statistics shows 2,488,400 nonfatal workplace injuries and illnesses in private industry in 2024. Each injury signals a hazard that mandates protective gear, which sustains repeat garment demand. As a result, workwear volume tracks industrial activity closely. Vendors positioned near high-injury sectors like construction and manufacturing gain a durable, policy-backed order pipeline.
As reported by the BSIF, 82% of PPE products from non-registered suppliers failed compliance safety tests during the January 2025 to January 2026 testing cycle. This failure rate exposes buyers to legal and safety risk from cheap imports. Therefore certified manufacturers can win share by positioning on verified compliance. In November 2025, Bluestar Alliance acquired the Dickies workwear brand from VF Corporation, strengthening its industrial apparel portfolio.
Apparel Analysis
Apparel dominates with 48.70% due to broad daily hazard coverage.
In 2025, Apparel held a dominant market position in the By Product Type segment of Workwear Market, with a 48.70% share. As reported by the U.S. Bureau of Labor Statistics, private industry recorded 2,488,400 nonfatal injuries in 2024 across sectors that mandate coveralls, jackets, and shirts. This means base-layer apparel serves the widest hazard range. Therefore vendors leading in apparel secure the largest recurring volume base.
Protective Footwear serves workers exposed to crushing, puncture, and slip hazards on active worksites. Data from the U.S. Bureau of Labor Statistics shows foot injuries remain a persistent contributor within the 2,488,400 annual injury pool. This means footwear demand tracks industrial employment tightly. Suppliers who certify to ANSI standards protect institutional accounts from liability, which locks in repeat contracts across construction and manufacturing sites.
Hand Protection covers gloves used against cuts, chemicals, and heat across manufacturing and healthcare. According to OSHA guidance, hand and eye protection rank among the most frequently required PPE categories on job sites. This means glove volume stays high and consumable, since gloves wear out fast. Therefore vendors gain frequent reorder cycles, giving glove-focused suppliers steadier cash flow than durable-garment producers.
High-Visibility Clothing protects workers near traffic and moving equipment, and OSHA mandates it for flaggers and roadside crews. Flame-Resistant Clothing and Disposable Protective Clothing hold the remaining share collectively, serving oil, gas, and healthcare buyers where single-use and burn protection are non-negotiable. This means specialized categories command premium pricing. Vendors covering these niches defend margin against commodity apparel competition.
Material Type Analysis
Cotton and Cotton Blends dominate with 39.80% due to comfort and breathability preference.
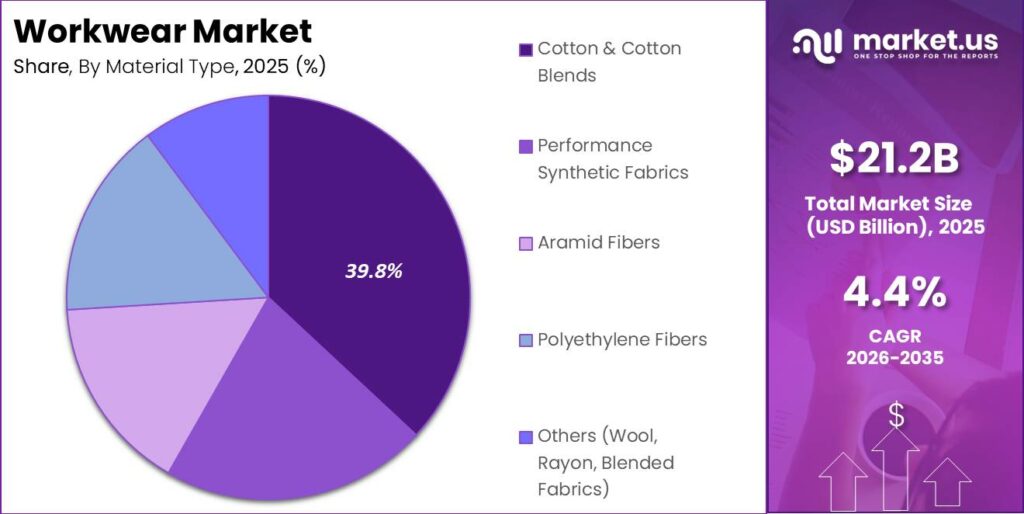
In 2025, Cotton and Cotton Blends held a dominant market position in the By Material Type segment of Workwear Market, with a 39.80% share. According to UN Comtrade, global trade in apparel under HS Chapters 61 and 62 exceeds hundreds of billions of dollars annually, with cotton articles forming a large volume base. This means cotton stays the default fabric for comfort-led daily wear. Therefore mills with cotton scale hold cost advantages.
Performance Synthetic Fabrics such as polyester, nylon, and aramid blends serve workers needing durability and moisture control. UN Comtrade data shows made-up textile articles under HS Chapter 63 move in large cross-border volumes tied to synthetic feedstocks. This means synthetic supply links directly to petrochemical pricing. Vendors who hedge feedstock exposure protect margin when crude-linked polyester costs spike.
Aramid Fibers deliver flame and cut resistance for oil, gas, and electrical workers facing extreme hazards. World Bank industrial indicators show energy-sector expansion sustaining demand for high-spec protective fibers. This means aramid buyers accept premium pricing for certified performance. Therefore suppliers with aramid capacity capture the least price-sensitive institutional accounts in high-risk industries.
Polyethylene Fibers add lightweight cut protection for handling and assembly roles. Others including wool, rayon, and blended fabrics hold the remaining share collectively, serving climate-specific and specialty uniform needs. This means niche fibers fill gaps that mass fabrics cannot. Vendors offering fabric breadth win multi-category tenders that single-fiber suppliers lose.
Application Analysis
Manufacturing and Industrial dominates with 31.60% due to dense workforce hazard exposure.
In 2025, Manufacturing and Industrial held a dominant market position in the By Application segment of Workwear Market, with a 31.60% share. Data from the ILO shows manufacturing carries one of the highest occupational injury burdens among all sectors globally. This means factory floors require constant protective coverage. Therefore vendors serving industrial buyers secure the deepest and most consistent order volumes.
Healthcare and Medical buyers procure scrubs and protective apparel for infection control and staff safety. World Bank workforce data shows sustained health-sector employment growth across advanced and emerging economies. This means healthcare uniform demand rises with workforce expansion. Vendors bundling laundering and compliance services capture recurring hospital contracts that outlast one-time garment sales.
Construction workers face falling objects, sharp edges, and traffic hazards daily. According to OSHA modeling, 79.85% of U.S. construction workers use PPE of some type. This means the sector already embeds protective procurement. Therefore vendors targeting construction gain policy-backed demand tied directly to active building pipelines and infrastructure spending.
Oil and Gas, Mining, Utilities and Energy, Food Processing, and Transportation and Logistics hold the remaining share collectively. As reported by the ILO, these high-hazard sectors mandate flame-resistant and chemical-protective gear. This means each carries premium per-worker kitting spend. Vendors covering multiple heavy industries diversify against single-sector downturns.
End User Analysis
Large Enterprises dominate with 57.40% due to bulk safety procurement mandates.
In 2025, Large Enterprises held a dominant market position in the By End User segment of Workwear Market, with a 57.40% share. According to the ILO, large employers face the strictest occupational safety enforcement and audit exposure. This means they buy protective garments in high volume against formal standards. Therefore vendors with scale distribution capture the bulk of stable, contracted enterprise spend.
Small and Medium Enterprises buy protective gear in smaller, fragmented lots across many locations. World Bank enterprise data shows SMEs form the majority of registered firms worldwide. This means aggregate SME demand is large but harder to reach. Vendors with online distribution and flexible order sizes unlock this scattered but sizable buyer pool.
Government and Public Sector buyers procure uniforms for defense, municipal, and utility workers under tender frameworks. As reported by the World Bank, public payrolls remain a stable employment base across most economies. This means government demand resists private-sector cycles. Therefore vendors qualified for public tenders gain counter-cyclical revenue that steadies overall order flow.
Distribution Channel Analysis
Offline Distribution dominates with 67.90% due to bulk contract fulfillment reliance.
In 2025, Offline Distribution held a dominant market position in the By Distribution Channel segment of Workwear Market, with a 67.90% share. According to UN Comtrade, apparel and made-up textile trade moves in large containerized volumes through distributor and wholesale networks. This means bulk institutional buyers rely on established offline supply chains. Therefore vendors with distributor reach control the primary route to enterprise accounts.
Online Distribution serves smaller buyers and reorders needing speed and price transparency. World Bank digital economy indicators show rising B2B e-commerce adoption across industrial procurement. This means online channels capture SME and top-up demand. Vendors building digital storefronts reach fragmented buyers that traditional distributors overlook, widening total addressable spend.
Direct Sales and Corporate Contracts hold the remaining share collectively, serving large employers through negotiated multi-year agreements. As reported by UN Comtrade, direct manufacturer shipments form a measurable slice of cross-border apparel flows. This means direct deals lock in volume and margin. Vendors securing corporate contracts gain predictable, high-retention revenue streams.
Protection Level Analysis
General Workwear dominates with 46.20% due to everyday baseline safety coverage.
In 2025, General Workwear held a dominant market position in the By Protection Level segment of Workwear Market, with a 46.20% share. Data from the ILO shows most workers need baseline protection rather than specialized hazard gear. This means general workwear serves the widest employee base. Therefore vendors leading here command the largest unit volume across all protection tiers.
Multi-Hazard Protective Workwear serves roles exposed to combined risks like heat, chemicals, and impact. According to OSHA, complex worksites require layered protection meeting multiple standards at once. This means multi-hazard gear commands premium pricing. Vendors certifying garments to several standards simultaneously win high-value contracts in oil, gas, and heavy industry.
Flame-Resistant Workwear, Chemical Protective Workwear, and High-Visibility Workwear hold the remaining share collectively. As reported by the ILO, these categories protect workers in energy, chemical, and roadside settings where injury severity runs highest. This means each carries strict certification and repeat-replacement cycles. Vendors covering all three defend margin against commodity general-workwear competition.
End-Use Industry Analysis
Industrial and Manufacturing dominates with 35.80% due to sustained high-volume workforce exposure.
In 2025, Industrial and Manufacturing held a dominant market position in the By End-Use Industry segment of Workwear Market, with a 35.80% share. According to the ILO, manufacturing employs one of the largest hazard-exposed workforces globally. This means factory demand anchors total market volume. Therefore vendors serving industrial buyers gain the deepest and most stable procurement base.
Healthcare buyers procure protective apparel for clinical safety and infection control. World Bank data shows health-sector employment expanding across most economies. This means uniform demand grows with staffing. Vendors offering laundering and compliance bundles win multi-year hospital contracts that convert one-time sales into recurring service revenue.
Construction and Infrastructure buyers equip workers against high-severity site hazards. According to OSHA modeling, 79.85% of U.S. construction workers already use PPE. This means the sector embeds protective procurement into project budgets. Vendors aligned to infrastructure pipelines gain demand tied directly to committed construction spending.
Oil, Gas and Petrochemicals, Transportation and Warehousing, and Agriculture hold the remaining share collectively. As reported by the ILO, these sectors mandate flame-resistant and high-visibility gear under strict safety rules. This means each sustains premium, certification-led demand. Vendors covering them diversify revenue against single-industry cycles.
Key Market Segments
By Product Type
- Apparel (Coveralls, Jackets, Pants, Shirts)
- Protective Footwear
- Hand Protection (Gloves)
- High-Visibility Clothing
- Flame-Resistant (FR) Clothing
- Disposable Protective Clothing
By Material Type
- Cotton & Cotton Blends
- Performance Synthetic Fabrics (Polyester, Nylon, Aramid Blends)
- Aramid Fibers
- Polyethylene Fibers
- Others (Wool, Rayon, Blended Fabrics)
By Application
- Manufacturing & Industrial
- Healthcare & Medical
- Construction
- Oil & Gas
- Mining
- Utilities & Energy
- Food Processing
- Transportation & Logistics
By End User
- Large Enterprises
- Small & Medium Enterprises (SMEs)
- Government & Public Sector
By Distribution Channel
- Offline Distribution (Distributors, Industrial Suppliers, Retail Stores)
- Online Distribution
- Direct Sales / Corporate Contracts
By Protection Level
- General Workwear
- Multi-Hazard Protective Workwear
- Flame-Resistant (FR) Workwear
- Chemical Protective Workwear
- High-Visibility Workwear
By End-Use Industry
- Industrial & Manufacturing
- Healthcare
- Construction & Infrastructure
- Oil, Gas & Petrochemicals
- Transportation & Warehousing
- Agriculture
Regional Analysis
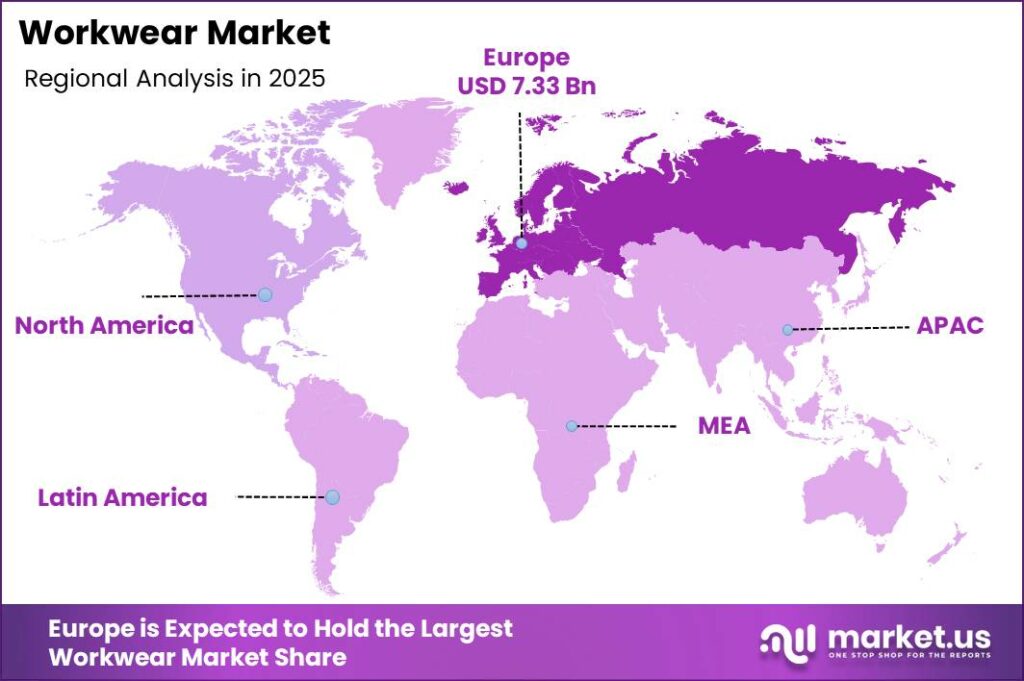
Europe Dominates the Workwear Market with a Market Share of 34.60%, Valued at USD 7.33 Billion
Industrial Safety spending anchors Europe’s lead, where the region held a 34.60% share worth USD 7.33 Billion in 2025. Strict EU safety regulation forces employers to replace non-conforming garments on tight cycles. This means demand stays compliance-driven rather than discretionary. Therefore vendors certified to EU standards secure durable, repeat institutional orders across the continent’s industrial base.
Asia-Pacific stands as the fastest-growing region, driven by rapid industrialization across China, India, and Southeast Asia. Rising blue-collar employment expands the hazard-exposed workforce needing protective gear. This means volume demand climbs alongside factory buildout. As a result, vendors establishing regional supply and distribution early gain first-mover access to a fast-widening buyer base.
North America, Latin America, and the Middle East and Africa together hold the remaining share. OSHA enforcement sustains North American demand, while GCC infrastructure pipelines drive Middle East procurement. This means each region offers policy-backed volume. Vendors covering multiple regions balance mature compliance markets against high-growth infrastructure-led demand.
Key Regions and Countries
North America
- US
- Canada
Europe
- Germany
- France
- The UK
- Spain
- Italy
- Rest of Europe
Asia Pacific
- China
- Japan
- South Korea
- India
- Australia
- Rest of APAC
Latin America
- Brazil
- Mexico
- Rest of Latin America
Middle East and Africa
- GCC
- South Africa
- Rest of MEA
Market Dynamics
Market Opportunity Analysis - Underserved regions and low-penetration segments open entry points for new players
Asia-Pacific offers the widest regional opening, since it stands as the fastest-growing region yet trails Europe’s 34.60% lead. Rapid industrialization expands the hazard-exposed workforce faster than local supply can serve. This means garment demand outpaces regional certified capacity. Therefore new entrants building local production and distribution early can claim share before global incumbents scale their presence.
Online Distribution remains underexploited against Offline’s 67.90% dominance in the channel mix. Fragmented SME and reorder demand still routes through slow traditional networks. This means a digital-first vendor can reach buyers that distributors overlook. By contrast, incumbents anchored in offline logistics move slowly online, leaving the digital channel open for agile challengers.
Small and Medium Enterprises trail Large Enterprises, which hold 57.40% of end-user spend. SMEs buy in scattered lots that big vendors underserve. This means aggregate SME demand stays large but poorly reached. Instead of chasing only enterprise tenders, new players offering flexible order sizes can consolidate this fragmented pool into a defensible niche.
Market Opportunity Analysis - Underserved regions and low-penetration segments open entry points for new players
AI-based computer vision systems now monitor PPE compliance across industrial safety environments. Real-time object detection using YOLO-based architectures automates workplace safety enforcement through PPE recognition. This means employers can verify compliance continuously without manual audits. Therefore vendors whose garments integrate with digital detection systems gain preference in factories running automated safety workflows.
IoT-embedded smart workwear enables real-time worker safety monitoring across North America, Germany, Australia, and GCC markets. Sensors track exposure, motion, and vital signs during high-risk tasks. This means garments become data platforms rather than passive protection. As a result, manufacturers who embed connectivity capture premium contracts and recurring service revenue beyond one-time sales.
Fluorine-free durable water-repellent chemistries advance as PFAS bans force material innovation. These finishes carry a 15% to 25% cost premium over legacy PFAS at equal performance. This means early developers can license fabric technology as a B2B revenue stream. Therefore manufacturers who solve compliant high-performance chemistry first turn a regulatory burden into a differentiation advantage.
Drivers
Government safety mandates form the strongest upward force on this market. In North America, OSHA enforcement intensified through 2024 and 2025, pushing serious-violation penalties above USD 16,000 per citation. This means non-compliant employers face costs far exceeding garment prices, making procurement non-discretionary. Therefore premium workwear producers sustain gross margins of 38% to 44%, roughly 8 to 12 percentage points above commodity-tier rivals.
In the EU, PPE Regulation (EU) 2016/425 tightened CE-marking rules and drove a visible replacement cycle from 2023 onward. This means repurchase intervals compressed from 3 to 4 years down to 18 to 24 months in high-risk categories. In GCC economies, Vision 2030 pipelines sustaining over USD 1 trillion in construction spend lifted per-worker kitting cost by 20% to 30%. As a result, compliance-driven volume stays price-resilient for certified suppliers.
| Driver | (~) % Impact on CAGR Forecast | Geographic Relevance | Impact Timeline |
|---|---|---|---|
| Tightening Statutory Occupational Safety Mandates Across Heavy Industries | +1.8% | Global — led by North America, EU, & GCC | Short term (≤ 2 years) |
| Rapid Industrialization & Infrastructure Buildout in Asia-Pacific Expanding the Employed Blue-Collar Base | +1.2% | Asia-Pacific — China, India, Southeast Asia | Short term (≤ 2 years) |
| Corporate ESG Mandates Triggering Bulk Uniform Procurement Upgrades Among Large Employers | +0.7% | North America & Western Europe | Medium term (2–4 years) |
| Healthcare Sector Workforce Expansion Driving Sustained Scrub & Protective-Apparel Volume Growth | +0.5% | North America, Europe, Middle East | Short term (≤ 2 years) |
| EU Extended Producer Responsibility Scheme Forcing Accelerated Garment Replacement Cycles | +0.3% | European Union | Medium term (2–4 years) |
Restraints
PFAS chemistry bans now freeze high-performance fabric development. France banned PFAS-containing clothing textiles from 1 January 2026, while Denmark’s order follows on 1 July 2026 at 50 mg F/kg. California’s AB-1817 capped intentionally added PFAS at 100 ppm from 2025, tightening to 50 ppm in 2027. This means manufacturers must reformulate durable water-repellent finishes fast, disrupting proven supply chains.
Most national bans carve out safety clothing where no alternative exists, creating a regulatory grey zone. This means safety-critical categories stall while consumer-adjacent lines reformulate immediately. Fluorine-free DWR chemistries carry a 15% to 25% cost premium over legacy finishes. As a result, high-performance capex freezes because margins compress under tender-capped pricing that blocks cost pass-through.
| Restraint | (~) % Impact on CAGR Forecast | Geographic Relevance | Impact Timeline |
|---|---|---|---|
| PFAS Chemistry Prohibition Cascading Into Workwear High-Performance Fabric Reformulation Freeze | −1.1% | EU, France, Denmark, California, Colorado | Short term (≤ 2 years) |
| Concentrated Asian Manufacturing Exposure Creating Tariff-Driven Unit-Cost Inflation That Suppresses Volume Orders | −0.6% | North America, Europe (import-heavy buyers) | Short term (≤ 2 years) |
Challenges
Cotton and polyester price swings squeeze manufacturer margins. Cotton spot prices moved between USD 0.70 and USD 0.95 per pound across 2024 and 2025, with monthly volatility near 18% to 22% of the rolling mean. This means fixed-price long-term contracts become unwritable for producers sourcing in six-month cycles. Therefore mid-tier manufacturers carry raw-material risk they cannot fully hedge.
Polyester makes up 35% to 40% of blended workwear fabric and tracks crude oil feedstocks within 60 to 90 days. This means energy price spikes hit fabric costs fast. A 15% simultaneous rise in both fibers can cut gross margins by 3 to 5 percentage points per quarter. As a result, producers locked under 12 to 24 month tenders absorb the hit.
| Challenge | (~) % CAGR Friction Drag | Geographic Relevance | Mitigation Horizon |
|---|---|---|---|
| Cotton & Polyester Input Volatility | −0.8% | Global — all manufacturing geographies | Medium term (2–4 years) |
| EU Digital Product Passport Readiness Gap | −0.5% | EU market & all exporters to EU | Medium term (2–4 years) |
| Skilled Seamstress & Technical Sewing Talent Deficit | −0.4% | Eastern Europe, North Africa, South Asia | Long term (≥ 4 years) |
| Fragmented SME Buyer Procurement Digitization Lag | −0.3% | Global — disproportionate in emerging markets | Medium term (2–4 years) |
| Greenwashing Litigation Risk on Sustainability Claims | −0.2% | EU, UK, Australia | Short term (≤ 2 years) |
Opportunities
Workwear-as-a-service rental converts one-time sales into recurring revenue. Providers retain garment ownership and charge per-employee subscriptions covering laundering, repair, and recycling. This extends the revenue relationship from a 2 to 4 year replacement cycle into continuous multi-year cash flow. As of 2025, this segment grew near 5.6% annually, ahead of the 4.4% market baseline, signaling superior unit economics for early operators.
Penetration outside Europe and Japan stays below 10% of addressable employer spend, exposing large white space in North America, Southeast Asia, and the Middle East. This means early movers can claim underserved regions. The EU Textile EPR Directive 2025/1892, in force October 2025, rewards ownership-retention models. Therefore operators reaching route density gain margin uplift of 12 to 18 percentage points over outright-sale profiles.
| Opportunity | (~) % Potential CAGR Upside | Geographic Relevance | Execution Window |
|---|---|---|---|
| Workwear-as-a-Service Rental & Circular Laundry Model Monetization | +1.4% | Western Europe, Nordics, Japan | Medium term (2–4 years) |
| IoT-Embedded Smart Workwear for Real-Time Worker Safety Monitoring | +1.0% | North America, Germany, Australia, GCC | Medium term (2–4 years) |
| Untapped Formal Workwear Demand in India’s Formalized Gig & Manufacturing Workforce | +0.6% | India | Short term (≤ 2 years) |
| Fluorine-Free High-Performance DWR Fabric Licensing as a B2B Differentiation Revenue Stream | +0.5% | EU, North America | Medium term (2–4 years) |
| Digital Product Passport Compliance-as-a-Service Bundled With Workwear Supply Contracts | +0.3% | EU & all brands exporting to EU | Medium term (2–4 years) |
Key Company Insights
3M holds a structural advantage through its broad respiratory, hearing, and head protection portfolio spanning multiple hazard categories. This breadth lets 3M win multi-standard tenders that single-category rivals cannot serve. In March 2026, Bain Capital and 3M agreed to acquire Madison Fire and Rescue in a USD 1.95 Billion deal, adding SCBA respiratory systems. This move deepens 3M’s high-margin industrial safety reach but raises integration risk across new equipment lines.
Honeywell International Inc. anchors its position in process safety and industrial equipment across energy and critical infrastructure sectors. In June 2025, Honeywell completed a USD 2.16 Billion acquisition of Sundyne, expanding into energy process safety. This scale gives Honeywell pricing power in high-hazard industrial accounts. However, its 2025 divestment of the PPE business narrows direct garment exposure, creating a gap that focused apparel challengers can exploit.
Key Players
- 3M
- Honeywell International Inc.
- DuPont
- Lakeland Industries, Inc.
- Ansell Limited
- Carhartt, Inc.
- VF Corporation
- Fristads AB
- Engelbert Strauss GmbH & Co. KG
- Mascot International A/S
- Cintas Corporation
- UniFirst Corporation
- Aramark
- Alsico Group
- Portwest
Recent Developments
- May 2025: Protective Industrial Products completed the acquisition of Honeywell’s Personal Protective Equipment business for approximately $1.3 Billion, expanding its global head-to-toe safety portfolio across respiratory, hearing, head, and fall protection categories.
- June 2025: Honeywell completed its $2.16 Billion acquisition of Sundyne, expanding its industrial equipment and process safety portfolio into energy and critical infrastructure sectors.
- October 2025: H.I.G. Capital completed the acquisition of Rentokil Initial’s France Workwear business for €410 Million, expanding its textile rental and industrial uniform services portfolio.
Geopolitical Impact Analysis
Trade tensions reshape workwear sourcing as import-heavy buyers face rising tariff exposure. According to the WTO, average applied tariffs on textiles and apparel range between 8% and 12% across major importing economies, lifting landed costs on Asian-made garments. This means North American and European buyers absorb higher unit costs on concentrated Asian supply. Therefore manufacturers diversifying sourcing away from single-country exposure protect margin and delivery reliability.
Shipping disruption compounds the cost pressure across global textile flows. As reported by UNCTAD, container freight rates spiked over 150% during Red Sea rerouting, adding 10 to 14 days of transit delay on Asia-to-Europe lanes. This means fabric and finished-garment deliveries slow while logistics costs climb. As a result, vendors holding regional inventory buffers and nearshore capacity gain a service edge over import-dependent competitors.
Report Scope
| Report Features | Description |
|---|---|
| Market Value (2025) | USD 21.2 Billion |
| Forecast Revenue (2035) | USD 32.5 Billion |
| CAGR (2026-2035) | 4.4% |
| Base Year for Estimation | 2025 |
| Historic Period | 2020-2024 |
| Forecast Period | 2026-2035 |
| Report Coverage | Revenue Forecast, Market Dynamics, Market Opportunity Analysis, Technology and Innovation Landscape, Competitive Landscape, Recent Developments |
| Segments Covered | By Product Type (Apparel, Protective Footwear, Hand Protection, High-Visibility Clothing, Flame-Resistant Clothing, Disposable Protective Clothing), By Material Type (Cotton & Cotton Blends, Performance Synthetic Fabrics, Aramid Fibers, Polyethylene Fibers, Others), By Application (Manufacturing & Industrial, Healthcare & Medical, Construction, Oil & Gas, Mining, Utilities & Energy, Food Processing, Transportation & Logistics), By End User (Large Enterprises, SMEs, Government & Public Sector), By Distribution Channel (Offline Distribution, Online Distribution, Direct Sales / Corporate Contracts), By Protection Level (General Workwear, Multi-Hazard Protective Workwear, Flame-Resistant Workwear, Chemical Protective Workwear, High-Visibility Workwear), By End-Use Industry (Industrial & Manufacturing, Healthcare, Construction & Infrastructure, Oil, Gas & Petrochemicals, Transportation & Warehousing, Agriculture) |
| Regional Analysis | North America (US and Canada), Europe (Germany, France, The UK, Spain, Italy, and Rest of Europe), Asia Pacific (China, Japan, South Korea, India, Australia, and Rest of APAC), Latin America (Brazil, Mexico, and Rest of Latin America), Middle East and Africa (GCC, South Africa, and Rest of MEA) |
| Competitive Landscape | 3M, Honeywell International Inc., DuPont, Lakeland Industries, Inc., Ansell Limited, Carhartt, Inc., VF Corporation, Fristads AB, Engelbert Strauss GmbH & Co. KG, Mascot International A/S, Cintas Corporation, UniFirst Corporation, Aramark, Alsico Group, Portwest |
| Customization Scope | Customization for segments, region / country-level will be provided. Additional customization can be done based on requirements. |
| Purchase Options | We have three licenses to opt for: Single User License | Multi-User License (Up to 5 Users) | Corporate Use License (Unlimited User and Printable PDF) |





































