


Report Overview
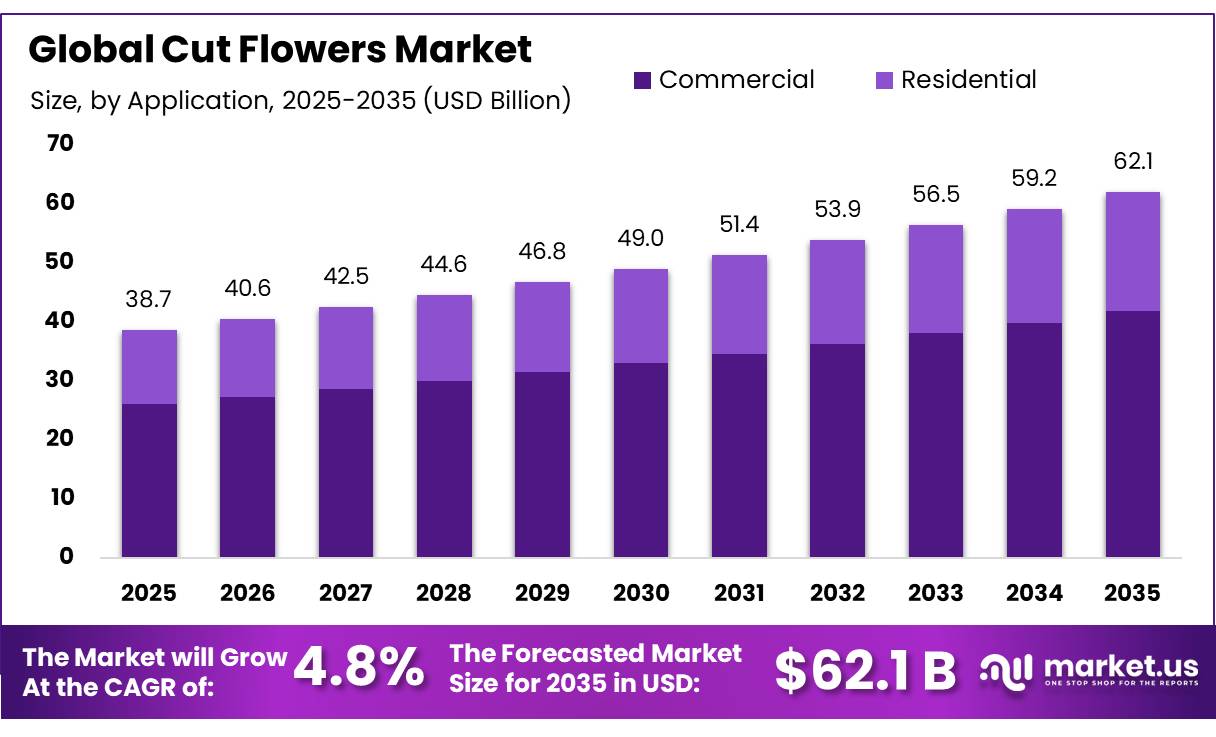
The Global Cut Flowers Market size is expected to be worth around USD 62.1 Billion by 2035, from USD 38.7 Billion in 2025, growing at a CAGR of 4.8% during the forecast period from 2026 to 2035. In 2025, Europe held a dominant market position, capturing more than a 37.67% share, holding USD 14.5 Billion revenue.
The cut flowers industry is an internationally connected horticultural business covering roses, lilies, carnations, chrysanthemums, tulips and other flowers grown for bouquets, decoration, ceremonies and hospitality applications.
- Production depends heavily on greenhouse management, fertilizers, crop-protection products, irrigation, cold storage and rapid transportation because flowers have a limited post-harvest life. The industry’s commercial importance is visible in the United States, where USDA reported total floriculture sales of US$8.41 billion in 2025, supported by 11,728 floriculture operations.
USDA’s 2025 Floriculture Crops Highlights reported wholesale cut-flower sales of US$389 million among operations with annual sales of at least US$100,000. Florida generated US$1.408 billion in overall floriculture sales, while California contributed US$1.110 billion. Together, the two states accounted for 30% of U.S. floriculture sales, showing how production remains concentrated in major horticultural regions with established greenhouse, labor and distribution infrastructure.
- International trade remains another major industry driver. Statistics Netherlands reported in January 2026 that Dutch agricultural exports increased by more than 8% in 2025, while export value for horticultural products including cut flowers, bulbs, plants and nursery products—increased by 4% compared with 2024. The Netherlands earned more than €49 billion from agricultural exports overall, illustrating the strength of the logistics and trading infrastructure that also supports European flower distribution.
African flower-producing countries also remain important suppliers. Kenya’s Agriculture and Food Authority reported that flower exports reached 32,463.44 metric tonnes during April–June 2025, generating approximately KES 25.49 billion and representing 50% of the country’s horticultural export value during the period. Compared with the same quarter of 2024, flower export volume increased from 24,408.63 metric tonnes, showing strong international demand despite freight and regulatory pressures.
Digital greenhouse controls can help growers manage temperature, humidity, irrigation and nutrient delivery more accurately, while improved packaging and refrigerated logistics can reduce post-harvest losses. Government statistics also show a sizeable employment base: USDA counted 8,478 floriculture operations with hired workers in 2025, an increase of 13% from 2024.
Key Takeaways
- Cut Flowers Market size is expected to be worth around USD 62.1 Billion by 2035, from USD 38.7 Billion in 2025, growing at a CAGR of 4.8%.
- Rose held a dominant market position, capturing more than a 38.78% share.
- Commercial” held a dominant market position, capturing more than a 67.43% share.
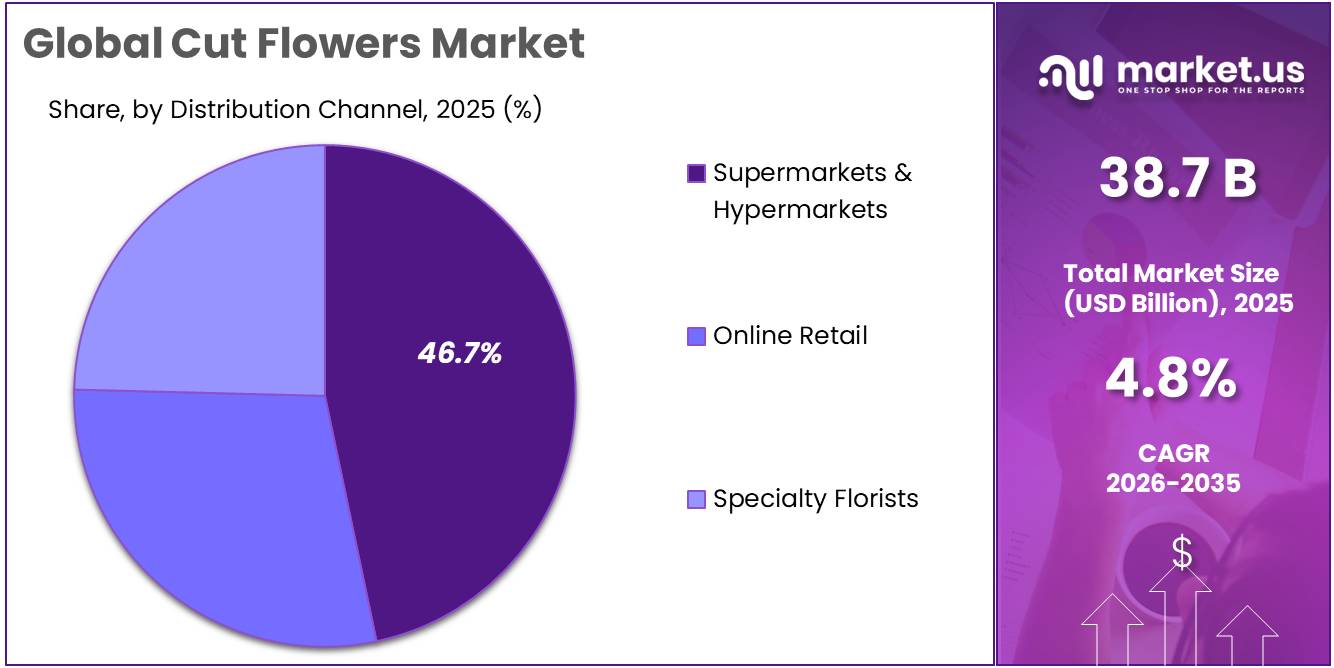
- Supermarkets & Hypermarkets held a dominant market position, capturing more than a 46.78% share.
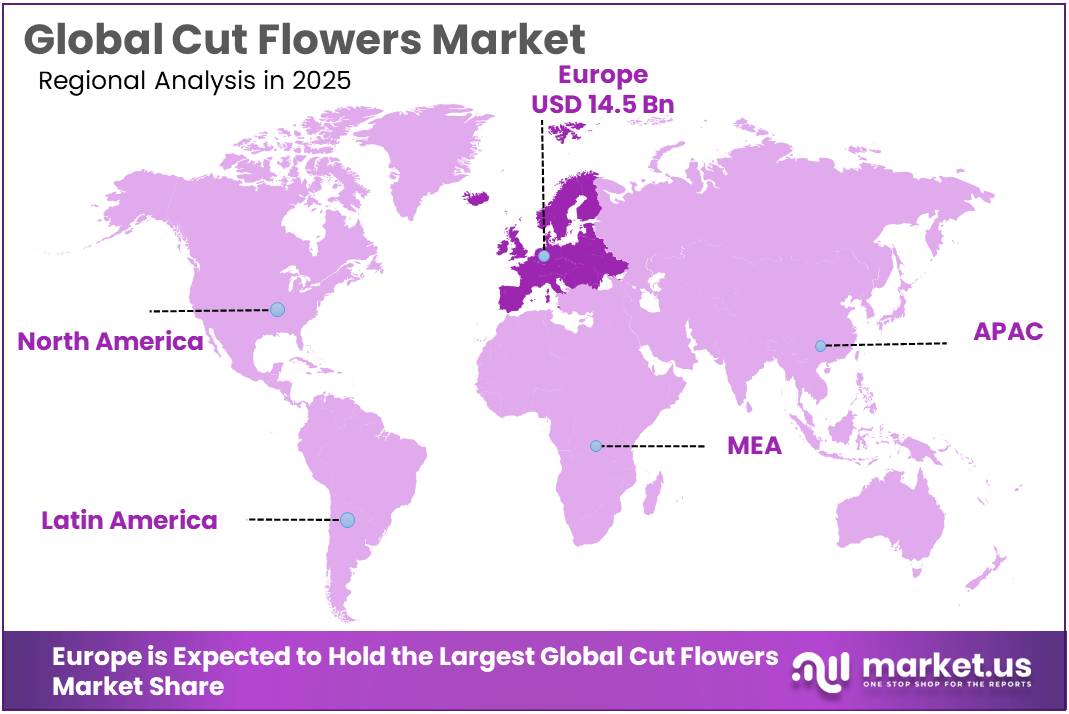
- Europe held a dominant position in the Cut Flowers Market, capturing more than a 37.67% share and reaching USD 14.5 billion.
By Type Analysis
Rose dominates the Cut Flowers Market with a 38.78% share, supported by its strong position in bouquets, gifting and event decoration
In 2025, “Rose” held a dominant market position, capturing more than a 38.78% share. Roses continue to lead the cut flower category because they are widely used for weddings, anniversaries, celebrations, hospitality decoration and everyday gifting. Their year-round commercial demand also supports greenhouse cultivation, refrigerated distribution and international flower trade. Government data show the scale of the wider industry supporting rose sales.
- In 2025, U.S. floriculture sales reached US$8.41 billion, while operations with annual sales of at least US$100,000 generated US$389 million from cut flowers. Florida recorded US$1.408 billion in overall floriculture sales and California generated US$1.110 billion, with the two states together accounting for 30% of national floriculture sales. International demand also remained strong, with UK cut-flower imports reaching £680 million in 2025, compared with £636 million in 2024.
Both standard and spray chrysanthemums are used by florists and retailers, giving growers flexibility across different price and product categories. Government horticulture statistics underline the scale of the supply chain in which chrysanthemums compete. USDA reported 11,728 floriculture operations in the United States during 2025, while 8,478 operations employed hired workers. The average peak workforce reached 15 workers per operation.
By Application Analysis
Commercial applications dominate the Cut Flowers Market with a 67.43% share, supported by florists, events, hospitality and institutional decoration
In 2025, “Commercial” held a dominant market position, capturing more than a 67.43% share. Commercial demand remains strong because cut flowers are regularly purchased by florists, hotels, restaurants, event organizers, wedding businesses, offices and other establishments that require fresh floral arrangements. Frequent replacement cycles also create recurring demand compared with occasional household purchases. Government statistics demonstrate the size of the supporting floriculture industry.
- USDA reported that U.S. floriculture sales reached US$8.41 billion in 2025 across 11,728 operations. Operations generating at least US$100,000 annually recorded US$6.67 billion in sales, representing 79.3% of total floriculture sales. Cut-flower sales from these larger operations reached US$389 million. Florida generated US$1.408 billion and California US$1.110 billion in overall floriculture sales, with the two states accounting for 30% of national sales.
Residential applications represent an important part of the Cut Flowers Market as consumers purchase fresh flowers for home decoration, birthdays, anniversaries, seasonal celebrations, personal gifting and other occasions. Household demand benefits from supermarkets, garden centers, florists and online delivery channels, which have made bouquets and individual flower varieties easier to purchase throughout the year. The wider consumer market remains substantial.
According to Statistics Netherlands, Dutch households spent €44.1 billion on recreation and culture in 2025, illustrating the scale of discretionary consumer spending that supports lifestyle categories such as home decoration and leisure-related products.
By Distribution Channel Analysis
Supermarkets & Hypermarkets dominate Cut Flowers with a 46.78% share, supported by high customer traffic and convenient bouquet purchases
In 2025, “Supermarkets & Hypermarkets” held a dominant market position, capturing more than a 46.78% share. These stores remain an important sales channel because consumers can purchase bouquets and individual stems alongside regular grocery shopping. Large retail networks also provide refrigerated storage, frequent product replenishment and convenient access to imported and domestically grown flowers.
Government retail data underline the scale of this distribution environment. According to the U.S. Department of Agriculture Economic Research Service, grocery stores generated US$617 billion in inflation-adjusted food sales in 2025, while total food-at-home spending reached US$1.10 trillion. The U.S. Census Bureau separately reported that total retail trade sales reached US$7.1 trillion in 2025.
Florists also create value through flower selection, arrangement, packaging and scheduled delivery, helping the channel compete with mass-market retailers. Government statistics indicate a sizeable commercial base supporting specialist floral businesses. The U.S. Bureau of Labor Statistics reported in 2025 that floral designers held approximately 38,000 jobs in 2024, while about 49% were employed by florists.
Key Market Segments
By Type
- Rose
- Chrysanthemum
- Carnation
- Gerbera
- Lilium
- Others
By Application
- Residential
- Commercial
By Distribution Channel
- Supermarkets & Hypermarkets
- Specialty Florists
- Online Retail
Driver Analysis
Digital Gifting Adoption
A florist or gifting platform with a USD 45–70 average order value can generate USD 12–25 of gross contribution per order after flowers, packaging, payment fees, local delivery, and customer support; increasing repeat purchase frequency from 1.5–2.0 to 3.0–4.0 orders annually raises customer lifetime value by roughly USD 35–100 without proportionate acquisition spending. Digital channels also enable bouquet demand aggregation: a platform processing 10,000 daily orders can forecast 40–60% of next-week demand by city, color, price tier, and delivery date, allowing wholesalers to reduce safety inventory by 10–20% and improve sell-through of perishable stems by 3–7 percentage points.
The commercial shift favors standardized bouquets of 10–25 stems, USD 25–85 price points, and 24–48-hour fulfillment rather than individualized in-store selection, expanding market access for younger, mobile-first, time-constrained, and remote consumers. The U.S. commercial floriculture sector has sufficient scale to support this channel transition: USDA reported USD 8.40 billion in 2025 floriculture-crop sales, up 18% year on year, while Florida and California together represented 30% of U.S. floriculture sales, concentrating production and distribution capability around large consumer markets.
Suppliers capture the upside by integrating inventory feeds, dynamic substitution rules, florist fulfillment partners, subscription offers, and event-date marketing; the principal economic threshold is keeping last-mile delivery at 10–18% of order value and cancellation or refund rates below 3–5%. Digital gifting is estimated to add +2.0 percentage points to cut-flower CAGR in North America, Europe, Japan, South Korea, China’s upper-tier cities, India’s metros, and GCC markets through 2028.
Drivers Impact Analysis
| Driver | (~) % Impact on CAGR Forecast | Geographic Relevance | Impact Timeline |
|---|---|---|---|
| Digital gifting adoption | +2.0 pp | North America, EU, Japan, urban APAC | Short term (≤ 2 years) |
| Premium occasion-led demand | +1.7 pp | North America, EU, GCC, APAC metros | Short term (≤ 2 years) |
| Retail bouquet standardization | +1.5 pp | North America, EU, UK, Australia | Medium term (2–4 years) |
| Cold-chain modernization | +1.4 pp | Africa–EU, LATAM–U.S., APAC corridors | Medium term (2–4 years) |
| Sustainable-origin procurement | +1.2 pp | EU, UK, North America, Japan | Medium term (2–4 years) |
| Greenhouse production technology | +1.0 pp | Netherlands, EU, North America, Japan | Long term (≥ 4 years) |
Restraint Analysis
Airfreight Cost Exposure
Kenya’s flower supply chain illustrates this dependency: perishables represented roughly 77% of monthly cargo throughput at Jomo Kenyatta International Airport in 2025, flowers accounted for more than half of export volumes, and air cargo remains the dominant mode into Europe because transit time directly affects quality and selling price.
For a 1-kg export carton carrying 80–150 rose stems, a USD 0.20–0.60 per kg increase in fuel, handling, security, capacity, or congestion charges can add USD 0.002–0.008 per stem before distributor margin; on a 5-million-stem seasonal programme, that produces USD 10,000–40,000 of incremental logistics cost, while a USD 0.80–1.50 per kg peak-season premium can erase 8–20% of grower gross margin if retail pricing cannot adjust.
Capacity shortfalls also require 1–3 days of pre-booking buffers, additional 4–12°C cold storage, 2–6% more contingency inventory, and shipment consolidation that can reduce auction arrival flexibility. Large producers can negotiate annual block-space agreements, use 10–25% multi-carrier capacity, pre-position 7–14 days of key varieties, and employ digital demand forecasting, but small and mid-sized farms face spot-market rates and working-capital requirements that constrain export volume. This restraint is estimated to deduct approximately -1.9 percentage points from attainable CAGR across East Africa–Europe, Colombia/Ecuador–North America, Ethiopia–Europe, and Asia-Pacific long-haul flower corridors through 2028.
Restraint Impact Analysis
| Restraint | (~) % Impact on CAGR Forecast | Geographic Relevance | Impact Timeline |
|---|---|---|---|
| Airfreight cost exposure | -1.9 pp | East Africa–EU, LATAM–U.S., APAC | Short term (≤ 2 years) |
| Perishability-driven waste | -1.6 pp | Global export corridors | Medium term (2–4 years) |
| Energy-intensive production | -1.4 pp | Netherlands, EU, North America, Japan | Medium term (2–4 years) |
| Phytosanitary compliance burden | -1.1 pp | EU import hubs, UK, North America | Short term (≤ 2 years) |
| Climate and pest losses | -1.0 pp | Kenya, Ecuador, Colombia, EU, Asia | Long term (≥ 4 years) |
| Consumer discretionary pressure | -0.9 pp | North America, EU, urban APAC | Medium term (2–4 years) |
Opportunity Analysis
Floral Subscription Platforms
A consumer paying USD 35–75 per delivery every two or four weeks generates USD 420–1,800 of annual gross merchandise value, and a platform retaining 25–40% after grower, logistics, packaging, payment, and service costs can create USD 105–720 of annual contribution margin per active member before marketing; at 100,000 subscribers with a USD 48 monthly average order value and 75% successful-renewal rate, annualized sales can exceed USD 57 million.
The commercial advantage is operational as much as consumer-facing: a subscription operator can forecast 55–75% of weekly volume 7–21 days before delivery, versus 25–45% for walk-in florists, enabling growers to plan planting, harvest, bunching, and airfreight allocation more efficiently and potentially reducing spoilage by 2–6 percentage points.
The market is not yet structurally organized around consumer lifetime value: lowering paid-acquisition cost from USD 35–65 per new user to USD 20–40 through referrals, employer partnerships, wedding registries, loyalty bundles, and gifting credits can improve payback from 4–8 deliveries to 2–5 deliveries, while churn reduction from 8% to 5% monthly nearly doubles average customer lifetime.
The model is most viable where dense courier economics permit USD 4–10 incremental delivery cost per box and 24–48-hour fulfillment, notably North America, Western Europe, Japan, South Korea, Singapore, Australia, and affluent Indian and Chinese cities. This is an opportunity rather than baseline growth because it creates a recurring-revenue consumption format and a proprietary demand-data asset; disciplined platform operators could add approximately +2.1 percentage points to market CAGR within two years.
Opportunity Impact Analysis
| Opportunity | (~) % Potential CAGR | Geographic Relevance | Execution Window |
|---|---|---|---|
| Floral subscription platforms | +2.1 pp | North America, EU, Japan, urban APAC | Short term (≤ 2 years) |
| Traceable premium stems | +1.8 pp | EU, UK, North America, Japan | Medium term (2–4 years) |
| Near-market micro-farms | +1.6 pp | North America, EU, GCC, urban APAC | Medium term (2–4 years) |
| Cold-chain capacity networks | +1.4 pp | Africa–EU, LATAM–U.S., APAC corridors | Medium term (2–4 years) |
| Event-demand data exchange | +1.2 pp | North America, EU, China, India, GCC | Short term (≤ 2 years) |
| Grower-platform roll-ups | +1.0 pp | Kenya, Ethiopia, Ecuador, Colombia, EU | Long term (≥ 4 years) |
Challenges Analysis
Cold-Chain Execution Variability
FAO notes that perishables must be cooled within hours of harvest and that cold chains preserve quality and shelf life across production-to-consumption stages; insufficient refrigeration is associated with 526 million tonnes, or about 12%, of global food loss and waste, showing the broad infrastructure challenge that also affects floral logistics.
A typical rose export pathway targets 0–4°C from packhouse to airport and 2–8°C in retail handling, but 6–12 cumulative hours above target temperature can reduce remaining vase life by 1–3 days; for an importer moving 50 million stems at USD 0.45 average realized value, a rise in claims, markdowns, and discard from 7% to 10% destroys approximately USD 675,000 annually before re-delivery, labor, and customer-service costs.
The friction worsens on mixed loads: a USD 100,000 shipment can contain 10–30 varieties with distinct ethylene sensitivity and hydration needs, and one delayed pallet or warm transfer can turn a 2% defect into a 10–15% buyer credit on sensitive lines.
Mitigation requires pre-cooling within 2–4 hours, mandatory temperature logging at 15–30-minute intervals, shared data handoffs, reefer-dock capacity, pallet-level exception alerts, airline service-level agreements, and shelf-life-based inventory allocation, but investments of USD 0.05–0.15 per stem for monitoring, handling, packaging, and chilled fulfillment can exceed margin on entry-level bouquets. This execution variance is estimated to impose a -1.5-percentage-point CAGR drag across Africa–Europe, Latin America–U.S., Middle East, and Asia-Pacific flower corridors over two to four years.
Challenges Impact Analysis
| Challenge | (~) % CAGR Friction Drag | Geographic Relevance | Mitigation Horizon |
|---|---|---|---|
| Cold-chain execution variability | -1.5 pp | Africa–EU, LATAM–U.S., APAC corridors | Medium term (2–4 years) |
| Seasonal labor capability gaps | -1.3 pp | East Africa, LATAM, EU, North America | Long term (≥ 4 years) |
| Crop-health resistance cycles | -1.2 pp | Global greenhouse and field farms | Long term (≥ 4 years) |
| Fragmented traceability systems | -1.0 pp | EU, UK, North America, export hubs | Medium term (2–4 years) |
| Freight-network schedule volatility | -0.9 pp | Kenya, Ethiopia, Ecuador, Colombia | Medium term (2–4 years) |
| Climate-yield planning uncertainty | -0.8 pp | Africa, LATAM, EU, APAC growers | Long term (≥ 4 years) |
Geopolitical Impact Analysis
Middle East and Red Sea Conflicts Raise Logistics and Input Costs Across the Cut Flowers Market
Ongoing conflict in the Middle East and continued security risks around the Red Sea are affecting the Cut Flowers Market through higher freight, fuel, fertilizer and insurance costs. Cut flowers are highly perishable, so longer transport routes and unreliable delivery schedules can reduce freshness and raise losses for growers and exporters. UNCTAD reported in September 2026 that more than 80% of world merchandise trade by volume moves by sea, meaning disruptions at major shipping routes can quickly increase supply-chain costs.
The impact is particularly important for flower-producing countries supplying Europe and the Middle East. Kenya’s Agriculture and Food Authority reported that flower exports reached 32,463.44 metric tonnes during April–June 2025, generating KES 25.49 billion and accounting for 50% of national horticultural export earnings. The agency has also identified Red Sea security disruption as a factor increasing competition for airfreight capacity and raising logistics costs for flower exporters.
Regional Insights
Europe Leads the Cut Flowers Market with 37.67% Share and USD 14.5 Billion Market Value
In 2025, Europe held a dominant position in the Cut Flowers Market, capturing more than a 37.67% share and reaching USD 14.5 billion. The region benefits from established flower auctions, greenhouse production, refrigerated logistics and strong consumer demand for bouquets and decorative flowers. The Netherlands remains central to this ecosystem. Statistics Netherlands reported that Dutch exports of flowers and plants reached €15.3 billion in 2025, with export value increasing 5.3% and export volume rising 4% from the previous year. Germany remained the leading destination for Dutch flowers and plants.
Europe’s position is further supported by substantial cross-border flower trade. UK government data show that cut-flower imports reached £680 million in 2025, increasing from £636 million in 2024, while cut-flower exports increased to £35 million from £23 million. Total ornamental imports reached £1.553 billion during 2025. European demand also attracts large volumes from overseas growers. Kenya’s Agriculture and Food Authority reported that the Netherlands accounted for 29.2% of Kenya’s horticultural export value during April–June 2025, while the UK represented 10.5%, Spain 6.2%, and Germany 5.5%. Flowers were identified as a main export driver in several European destinations.
Key Regions and Countries Insights
- North America
- US
- Canada
- Europe
- Germany
- France
- The UK
- Spain
- Italy
- Rest of Europe
- Asia Pacific
- China
- Japan
- South Korea
- India
- Australia
- Rest of APAC
- Latin America
- Brazil
- Mexico
- Rest of Latin America
- Middle East & Africa
- GCC
- South Africa
- Rest of MEA
Key Players Analysis
Dümmen Orange holds a strong position in cut flowers through breeding and propagation of roses, chrysanthemums, carnations, gerberas and other varieties. The company employs more than 5,300 people worldwide and operates over 260 hectares of production space across Africa, Central America, South America and Asia. Its Breeding Technology Centre supports development of stronger and disease-resistant varieties. In May 2026, Dümmen Orange and Syngenta Flowers signed an agreement to establish a joint venture, combining complementary ornamental breeding and propagation portfolios.
Danziger Group maintains a broad position in cut flowers through breeding, propagation and international distribution. Founded in 1953, the company manages more than 600 elite varieties and serves around 1,000 customers in over 60 countries. More than 500 million cuttings of Danziger varieties are planted annually, while its R&D breeding team includes over 100 employees. Production facilities cover approximately 70 hectares of open fields and 15 hectares of greenhouses, supporting varieties such as Gypsophila, Chrysanthemum, Limonium and Scabiosa.
Dos Gringos LLC operates as a Southern California grower, bouquet assembler and supplier of fresh-cut flowers and foliage. The company was established in 1988 in Carlsbad, California, giving it more than 35 years of operating experience in the floral industry. Its business combines flower growing with handmade bouquet assembly, packing and distribution, allowing it to serve retail-oriented floral programs. Current company information places its workforce in the 501–1,000 employee range, supporting cultivation, bouquet production and fresh-flower distribution activities.
Top Key Players Outlook
- Dummen Orange
- Danziger Group
- Dos Gringos LLC
- Esmeralda Farms
- Flamingo
- Florance Flora
- Karen Roses Company
- Marginpar BV
- Multiflora
- Rosebud Limited
- Selecta One
- Washington Bulb Co., Inc.
- Soex Flora
- Florius Flowers
- David Austen Roses
- Jet Fresh Flowers
- The Queen’s Flowers
- Maryland Grown Flowers
- Turkish Flower Group
- Other Key Players
Recent Developments
- In January 2026, Flamingo Horticulture Kenya announced an expansion across its 1,630-hectare Naivasha footprint, including upgrades to 2 packhouses, climate-smart water systems and integrated pest management.
- In February 2026, Royal FloraHolland reported that Marginpar operated 16 production sites in Africa, employed more than 4,000 people, and offered around 100 unique flower varieties developed over more than 35 years.
Report Scope
| Report Features | Description |
|---|---|
| Market Value (2025) | USD 38.7 Bn |
| Forecast Revenue (2035) | USD 62.1 Bn |
| CAGR (2026-2035) | 4.8% |
| Base Year for Estimation | 2025 |
| Historic Period | 2020-2024 |
| Forecast Period | 2026-2035 |
| Report Coverage | Revenue Forecast, Market Dynamics, Competitive Landscape, Recent Developments |
| Segments Covered | By Type (Rose, Chrysanthemum, Carnation, Gerbera, Lilium, Others), By Application (Residential, Commercial), By Distribution Channel (Supermarkets & Hypermarkets, Specialty Florists, Online Retail) |
| Regional Analysis | North America – US, Canada; Europe – Germany, France, The UK, Spain, Italy, Rest of Europe; Asia Pacific – China, Japan, South Korea, India, Australia, Singapore, Rest of APAC; Latin America – Brazil, Mexico, Rest of Latin America; Middle East & Africa – GCC, South Africa, Rest of MEA |
| Competitive Landscape | Dummen Orange, Danziger Group, Dos Gringos LLC, Esmeralda Farms, Flamingo, Florance Flora, Karen Roses Company, Marginpar BV, Multiflora, Rosebud Limited, Selecta One, Washington Bulb Co., Inc., Soex Flora, Florius Flowers, David Austen Roses, Jet Fresh Flowers, The Queen’s Flowers, Maryland Grown Flowers, Turkish Flower Group, Other Key Players |
| Customization Scope | Customization for segments, region/country-level will be provided. Moreover, additional customization can be done based on the requirements. |
| Purchase Options | We have three licenses to opt for: Single User License, Multi-User License (Up to 5 Users), Corporate Use License (Unlimited User and Printable PDF) |





































