


Report Overview
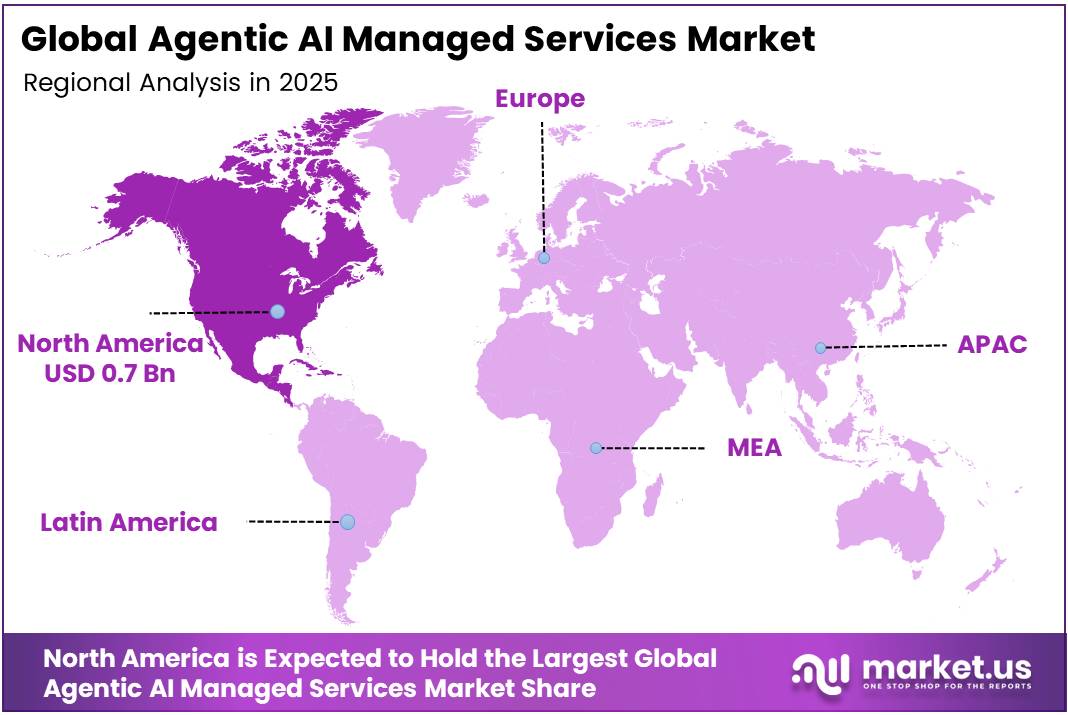
In 2025, the Global Agentic AI Managed Services Market was valued at USD 1.8 billion. The market is projected to grow at a CAGR of 44.7% during 2026–2035, reaching approximately USD 70.3 billion by 2035. North America dominated the global market in 2025, accounting for more than 38.7% of the total market share and generating approximately USD 0.7 billion in revenue.
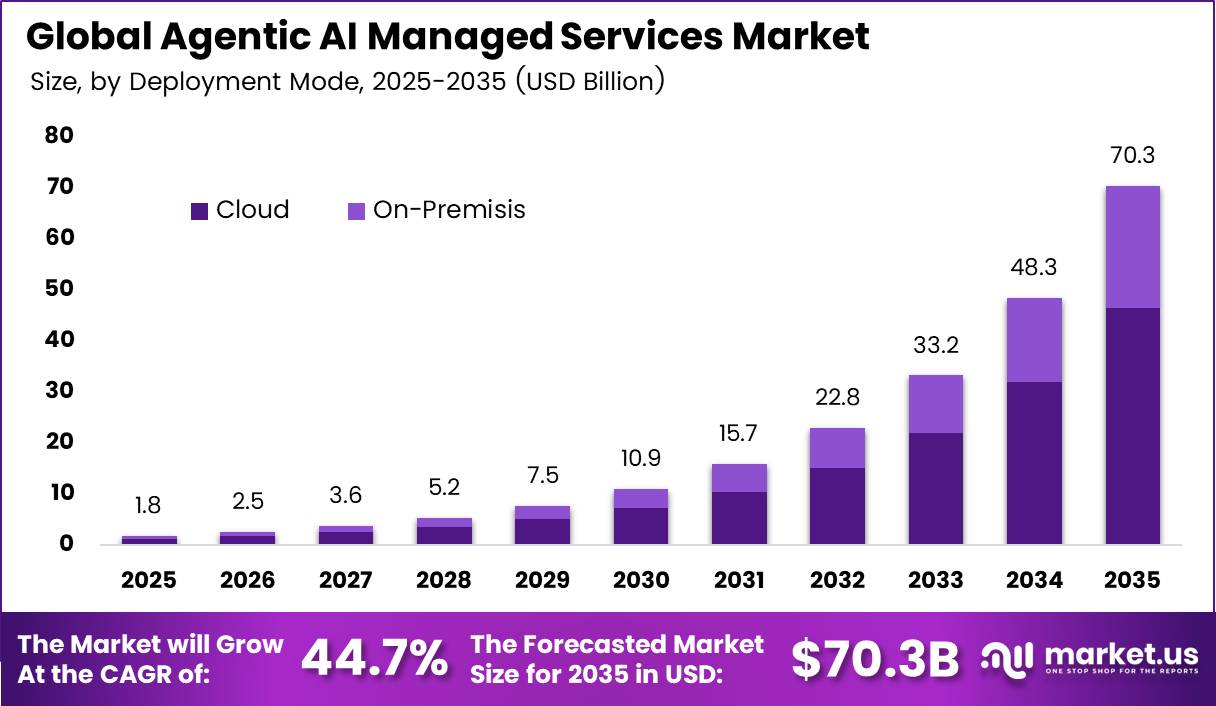
Growth comes from businesses moving AI out of pilots and into daily operations. The OECD reported that 20.2% of firms used AI in 2025, up from 14.2% in 2024 and 8.7% in 2023, so adoption more than doubled in two years. As more firms run AI agents in finance, service, and IT, they need outside partners to deploy, monitor, and govern them.
Compute demand shows the same trend. The IEA expects data centre electricity use to rise from about 415 TWh in 2024 to around 945 TWh by 2030. It also expects power use in accelerated servers, driven mostly by AI, to grow 30% each year. Every new agent workload adds more need for managed integration, tracking, and lifecycle support.
North America holds the largest base of enterprise software buyers and AI infrastructure. The IEA found that the United States and China will drive nearly 80% of global data centre electricity growth to 2030, and the WTO named North America the fastest-growing market for AI-related goods. This hardware build gives US and Canadian firms the base they need to run agent fleets at scale.
Key Takeaways
- The Global Agentic AI Managed Services Market reached USD 1.8 billion in 2025 and will reach USD 70.3 billion by 2035. grow at a CAGR of 44.7% from 2026 to 2035.
- By service type, Agent Deployment and Integration Services lead with a 38.0% share.
- By deployment mode, Cloud leads with a 66.4% share.
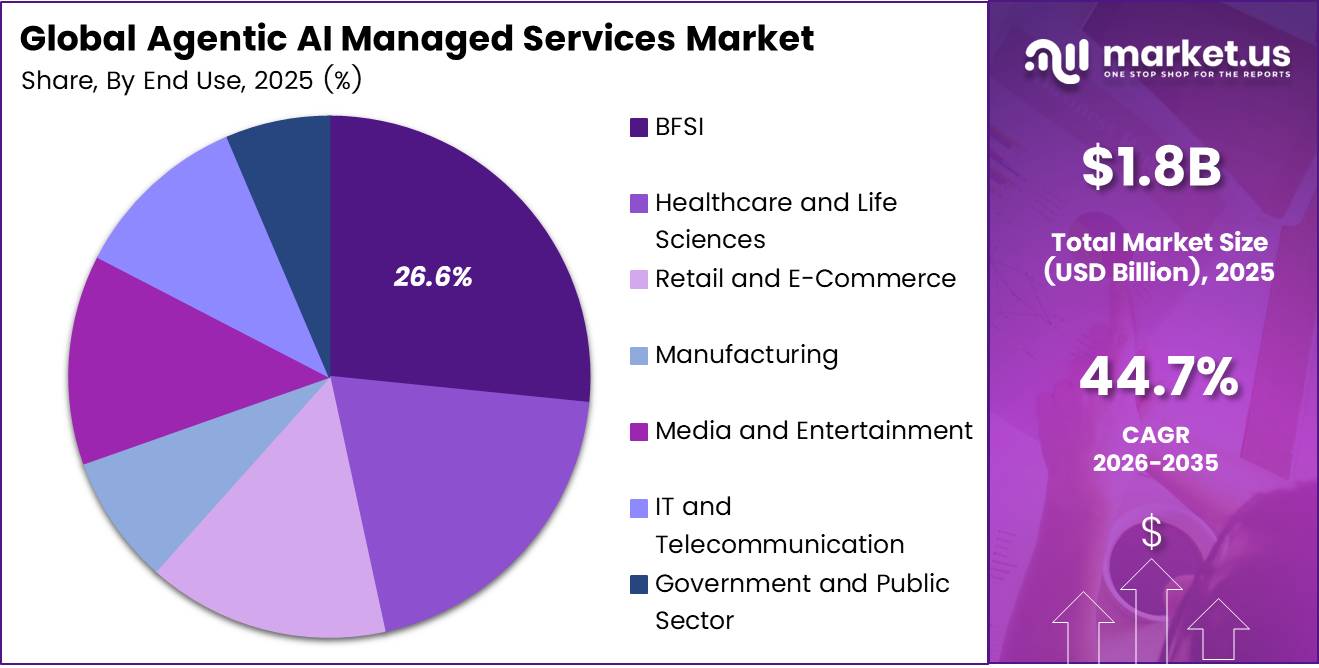
- By end user industry, BFSI leads with a 26.6% share.
- North America leads with a 38.7% share and USD 0.7 billion in revenue.
By Service Type
Agent Deployment and Integration Services dominates with 38.0% due to connecting agents with existing business systems.
Agent Deployment and Integration Services leads the supplied market breakdown because companies need working links between AI agents, business software, and company records before they can gain value. Providers connect systems, set access rights, test tasks, and build clear routes for human approval. These steps help buyers move from small trials to daily use without disrupting core work.
Eurostat reports that 13.48% of EU enterprises used AI in 2024, while adoption reached 41.17% among large enterprises. This gap points to a wider need for skilled support as more companies introduce AI into established operations. Agent Governance and Compliance Services represents the fastest-growing category in the supplied segmentation, although the cited sources do not establish that market ranking.
By Deployment Mode
Cloud dominates with 66.4% due to flexible computing and faster agent rollout.
Cloud holds the leading position in the supplied segmentation because companies can launch agents without first buying and maintaining dedicated computing equipment. Cloud services let teams adjust capacity, connect shared applications, and manage updates across several locations. This approach suits firms that want to test new tasks before committing to a larger rollout.
Eurostat reports that 45.2% of EU enterprises purchased cloud services in 2023. Among those buyers, 75.3% purchased advanced services covering areas such as security software, database hosting, or application development. These figures show an existing base of cloud users that managed service providers can serve; they do not measure agentic AI adoption directly.
On-Premises represents the fastest-growing deployment category in the supplied input, rather than a ranking that the cited dataset confirms. Its growth case comes from buyers that want tighter control over sensitive records, system access, and connections to local equipment.
By End User Industry
BFSI dominates with 26.6% due to high transaction volumes and control needs.
BFSI leads the supplied industry breakdown because banks, financial service firms, and insurers manage large flows of records and repeat tasks under strict controls. Agents can help gather documents, route requests, and support service teams, while staff retain approval over important decisions. Existing digital use gives providers a practical starting point for these services.
Bank of America reports that 79% of consumer and small business households actively used its digital platforms at year-end 2024. The bank also reports a 7% annual increase in active Erica users. These figures illustrate demand for digital banking support, not adoption of autonomous agents across BFSI.
Healthcare and Life Sciences holds the fastest-growing label in the supplied segmentation, although the approved sources do not independently confirm that ranking. Its growth case centers on reducing routine work around scheduling, records, research documents, and service coordination.
The FDA reports that it had authorized more than 1,600 AI-enabled medical devices by September 2026. That total shows a growing clinical AI base, although medical devices differ from managed agents. Providers can support wider automation by building secure connections, tracking actions, and setting clear approval steps that keep clinical judgment with qualified staff.
Key Market Segments
By Service Type
- Agent Deployment and Integration Services
- Agent Governance and Compliance Services
- Agent Monitoring and Tracking Services
- Agent Versioning and Lifecycle Management Services
- Other
By Deployment Mode
- Cloud
- On-Premisis
By End User Industry
- BFSI
- Healthcare and Life Sciences
- Retail and E-Commerce
- Manufacturing
- Media and Entertainment
- IT and Telecommunication
- Government and Public Sector
- Other
Geopolitical Impact Analysis
Trade tensions now affect the hardware layer behind agentic AI managed services. UNCTAD reported that average US tariff rates rose from 2.8% before 2025 to over 20% by early September 2025, and WTO and IMF estimates put the sustained US average at 20.1%, the highest level since the 1910s.
Providers rent or buy GPU servers, networking gear, and storage to host client agents, so these duties raise compute costs that flow into managed service contracts. Buyers also tried to get ahead of the duties. The WTO found that US import volumes jumped 11% year on year in the first half of 2025 as firms built up stock.
AI hardware also sits at the center of world trade. The WTO reported that trade in AI-enabling goods grew 21.9% in 2025 to USD 4.18 trillion, driving 42% of global trade growth. Asia handles 62% of this trade, which leaves Western providers exposed to Asian supply routes and export controls.
Shipping risk adds more pressure. UNCTAD cited data showing Red Sea transits running 70% below normal, as ships take longer routes around the Cape of Good Hope, which slows server deliveries and raises freight costs. Higher hardware costs push providers toward shared cloud capacity, while regulated buyers want local, on-premises control, which explains why that deployment mode grows fastest.
Regional Analysis
North America leads the Agentic AI Managed Services Market with a 38.7% share and USD 0.7 billion in revenue. The IEA projects US data centre electricity use will rise by about 240 TWh, or 130%, from 2024 levels by 2030, which signals fast growth in AI workloads needing managed support. The region also hosts major platform vendors such as ServiceNow, UiPath, Pegasystems, Appian, and Automation Anywhere, and UiPath earned 44% of its fiscal 2025 revenue in the United States.
Asia Pacific is the fastest-growing region. The IEA projects China’s data centre power use will grow by about 175 TWh, or 170%, by 2030, and Japan’s by over 80%. India supplies a large pool of IT services talent, South Korea and Australia add cloud demand from finance and telecom firms, and manufacturers across the region test agents on the factory floor.
Europe holds the second largest position, led by Germany, France, and the UK. The IEA expects European data centre power use to grow by about 45 TWh, or 70%, by 2030. Strict data and AI rules push firms toward partners who can document agent decisions and keep data in the region. Germany’s Cognigy shows local depth in conversational agents, while Spain and Italy add demand from banks and telecom operators.
Key Regions and Countries
North America
- US
- Canada
Europe
- Germany
- France
- The UK
- Spain
- Italy
- Rest of Europe
Asia Pacific
- China
- Japan
- South Korea
- India
- Australia
- Rest of APAC
Latin America
- Brazil
- Mexico
- Rest of Latin America
Middle East and Africa
- GCC
- South Africa
- Rest of MEA
Market Dynamics
Drivers
| Driver | (~) % Impact on CAGR Forecast | Geographic Relevance | Impact Timeline |
|---|---|---|---|
| Enterprise agent platform commercialization | +1.8% | Global; North America and Europe first | Short term (2 years or less) |
| Installed enterprise AI adoption | +1.2% | OECD economies; digitally mature enterprises | Short term (2 years or less) |
| Consumption-based procurement flexibility | +0.9% | Global cloud-service markets | Short term (2 years or less) |
| Action-enabled customer service workflows | +0.7% | Global; service-intensive industries | Short term (2 years or less) |
| Test-verifiable software maintenance automation | +0.6% | North America, Europe and India | Medium term (2 to 4 years) |
Enterprise agent platform commercialization
Commercial agent platforms are moving managed-service providers from project-based chatbot implementation toward recurring deployment, orchestration, and operational-support contracts. Microsoft announced autonomous-agent public preview on 21 October 2024, connecting agents to enterprise records and business processes.
These milestones create deployable infrastructure rather than hypothetical demand. Providers can monetize integration, monitoring, and exception handling throughout the customer lifecycle. The table’s contributions are analyst-estimated percentage-point sensitivities to the user-supplied 2026 baseline CAGR of 44%, not institution-published forecasts.
Across all sections, positive sensitivities total 9.0 percentage points and negative sensitivities total 7.4 percentage points. This gives illustrative all-positive and all-negative bounds of 53.0% and 36.6%, respectively. These are alternative stress cases, not adjustments to add mechanically to a baseline that already incorporates prevailing conditions.
Restraints
| Restraint | (~) % Impact on CAGR Forecast | Geographic Relevance | Impact Timeline |
|---|---|---|---|
| Prohibited-use deployment exclusions | -1.2% | European Union; providers serving EU customers | Short term (2 years or less) |
| Unresolved personal-data processing legality | -1.0% | European Economic Area; cross-border processors | Short term (2 years or less) |
| Unavailable production-system access rights | -0.8% | Global; proprietary enterprise environments | Short term (2 years or less) |
| Unfunded deployment purchase commitments | -0.6% | Global; budget-constrained customers | Short term (2 years or less) |
| Non-delegable customer approval mandates | -0.5% | Global; restricted transaction workflows | Medium term (2 to 4 years) |
Prohibited-use deployment exclusions
Prohibited-use restrictions remove specific agent applications from sale rather than merely increasing delivery complexity. The European Commission’s guidance, published on 4 February 2025, identifies harmful manipulation, social scoring, and certain real-time remote biometric identification practices as prohibited categories.
The quantitative bottleneck is therefore the complete exclusion of an affected, legally prohibited workflow, not a blanket prohibition on enterprise agents. The analyst-estimated -1.2 percentage-point sensitivity assumes such workflows remain a limited portion of managed-service demand.
Challenges
| Challenge | (~) % CAGR Friction Drag | Geographic Relevance | Mitigation Horizon |
|---|---|---|---|
| Multi-agent inference cost amplification | -1.3% | Global; reasoning-intensive managed workloads | Short term (2 years or less) |
| Compounding execution error exposure | -0.7% | Global; long-running autonomous workflows | Medium term (2 to 4 years) |
| Legacy workflow integration complexity | -0.5% | Global; heterogeneous enterprise estates | Medium term (2 to 4 years) |
| Agent tool-interface engineering burden | -0.4% | Global; custom operational deployments | Medium term (2 to 4 years) |
| Framework abstraction debugging overhead | -0.4% | Global; framework-dependent service providers | Short term (2 years or less) |
Multi-agent inference cost amplification
Dynamic delegation creates a structural cost vulnerability because each additional agent can expand context, tool calls, and reasoning consumption. Anthropic’s engineering disclosure, dated 13 June 2025, reports approximately 4× chat token consumption for agents and 15× for multi-agent systems.
According to Anthropic, token usage explained 80% of performance variance in its research evaluation. Anthropic also reported a 90.2% improvement over its single-agent comparator on its internal research evaluation, which illustrates the quality-cost trade-off rather than an industry-wide productivity guarantee.
These token multipliers are not equivalent to total service-cost multipliers. They do, however, make unrestricted usage hazardous under fixed-fee contracts and support an analyst-estimated -1.3 percentage-point growth friction. Providers must therefore price workload complexity, cap unnecessary delegation, and measure cost per completed task.
Opportunities
| Opportunity | (~) % Potential CAGR Upside | Geographic Relevance | Execution Window |
|---|---|---|---|
| Packaged SME agent operations | +1.3% | G7 and wider OECD small-business markets | Medium term (2 to 4 years) |
| Sector-specific managed process bundles | +0.9% | Global; underserved specialist industries | Medium term (2 to 4 years) |
| Agent-services acquisition roll-ups | +0.6% | North America and Europe | Medium term (2 to 4 years) |
| White-label distribution through intermediaries | +0.6% | Global; fragmented business-service channels | Medium term (2 to 4 years) |
| Managed physical-world agent coordination | +0.4% | Industrial Asia, Europe and North America | Long term (4 years or more) |
Packaged SME agent operations
Packaged small-business operations represent future white space rather than an established growth driver. They require deliberate conversion of non-adopters into customers through standardized onboarding and externally managed operations. The OECD’s SME adoption analysis reports broad enterprise AI use rising from 5.6% in 2020 to 14% in 2024.
According to the same analysis, adoption reached approximately 40% among firms with at least 250 employees. Only 11.9% of firms with 10–49 employees had adopted AI, leaving a calculated 28.1 percentage-point adoption gap. These figures concern AI generally, not agentic managed services, and they establish a prospecting pool rather than guaranteed conversion.
In an illustrative analyst operating model, reusable packages reduce onboarding labor by 20%. If onboarding represents 25% of first-year delivery cost, total delivery cost falls 5%. At an assumed initial delivery-cost-to-revenue ratio of 60%, this translates into approximately 3 percentage points of gross-margin expansion.
These execution assumptions, not OECD estimates, support a conditional market-growth upside of +1.3 percentage points. Capture depends on repeatable deployment and economical customer support.
Key Players Analysis
ServiceNow leads Tier 1 by scale. It reported total revenue of USD 13.28 billion in 2025, up 21%, with subscription revenue of USD 12.88 billion. ServiceNow also spends heavily on acquisitions. It bought Moveworks for USD 2.85 billion to add AI assistants and enterprise search. It then closed the Armis deal for USD 7.75 billion in cash to extend its AI platform into connected asset security.
Pegasystems ranks next by revenue, with USD 1.75 billion in 2025, up 17%. Its annual contract value rose to USD 1.61 billion, and Pega Cloud contract value grew 33%. UiPath also sits in Tier 1. It earned USD 1.43 billion in fiscal 2025 revenue, up 9%, and its annual recurring revenue reached USD 1.67 billion.
UiPath raised R&D spending by USD 48.6 million, or 15%, during that year. In February 2026, it bought WorkFusion to add AI agents for financial crime compliance. Appian leads the challengers with USD 726.9 million in 2025 revenue, up 18%, and cloud subscription revenue of USD 437.4 million. Appian also reached a GAAP operating profit of USD 0.6 million, up from a USD 60.9 million loss in 2024.
Specialist vendors make up the rest of Tier 2. NiCE paid about USD 955 million for Cognigy, which earned about USD 37 million in revenue in 2024. Automation Anywhere bought Aisera to add self-service agents for IT, HR, and customer service. Kore.ai secured a growth investment led by AllianceBernstein in January 2026.
Top Key Players in the Market
- UiPath, Inc.
- Automation Anywhere, Inc.
- Pegasystems Inc.
- Appian Corporation
- Celonis SE
- ServiceNow, Inc.
- SS&C Technologies Holdings, Inc.
- Amelia US LLC
- Aisera, Inc.
- Moveworks, Inc.
- Kore.ai, Inc.
- Cognigy GmbH
Recent Developments
- In April 2026, ServiceNow completed its acquisition of Armis for about USD 7.75 billion in cash, paid with cash on hand and debt, to extend AI governance into IT, OT, IoT, and medical device environments. ServiceNow signed a definitive agreement to acquire Moveworks for USD 2.85 billion in cash and stock to bring agentic AI assistants to every employee.
- In September 2025, NiCE closed its Cognigy acquisition after regulatory approval and opened Cognigy’s agentic AI to a network of more than 25,000 existing NiCE customers. NiCE agreed to acquire Cognigy in a deal worth about USD 955 million, including a USD 50 million time-bound holdback.
Report Scope
| Report Features | Description |
|---|---|
| Market Value (2025) | USD 1.8 billion |
| Forecast Revenue (2035) | USD 70.3 billion |
| CAGR (2026-2035) | 44.7% |
| Base Year for Estimation | 2025 |
| Historic Period | 2020-2024 |
| Forecast Period | 2026-2035 |
| Report Coverage | Revenue Forecast, Market Dynamics, Competitive Landscape, Recent Developments |
| Segments Covered | By Service Type (Agent Deployment and Integration Services, Agent Governance and Compliance Services, Agent Monitoring and Tracking Services, Agent Versioning and Lifecycle Management Services, Other); By Deployment Mode (Cloud, On-Premises); By End User Industry (BFSI, Healthcare and Life Sciences, Retail and E-Commerce, Manufacturing, Media and Entertainment, IT and Telecommunication, Government and Public Sector, Other) |
| Regional Analysis | North America – US, Canada; Europe – Germany, France, The UK, Spain, Italy, Rest of Europe; Asia Pacific – China, Japan, South Korea, India, Australia, Singapore, Rest of APAC; Latin America – Brazil, Mexico, Rest of Latin America; Middle East & Africa – GCC, South Africa, Rest of MEA |
| Competitive Landscape | UiPath, Inc., Automation Anywhere, Inc., Pegasystems Inc., Appian Corporation, Celonis SE, ServiceNow, Inc., SS&C Technologies Holdings, Inc., Amelia US LLC, Aisera, Inc., Moveworks, Inc., Kore.ai, Inc., Cognigy GmbH |
| Customization Scope | We will provide customization for segments and region/country levels. Additional customization can be done based on requirements. |
| Purchase Options | We have three licenses to opt for: Single User License, Multi-User License (Up to 5 Users), Corporate Use License (Unlimited Users and Printable PDF) |





























