


Report Overview
In 2025, the Global Optical Coating Market was valued at USD 15.4 billion, and between 2026 and 2035, this market is estimated to register a CAGR of 5.5%, reaching about USD 26.3 billion by 2035.
The global optical coating market is characterized by diverse product types, including anti-reflective, reflective, filter, conductive, and electrochromic coatings, which find applications across consumer electronics, solar, medical, architecture, aerospace, automotive, and telecommunications. Rapid adoption of smartphones, tablets, and wearable devices has increased demand for coatings that enhance display clarity, touch sensitivity, and durability, while solar photovoltaic installations rely on anti-reflective and self-cleaning coatings to improve energy conversion efficiency.
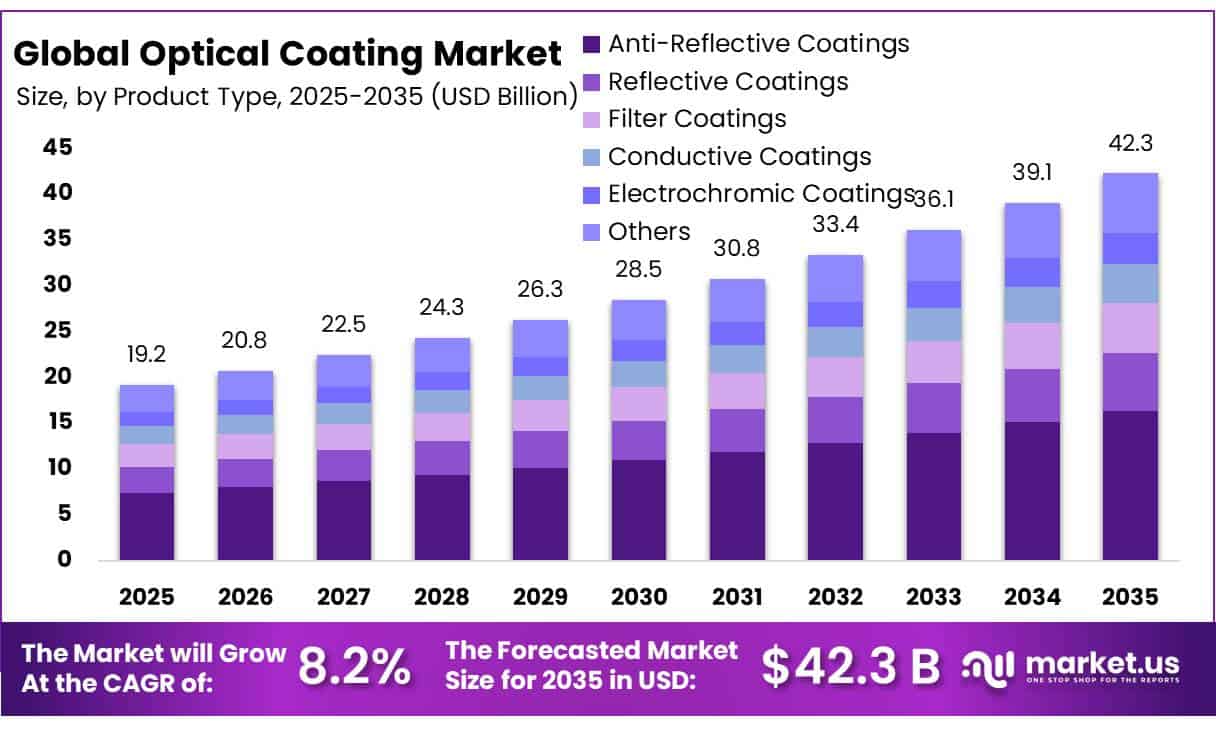
Technological sophistication, including multi-layer deposition and electrochromic or hybrid coatings, is central to product differentiation, although high production costs and material precision requirements present operational challenges. The Asia-Pacific region plays a dominant role, driven by large-scale electronics and solar manufacturing.
Manufacturers focus on innovation, process optimization, and integration of multifunctional coatings to maintain a competitive edge. Supply chain sensitivities, particularly to rare-earth materials, and geopolitical factors also influence production dynamics, emphasizing the strategic importance of resilient operations and technological advancement.
Key Takeaways
- The global optical coating market was valued at USD 15.4 billion in 2025.
- The global market is projected to grow at a CAGR of 5.5% and is estimated to reach USD 26.3 billion by 2035.
- On the basis of product type, anti-reflective optical coatings dominated the market, constituting 38.7% of the total market share.
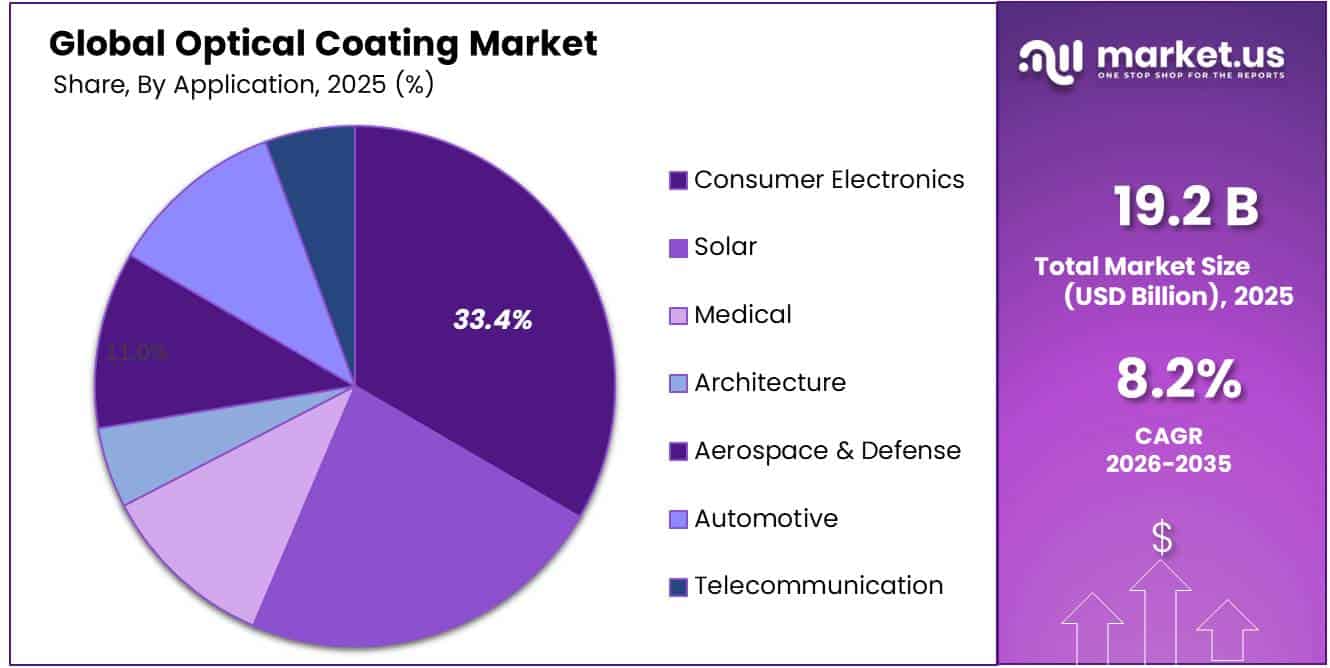
- Among the applications, consumer electronics held a major share in the optical coating market, 33.4% of the market share.
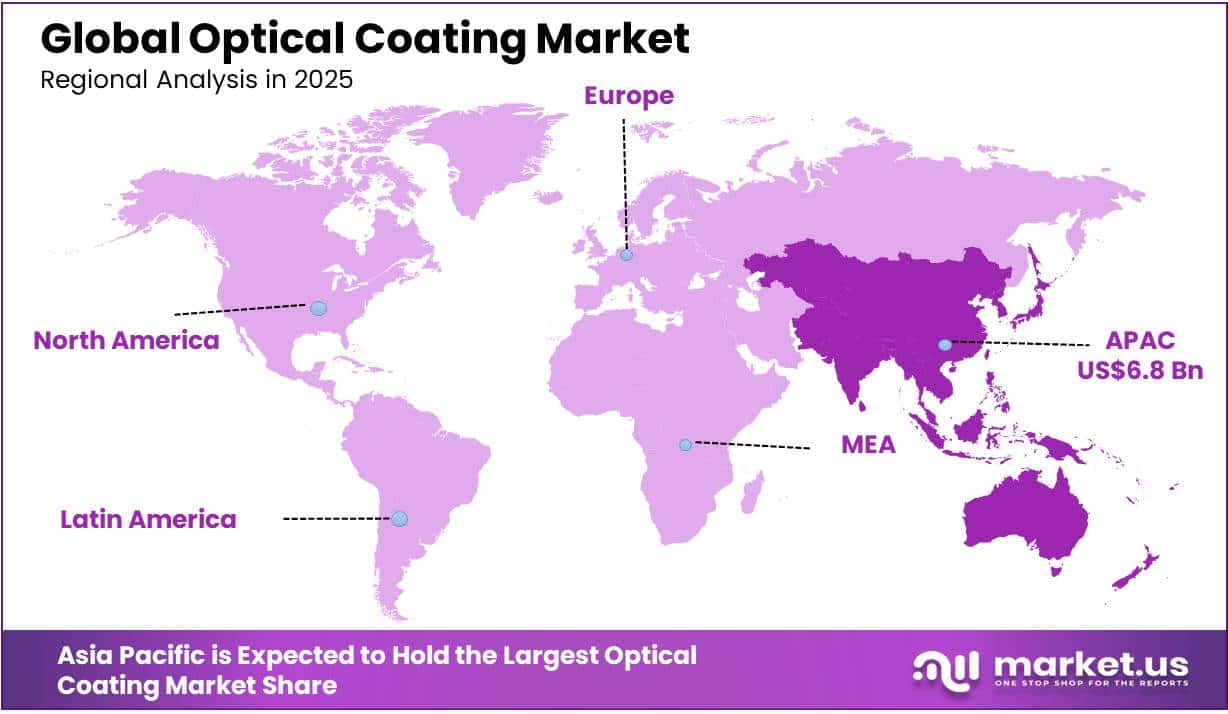
- In 2025, the Asia Pacific was the most dominant region in the optical coating market, accounting for 35.5% of the total global consumption.
Product Type Analysis
Anti-Reflective Optical Coatings are a Prominent Segment in the Market.
Anti-reflective coatings represent the largest segment in the optical coating market, accounting for 38.7% of the total share. These coatings are widely employed to minimize surface reflections, enhance light transmission, and improve optical clarity across a variety of applications. In consumer electronics, they are applied to smartphones, tablets, and wearable displays to reduce glare and improve visibility under diverse lighting conditions. In solar photovoltaics, anti-reflective coatings increase energy conversion efficiency by allowing more light to penetrate the glass surface.
Medical imaging devices and optical lenses also rely on these coatings to enhance image quality and operational precision. The segment’s dominance is driven by its broad applicability, technological maturity, and critical role in improving device performance, durability, and user experience, making it a key focus area for manufacturers seeking to maintain competitive advantage in high-volume and high-performance applications.
Application Analysis
Consumer Electronics Held a Major Share of the Optical Coating Market.
Consumer electronics account for the largest share of the optical coating market, representing 33.4% of total applications. The segment is driven by the widespread adoption of smartphones, tablets, laptops, and wearable devices, where optical coatings play a critical role in enhancing display performance, touch sensitivity, and durability. Anti-reflective and conductive coatings reduce glare, improve screen clarity, and ensure reliable touch functionality, while protective coatings enhance scratch and abrasion resistance.
Additionally, multifunctional coatings, including hybrid reflective-conductive and electrochromic layers, are increasingly integrated into advanced devices to enable energy efficiency and adaptive optical properties. The segment’s dominance reflects the high penetration of consumer electronics globally and the essential role of optical coatings in improving user experience, operational reliability, and device longevity.
Key Market Segments
By Product Type
- Anti-Reflective Coatings
- Reflective Coatings
- Filter Coatings
- Conductive Coatings
- Electrochromic Coatings
- Others
By Application
- Consumer Electronics
- Solar
- Medical
- Architecture
- Aerospace & Defense
- Automotive
- Telecommunication
- Others
Driver Analysis
Semiconductor Optics Build-Out
Semiconductor capital intensity is the strongest optical-coating driver because every lithography, inspection and metrology generation increases the count and performance value of multilayer mirrors, beam splitters, narrow-band filters, polarizers and anti-reflection films exposed to deep-UV or extreme-UV radiation: SEMI’s current outlook places worldwide 300-mm fab-equipment spending at approximately US$116 billion in 2026, up 9% from US$107 billion in 2025, and US$374 billion cumulatively during 2026–2028. ASML’s 2025 sales rose 15.6% to €32.7 billion; EUV demand supported 48 system sales, including four 0.55-NA High-NA systems, while service and field-option revenue increased 26.2% to €8.2 billion as NXE upgrades shifted more value into the installed base.
The coating economics are nonlinear rather than wafer-volume proportional: EUV reflective stacks must control layer thickness at near-atomic precision and maximize throughput across many reflective surfaces, whereas DUV platforms require low absorption, high laser-damage resistance and long-life contamination control. A modeled 2026 coating-accessible value of only 0.35–0.60% of the US$116 billion equipment envelope implies US$0.41–0.70 billion of annual coated-optics content across lithography, inspection and metrology before replacement; a 9% equipment increase alone adds roughly US$37–63 million.
Qualification cycles of 12–36 months and high switching costs favor co-development, proprietary recipes and lifecycle recoating over spot-priced deposition, while the 26.2% expansion in ASML’s installed-base business signals recurring aftermarket pull. This raises utilization for ion-beam sputtering and atomic-scale metrology, supports premium gross margins and justifies an estimated +2.1-percentage-point CAGR contribution, concentrated in Taiwan, Korea, China, the U.S., Japan and the EU over the next two years.
Drivers Impact Analysis
| Driver | (~) % Impact on CAGR Forecast | Geographic Relevance | Impact Timeline |
|---|---|---|---|
| Semiconductor optics build-out | +2.1 pp | Taiwan; Korea; China; U.S.; Japan; EU | Short term (≤2 years) |
| Solar coating scale-up | +1.6 pp | China core; India; U.S.; EU; MENA | Medium term (2–4 years) |
| ADAS and LiDAR proliferation | +1.4 pp | China core; EU; North America; Japan | Short term (≤2 years) |
| Smart-glasses optical stacks | +1.1 pp | North America; EU; China; Japan; Korea | Medium term (2–4 years) |
| Space and defense optics | +0.9 pp | U.S. core; EU; China; India; Japan | Long term (≥4 years) |
| Medical photonics expansion | +0.7 pp | North America; EU; Japan; China | Medium term (2–4 years) |
Restraint Analysis
Critical-Material Export Controls
Export controls on germanium, gallium, antimony, rare earths and superhard materials create the most immediate restraint because optical-coating suppliers cannot fully substitute infrared substrates, evaporation targets or high-index layers without redesigning the complete spectral stack: China imposed worldwide licensing on gallium and germanium in 2023, restricted antimony in September 2024 and, in December 2024, prohibited relevant dual-use exports to U.S. military users while in principle refusing gallium, germanium and antimony shipments to the United States. Although part of the country-specific prohibition was suspended from 9 November 2025 through 27 November 2026, the military end-use ban remains and the temporary relief itself creates a procurement cliff rather than durable availability.
USGS data quantify the shock: Chinese germanium-metal exports through September fell from 36,656 kg in 2023 to 18,787 kg in 2024 and 7,520 kg in 2025; estimated U.S. germanium-metal imports dropped 67% in 2025, while European 99.999%-purity germanium rose from US$3,150/kg in January to US$5,380/kg in October, a 71% increase. In a modeled infrared-coating contract using 25 kg of germanium-related material annually, that move raises input spend by about US$55,750 before scrap, working capital and safety stock; holding 12 months rather than three months of inventory ties up a further US$100,000-plus at October pricing.
The business impact is direct: quotations shorten from 90 to 30 days, fixed-price defense contracts accumulate unfavorable purchase-price variance, low-volume infrared jobs are deferred, and requalification of alternative chalcogenide, silicon or coating designs can consume 12–24 months. Dual-region target sourcing, closed-loop recovery, customer-owned strategic stock and contractual mineral-index pass-through can contain losses, but cannot restore unrestricted supply; the resulting order deferrals and margin-protection pricing justify an estimated -1.7-percentage-point CAGR deduction through the next two years across U.S., European, Japanese and Korean chains dependent on Chinese processing.
Restraint Impact Analysis
| Restraint | (~) % Impact on CAGR Forecast | Geographic Relevance | Impact Timeline |
|---|---|---|---|
| Critical-Material Export Controls | -1.7% | U.S.; EU; Japan; Korea; China-linked chains | Short term (≤2 years) |
| Capital-Intensive Precision Yield | -1.4% | Global; U.S.; EU; Japan; APAC fabs | Long term (≥4 years) |
| Tariff-Driven Supply Fragmentation | -1.1% | U.S.–China core; EU; Southeast Asia | Short term (≤2 years) |
| Qualification and Switching Lock-In | -0.9% | Semiconductor; auto; medical; aerospace hubs | Medium term (2–4 years) |
| Solar Price Compression | -0.8% | China core; India; EU; U.S. | Medium term (2–4 years) |
| Fluorochemical Reformulation Risk | -0.6% | EU core; global exporters | Medium term (2–4 years) |
Opportunity Analysis
Wafer-Scale Meta-Optics
The technical bridge now exists: a 2024 industry roadmap identified nanoimprint lithography, deep-UV lithography and nanotransfer printing as the leading scale-up routes; reported processes achieved sub-100 nm patterns, full-wafer soft imprinting and a 4-inch mid-IR metasurface using ALD alumina, germanium/aluminium deposition and DUV patterning, while a 2025–2026 review positioned NIL as a repeatable, low-cost replication process but noted that conventional imprint resin’s refractive index of about 1.5 requires high-index ALD skins or nanoparticle-loaded resin.
That process adjacency allows an ion-beam-sputtering or ALD coater to move upstream into master replication, conformal high-index deposition and wafer-level metrology rather than compete only on coating price. An illustrative plant model using two 200-mm lines, 30 wafers/hour, 70% utilization and 6,000 operating hours produces 252,000 wafers annually; at 1,000 saleable devices per wafer, 80% yield and US$0.12–0.25 incremental coating/pattern value per device, annual addressable revenue is US$24–50 million, versus roughly US$5–10 million if the same assets supply only commodity blanket films.
Commercial capture requires a three-part go-to-market—joint development agreements with sensor OEMs, licensing of imprint masters by application, and volume contracts with minimum wafer commitments—with US$8–15 million estimated pilot CapEx, 18–30 months of qualification and a target gross margin of 40–50% once utilization exceeds 65%. The opportunity is not yet embedded in baseline growth because visible-spectrum efficiency, chromatic aberration, master durability and wafer-level yield remain unresolved at mass volume; however, winning even three programs of 50 million units each at US$0.15 coating content creates US$22.5 million of incremental annual sales, supporting a modeled +1.8-percentage-point CAGR upside over 2–4 years in U.S., European and Northeast Asian semiconductor-optics clusters.
Opportunity Impact Analysis
| Opportunity | (~) % Potential CAGR Upside | Geographic Relevance | Execution Window |
|---|---|---|---|
| Wafer-Scale Meta-Optics | +1.8% | U.S.; EU; Japan; Korea; Taiwan | Medium term (2–4 years) |
| AI Photonics Co-Packaging | +1.5% | U.S. core; Taiwan; Korea; EU | Short term (≤2 years) |
| Smart Cooling Surfaces | +1.2% | India; GCC; Southeast Asia; U.S.; EU | Medium term (2–4 years) |
| Quantum-Grade Optics | +0.9% | U.S.; EU; India; Japan | Medium term (2–4 years) |
| Digital Recipe Licensing | +0.8% | Global precision-coating hubs | Short term (≤2 years) |
| Circular Recoating Services | +0.6% | EU; U.S.; Japan; aerospace hubs | Short term (≤2 years) |
Challenges Analysis
Precision Talent Deficit
The optical-coating workforce gap is a continuous capacity-utilization problem rather than a sales-blocking restraint: vacuum chambers can remain installed and orders can continue, but too few technicians can tune reactive gases, diagnose spectral drift, execute witness-sample metrology and recover a process after target or shield changes. A U.S. photonics workforce study based on more than 50 company interviews projected middle- and lower-skilled employment from roughly 58,000 to nearly 85,000, more than 100,000 cumulative openings, 42,000 middle-skilled openings and 61,000 lower-skilled openings over the study horizon; it translates to about 9,100 hires annually, including 2,200 engineering technicians, and indicates a need for approximately 140 engineering-technician and more than 180 certificate programmes.
A broader 2026 microelectronics analysis estimates that technicians represent 39% of projected unfilled jobs in the relevant electronics workforce, underscoring that deposition expansion can outrun local labor pipelines. For a modeled 10-chamber plant requiring two qualified operators per shift across three shifts plus process, maintenance and metrology coverage, a 12% vacancy rate removes about eight of 65 technical roles; if each missing role reduces productive chamber availability by only 2.5 hours weekly, the plant loses roughly 1,000 chamber-hours annually, equivalent to US$2.0–4.0 million of forgone output at US$2,000–4,000 value added per chamber-hour.
Overtime at 1.5-times base pay, 6–12-month proficiency curves and engineer substitution raise conversion cost while increasing recipe drift and delayed preventive maintenance; the resulting bottleneck is especially acute in U.S., European, Japanese and Taiwanese clusters competing simultaneously with semiconductor and integrated-photonics employers. Mitigation requires paid two-year technician pipelines, chamber-vendor certifications, cross-training matrices with at least two qualified operators per critical recipe, remote process support and operator-assist automation; because practical tacit knowledge cannot be replaced by classroom supply alone, normalization remains a four-plus-year task and justifies an estimated -1.3-percentage-point friction drag.
Challenges Impact Analysis
| Challenge | (~) % CAGR Friction Drag | Geographic Relevance | Mitigation Horizon |
|---|---|---|---|
| Precision Talent Deficit | -1.3% | U.S.; EU; Japan; Taiwan | Long term (≥4 years) |
| Batch Yield Variability | -1.2% | Global coating hubs | Medium term (2–4 years) |
| Metrology Standard Fragmentation | -0.9% | U.S.; EU; defense corridors | Medium term (2–4 years) |
| Recipe Transfer Complexity | -0.8% | U.S.–EU–APAC networks | Long term (≥4 years) |
| Logistics Volatility Exposure | -0.7% | Asia–EU; GCC; U.S. importers | Short term (≤2 years) |
| Energy-Precursor Efficiency Gap | -0.6% | EU core; Japan; Korea; global fabs | Medium term (2–4 years) |
Geopolitical Impact Analysis
Geopolitical Dynamics and Supply Chain Vulnerabilities in Optical Coating Production.
Global supply chains for optical coatings have been affected by geopolitical tensions, particularly in the context of export controls and trade restrictions on critical materials. According to the U.S. Bureau of Industry and Security (BIS), restrictions on the export of certain high-refractive-index optical materials to selected countries were implemented in 2022, limiting the availability of titanium dioxide (TiO₂) and specialized rare-earth oxides used in multi-layer dielectric coatings.
The U.S. Geological Survey (USGS) reported that China accounted for over 60% of global rare-earth oxide production, highlighting the vulnerability of global supply chains to regional policy shifts. These materials are critical for anti-reflective, conductive, and filter coatings, with deposition processes requiring consistent material purity to maintain layer uniformity within ±2 nanometers.
Additionally, delays in the shipment of vacuum deposition equipment and precursor chemicals due to export licensing requirements have extended production lead times by 4-8 weeks for some manufacturers. These factors underscore the sensitivity of optical coating manufacturing to geopolitical dynamics affecting raw material sourcing and technology flows.
Regional Analysis
Asia Pacific Held the Largest Share of the Global Optical Coating Market.
In 2025, the Asia Pacific dominated the global optical coating market, holding about 35.5% of the total global consumption. The region has emerged as the predominant center for optical coating demand, driven by large-scale production and adoption of consumer electronics, solar panels, and automotive displays. According to the Ministry of Commerce, People’s Republic of China, the country exported over 1.3 billion mobile phones and tablets in 2022, many incorporating anti-reflective, conductive, and protective coatings in displays and touchscreens.
Similarly, India’s Ministry of New and Renewable Energy reported that the nation’s installed solar photovoltaic capacity exceeded 63 GW by the end of 2022, with anti-reflective and self-cleaning coatings applied to glass modules to optimize energy conversion. Over 70% of Japan’s LCD and OLED panel production utilizes multi-layer optical coatings for enhanced clarity and durability. These high-volume manufacturing and technology-intensive applications underpin the Asia-Pacific region’s leading role in optical coatings deployment, highlighting its strategic significance in global supply chains.
Key Regions and Countries Covered
- North America
- The US
- Canada
- Europe
- Germany
- France
- The UK
- Spain
- Italy
- Russia & CIS
- Rest of Europe
- APAC
- China
- Japan
- South Korea
- India
- ASEAN
- Rest of APAC
- Latin America
- Brazil
- Mexico
- Rest of Latin America
- Middle East & Africa
- GCC
- South Africa
- Rest of MEA
Key Players Analysis
Manufacturers of optical coatings concentrate on technological innovation and process optimization to strengthen their competitive positioning. They invest in advanced deposition techniques, including physical and chemical vapor deposition, to achieve precise multi-layer coatings with nanometer-level uniformity. Integration of multifunctional coatings, such as electrochromic and hybrid reflective-conductive layers, allows firms to differentiate products across consumer electronics, solar, and automotive applications.
Operational efficiency is enhanced through automation of coating lines and real-time quality monitoring, reducing material waste and improving yield consistency. Additionally, partnerships with equipment suppliers and research institutions support rapid adoption of new materials and sustainable processes, such as low-emission precursors and energy-efficient coating methods, enabling manufacturers to deliver technologically advanced, reliable solutions while maintaining production flexibility.
The Major Players in The Industry
- Alluxa, Inc.
- Cascade Optical Corporation
- Chroma Technology Crop.
- Inrad Optics
- Optical Coatings Japan
- PPG Industries Inc.
- Viavi Solutions
- Schott AG
- Abrisa Technology
- Berliner Glas
- Jenoptik
- Safran
- Omega Optical
- Zygo Corporation
- Accurate Optics
- Other Key Players
Key Development
- In January 2026, Ellsworth Adhesives and Surrey NanoSystems partnered to distribute Vantablack 310 and other ultra-black coatings globally, introducing the first Vantablack formula that can be applied in-house using standard spray technology.
- In April 2026, Henkel introduced a high-performance, PFAS- and fluorine-free anti-fingerprint coating portfolio, including Loctite AF 8810 and AF 8812, targeting automotive displays and touchscreens to enhance durability, cleanability, and sustainability while meeting evolving regulatory standards.
Report Scope
| Report Features | Description |
|---|---|
| Market Value (2025) | US$19.2 Bn |
| Forecast Revenue (2035) | US$42.3 Bn |
| CAGR (2026-2035) | 8.2% |
| Base Year for Estimation | 2025 |
| Historic Period | 2020-2024 |
| Forecast Period | 2026-2035 |
| Report Coverage | Revenue Forecast, Market Dynamics, Competitive Landscape, Recent Developments |
| Segments Covered | By Product Type (Anti-Reflective Coatings, Reflective Coatings, Filter Coatings, Conductive Coatings, Electrochromic Coatings, and Others), By Application (Consumer Electronics, Solar, Medical, Architecture, Aerospace & Defense, Automotive, Telecommunication, and Others) |
| Regional Analysis | North America – The US & Canada; Europe – Germany, France, The UK, Spain, Italy, Russia & CIS, Rest of Europe; APAC– China, Japan, South Korea, India, ASEAN & Rest of APAC; Latin America– Brazil, Mexico & Rest of Latin America; Middle East & Africa– GCC, South Africa, & Rest of MEA |
| Competitive Landscape | Alluxa, Inc., Cascade Optical Corporation, Chroma Technology Corp., Inrad Optics, Optical Coatings Japan, PPG Industries Inc., Viavi Solutions, Schott AG, Abrisa Technology, Berliner Glas, Jenoptik, Safran, Omega Optical, Zygo Corporation, Accurate Optics, and Other Players. |
| Customization Scope | Customization for segments, region/country-level will be provided. Moreover, additional customization can be done based on the requirements. |
| Purchase Options | We have three licenses to opt for: Single User License, Multi-User License (Up to 5 Users), Corporate Use License (Unlimited Users and Printable PDF) |





































