


Report Overview
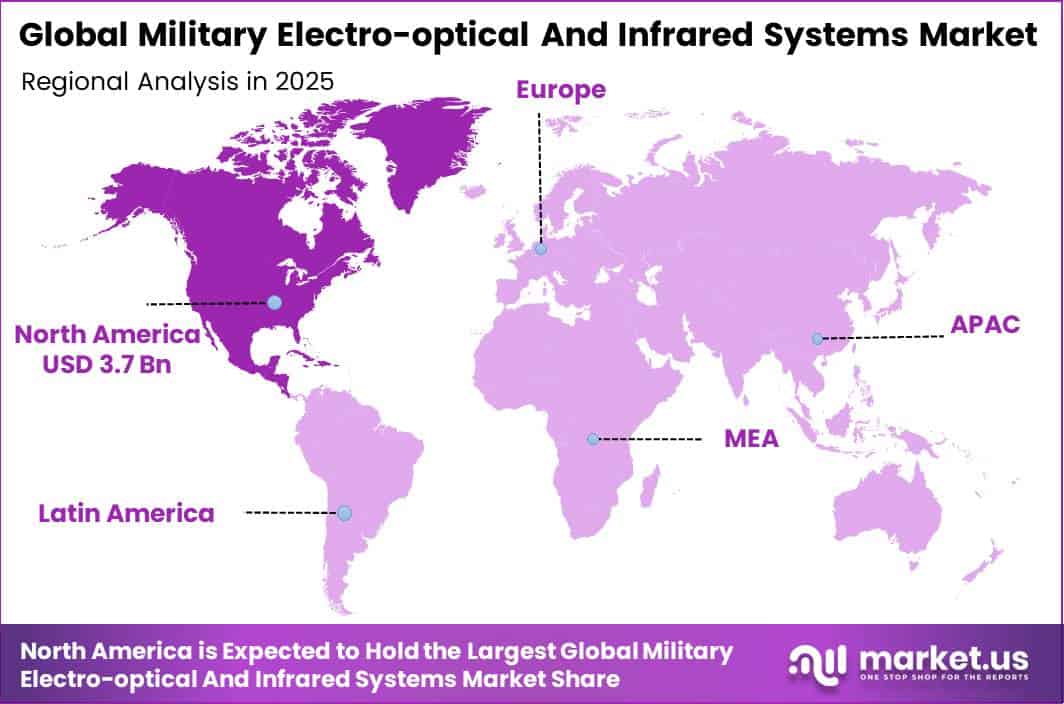
In 2025, the Global Military Electro-optical And Infrared Systems Market was valued at USD 9.9 billion. The market is projected to grow at a CAGR of 5.3% during 2026–2035, reaching approximately USD 16.5 billion by 2035. North America dominated the global market in 2025, accounting for more than 37% of the total market share and generating approximately USD 3.7 billion in revenue.
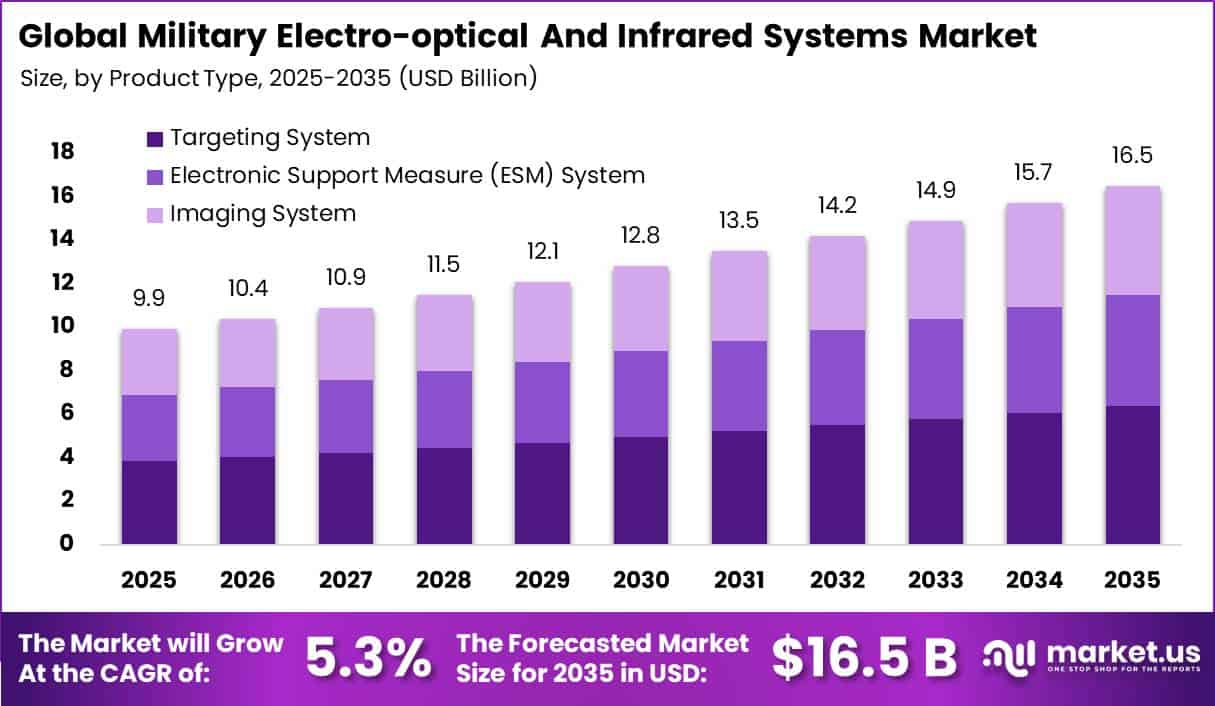
Growth is supported by higher defence spending and increasing demand for stronger battlefield awareness. EO/IR systems combine day cameras, thermal imaging, laser systems, and tracking sensors and are widely deployed across drones, aircraft, armoured vehicles, naval platforms, satellites, and fixed surveillance sites.
Global military expenditure reached USD 2.7 trillion in 2024, increasing 9.4% in real terms from 2023 and standing 37% above 2015 levels. Rising investment in intelligence, surveillance, reconnaissance, drone operations, border security, and missile-warning capabilities is therefore supporting demand for advanced thermal cameras, infrared sensors, stabilised imaging payloads, and supporting software.
U.S. military expenditure reached USD 997 billion in 2024, rising 5.7% from 2023 and representing 37% of global military spending and 66% of total NATO expenditure. In FY2025, the U.S. Department of Defense received USD 831.3 billion in discretionary base budget authority, along with USD 156.2 billion in additional mandatory defence funding.
The U.S. Space Force also planned USD 826.3 million in FY2025 for sensing capabilities, strengthening demand for EO/IR systems across land, air, sea, space, and border-security operations.
Key Takeaway
- The Global Military Electro-optical And Infrared Systems Market was valued at USD 9.9 billion in 2025 and is projected to reach USD 16.5 billion by 2035, growing at a CAGR of 5.3%.
- The targeting system segment was dominated by system type, with a 38.7% share.
- The airborne segment was led by platform with a 62.1% share.
- The infrared segment was dominated by technology with a 41.3% share.
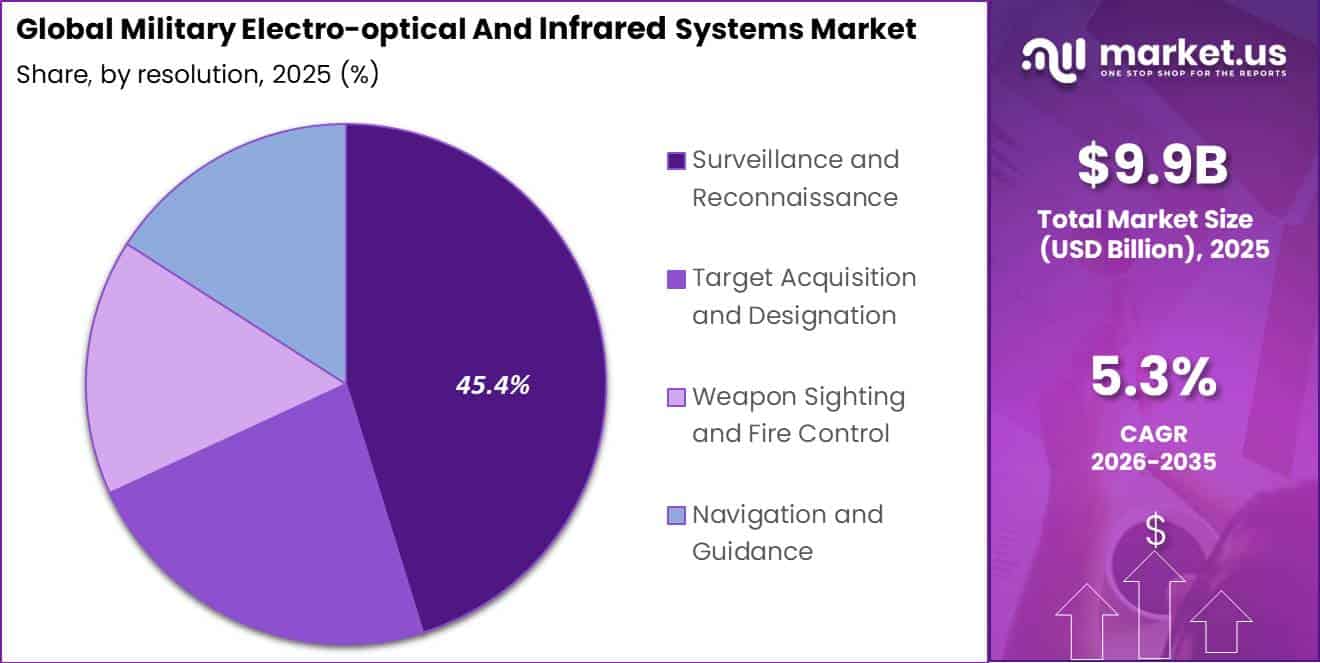
- Surveillance and reconnaissance was the leading application, holding a 45.4% share.
- North America led the market in 2025 with a 37% share and approximately USD 3.7 billion in revenue.
By System Type
The Targeting System segment held a dominant position with a 38.7% share, supported by its important role in converting EO/IR imaging into accurate weapon-engagement capability. These systems combine infrared imaging, visible-light cameras, laser rangefinders, laser designators, automatic tracking, and target-coordinate tools.
Demand is also supported by continued investment in advanced sensing and laser-based target location. The U.S. Army’s FY2025 research budget includes work on improved laser rangefinding, target designation, target marking, passive target-acquisition methods, and infrared, near-infrared, ultraviolet, and visible-spectrum imaging technologies.
The same budget allocates USD 49.6 million for lethal-munition prototyping, technology design, component testing, and evaluation. Growing use of precision-guided weapons, armed drones, close-air-support missions, and long-range engagements is therefore strengthening demand for reliable targeting systems.
By Platform
The Airborne segment held a dominant market position with a 62.1% share, supported by the growing use of military aircraft and uncrewed aerial systems fitted with advanced EO/IR payloads. These platforms can monitor large areas while keeping operators away from immediate threats. The U.S. Army’s FY2025 budget requested USD 149.1 million for 47 Future UAS assets, including 7 Future Tactical UAS systems valued at USD 129.0 million.
Each system includes 6 air vehicles with payloads and 6 control stations, representing 42 aircraft equipped with sensor payloads. The Army states that these systems can provide 24-hour coverage across 2 areas at the same time, while each vehicle offers an endurance of 6–10 hours and an operating range of 100–125 km.
Such long-duration missions require EO/IR cameras and infrared sensors for day-and-night surveillance, target identification, and acquisition. The same budget identifies a total requirement of 204 MQ-1C Gray Eagle aircraft, which are designed to carry EO/IR and laser-designator payloads. Expansion of airborne fleets therefore directly supports higher demand for military EO/IR systems.
By Technology
The Infrared segment held a dominant market position with a 41.3% share, mainly because thermal technology can detect heat without depending on visible daylight. Infrared sensors help military forces identify personnel, vehicles, engines, weapon firing points, and other heat sources during night operations, smoke, camouflage, and low-light conditions.
This makes the technology important across tanks, armoured vehicles, aircraft, drones, weapon sights, and perimeter-surveillance systems. Demand is further supported by military vehicle-modernisation programmes. The U.S. Army’s FY2025 procurement plan includes 45 third-generation Forward Looking Infrared (FLIR) Gunner’s Primary Sights and Commander’s Primary Sights for armoured platforms.
These systems support Armored Brigade Combat Team modernisation by improving thermal detection and target identification for vehicle crews. The same budget identifies a cumulative requirement for 679 armoured-platform FLIR systems, creating continued demand for new equipment, upgrades, maintenance, and replacement parts. In addition, the Army allocated USD 7.4 million in FY2025 research funding for the third-generation FLIR B-Kit programme. These investments support the continued importance of infrared technology in military EO/IR systems.
By Application
The Surveillance and Reconnaissance segment held a dominant market position with a 45.4% share, supported by the growing use of EO/IR systems for continuous threat detection, tracking, and identification. These systems combine visible cameras for detailed daytime imaging with infrared sensors for detecting heat signatures during night and low-visibility conditions.
This makes them important for drones, patrol aircraft, ground surveillance towers, naval platforms, and mobile command systems. U.S. Customs and Border Protection’s Air and Marine Operations operates more than 200 aircraft and over 300 marine vessels, supported by surveillance technologies for border and maritime security.
Its unmanned-aircraft operations completed 2,606 missions and 9,957 flight hours in FY2021, including 2,505 land-border missions requiring persistent monitoring. Demand is also supported by higher investment in unmanned surveillance platforms. The U.S. Army increased funding for small unmanned aerial vehicle research from USD 160.4 million in FY2024 to USD 204.2 million in FY2025, including USD 69.5 million for short-range reconnaissance.
Key Market Segments
By System Type
- Targeting System
- Electronic Support Measure (ESM) System
- Imaging System
By Platform
- Airborne
- Land
- Naval
By Technology
- Infrared
- Laser
- Imaging
By Application
- Surveillance and Reconnaissance
- Target Acquisition and Designation
- Weapon Sighting and Fire Control
- Navigation and Guidance
Geopolitical Impact Analysis
Global trade friction is increasing production costs for military EO/IR system manufacturers by raising the price of semiconductors, infrared detectors, optical materials, and other critical components. The U.S. simple average applied MFN tariff increased from 3.4% in 2023 to 11.2% in 2025, while a 25% ad valorem duty on advanced computing chips and derivatives took effect in January 2026.
This creates direct cost pressure on semiconductor and infrared detector components used in thermal imaging systems. China’s April 2025 export controls on rare earth materials add further supply risk, as these materials account for roughly 40% of permanent-magnet content used in gimbals and stabilised sensor mounts.
Logistics disruption is adding another layer of pressure. Suez Canal tonnage remained around 70% below 2023 levels through May 2025, forcing more vessels to use the longer Cape of Good Hope route. The Shanghai Containerized Freight Index averaged 2,496 points in 2024, increasing 149% year-on-year, while spot freight rates reached approximately USD 3,600 per container in July.
The Strait of Hormuz carries around 11% of global trade and more than one-third of seaborne oil, making any disruption a major risk for fuel, freight, and insurance costs. Together, tariffs, mineral constraints, and shipping disruption are increasing EO/IR component costs, extending delivery times, and putting pressure on manufacturer margins.
Regional Analysis
North America led the Military Electro-optical and Infrared (EO/IR) Systems Market in 2025, accounting for 37% of the global market and generating approximately USD 3.7 billion in revenue. The region’s strong position is supported by a large defence-industrial base, high procurement spending, and continued investment in intelligence, surveillance, reconnaissance, targeting, missile warning, and unmanned systems.
The United States remains the main demand centre, with the Department of Defense requesting USD 961 billion in total FY2026 funding, including USD 384 billion for acquisition activities. The request also included USD 23.2 billion for command, control, communications, computers, and intelligence systems and USD 34.0 billion for space-based systems.
These programmes support demand for thermal imagers, infrared detectors, laser designators, stabilised gimbals, optical sights, and sensor-processing electronics. NATO members also met or exceeded the previous 2% of GDP defence-investment benchmark in 2025, while the alliance plans to raise defence and security-related investment to 5% of GDP by 2035.
Asia Pacific is expected to be the fastest-growing regional market, supported by rising spending on air defence, maritime surveillance, border security, drones, and precision-strike systems. Japan approved a defence budget of JPY 8.7 trillion, or around USD 55 billion, for 2025, including JPY 533 billion for interceptors and mobile reconnaissance radar.
Key Regions and Countries
- North America
- US
- Canada
- Europe
- Germany
- France
- The UK
- Spain
- Italy
- Rest of Europe
- Asia Pacific
- China
- Japan
- South Korea
- India
- Australia
- Rest of APAC
- Latin America
- Brazil
- Mexico
- Rest of Latin America
- Middle East & Africa
- GCC
- South Africa
- Rest of MEA
Market Dynamics
Drivers
| Driver | (~) % CAGR | Geographic Relevance | Impact Timeline |
|---|---|---|---|
| Defence ISR procurement growth | +1.4% | Global | Short term (2 years or less) |
| Airborne drone fleet expansion | +0.9% | North America, Europe, Asia Pacific | Medium term (2 to 4 years) |
| Armoured vehicle sight upgrades | +0.7% | Europe, Middle East | Medium term (2 to 4 years) |
| Space-based missile tracking | +0.6% | North America, Europe | Long term (4 years or more) |
| Maritime border monitoring | +0.4% | Asia Pacific, Middle East | Short term (2 years or less) |
Defence ISR procurement growth
Defence intelligence, surveillance, and reconnaissance procurement is a major growth driver for the military EO/IR market. Global military expenditure reached USD 2.8 trillion in 2025, increasing 2.9% in real terms and marking the 11th consecutive annual rise. Spending was also 41% higher than in 2016, while Europe increased defence expenditure by 14% and Asia and Oceania by 8.1%.
Higher defence budgets are directly supporting demand for infrared sensors, precision optics, laser systems, and mission software. The U.S. Department of Defense’s FY2026 request totaled USD 961 billion, including USD 384 billion for acquisition. This procurement pipeline supports larger EO/IR production contracts, expanded installed-base service revenue, and growing demand for advanced sensor-fusion systems across land, air, naval, and space platforms.
Restraints
| Restraint | (~) % CAGR | Geographic Relevance | Impact Timeline |
|---|---|---|---|
| Export-control licensing barriers | -0.9% | Global | Short term (2 years or less) |
| Restricted defence procurement access | -0.6% | North America, Europe | Medium term (2 to 4 years) |
| High certification costs | -0.4% | Global | Medium term (2 to 4 years) |
| Sanctions-related contract exclusions | -0.3% | Europe, Middle East, Asia Pacific | Short term (2 years or less) |
| Public-budget allocation limits | -0.2% | Latin America, Africa | Long term (4 years or more) |
Export-control licensing barriers
Export-control licensing remains a major restraint for the military EO/IR market because infrared detectors, thermal imaging cores, laser-designation systems, and processing chips often require security approvals before international shipment. More than 50% of a broader group of energy-related minerals are now subject to some form of export control.
China’s restrictions from late 2024 through early 2025 covered several critical minerals, including 7 heavy rare-earth elements. Supply concentration adds further risk, with the top 3 refining countries accounting for around 86% of key-mineral refining in 2024, compared with about 82% in 2020. These controls can delay deliveries, increase inventory and qualification costs, and put pressure on EO/IR manufacturer margins.
Challenges
| Challenge | (~) % CAGR | Geographic Relevance | Mitigation Horizon |
|---|---|---|---|
| Critical mineral supply concentration | -0.8% | Global | Long term (4 years or more) |
| Specialist optics labour scarcity | -0.5% | North America, Europe | Medium term (2 to 4 years) |
| Sensor software integration complexity | -0.4% | Global | Medium term (2 to 4 years) |
| Maritime route volatility | -0.3% | Europe, Middle East, Asia Pacific | Short term (2 years or less) |
| Countermeasure technology evolution | -0.2% | Global | Long term (4 years or more) |
Critical mineral supply concentration
Critical-mineral concentration remains a long-term operational challenge for EO/IR manufacturers because production can continue, but sourcing, qualification, and cost control require constant mitigation. The IEA reports that China leads refining for 19 of 20 strategic minerals and holds an average refining share of around 70%. Between 2020 and 2024, nearly 90% of supply growth for selected minerals came from a single leading supplier.
Price volatility adds further pressure to long-term planning. Lithium prices fell by more than 80% from their 2023 level, while graphite, cobalt, and nickel prices declined by around 10% to 20% in 2024. To reduce risk, EO/IR manufacturers must develop dual-source supply chains, maintain higher safety stocks, redesign selected components, and invest in supplier qualification, which can slow capacity expansion and limit overall market growth.
Opportunities
| Opportunity | (~) % CAGR | Geographic Relevance | Execution Window |
|---|---|---|---|
| Autonomous counter-drone payloads | +1.1% | Global | Medium term (2 to 4 years) |
| Sensor-as-a-service sustainment | +0.8% | North America, Europe | Medium term (2 to 4 years) |
| Commercial space payload conversion | +0.6% | North America, Asia Pacific | Long term (4 years or more) |
| Border-security retrofit packages | +0.5% | Middle East, Asia Pacific | Short term (2 years or less) |
| Allied industrial co-production | +0.4% | Europe, Indo-Pacific | Long term (4 years or more) |
Autonomous counter-drone payloads
Autonomous counter-drone payloads represent a future growth opportunity as deployment remains fragmented across armed forces. The U.S. Department of Defense requested USD 961 billion for FY2026, including USD 384 billion for acquisition, supporting demand for EO/IR detection, tracking, classification, and fire-control systems.
Military spending also increased 8.1% in Asia and Oceania and 14% in Europe in 2025. In 2025, the U.S. Marine Corps awarded Teledyne FLIR a USD 42.5 million contract for more than 600 Rogue 1 systems using Boson 640+ thermal imaging technology. Wider adoption of modular payloads, software upgrades, and sensor networking could support higher-value recurring revenue.
Key Players Analysis
The Military Electro-optical and Infrared (EO/IR) Systems Market is dominated by Tier-1 defence-electronics companies with strong capabilities in targeting, infrared imaging, airborne ISR, fire-control systems, and sensor integration. BAE Systems, L3Harris, Leonardo, Thales, Lockheed Martin, RTX, and Teledyne FLIR together account for an estimated 45–55% of addressable global EO/IR revenue.
BAE Systems’ Electronic Systems business generated £7.5 billion in 2025 sales and £863 million in operating profit, while orders reached £8.7 billion. The company invested £407 million in self-funded R&D and around £1.0 billion in capital expenditure. L3Harris reported USD 21.9 billion in 2025 revenue and invested USD 536 million, equal to 2% of revenue, in company-funded R&D. Its ISR business recorded USD 359 million of growth.
Leonardo’s Defence Electronics & Security division generated €8.3 billion in 2025 revenue, €1.07 billion in EBITA, and a €19.3 billion backlog, while group R&D spending reached €3.0 billion. Thales recorded €22.1 billion in sales and €25.2 billion in orders, with €1.3 billion, or 6.0% of revenue, invested in self-funded R&D and €4.5 billion in total research and engineering.
Tier-2 players collectively hold an estimated 20–30% share. Elbit Systems reported USD 7.9 billion in revenue, up 16.3%, with a USD 28.1 billion backlog and USD 599.6 million R&D expense. Its ISTAR and Electronic Warfare revenue increased 16%. Rheinmetall increased sales 29% to €9.9 billion and generated €1.8 billion in operating profit.
Top Key Players in the Market
- BAE Systems plc
- Elbit Systems Ltd.
- Teledyne FLIR LLC
- Israel Aerospace Industries Ltd.
- L3Harris Technologies Inc.
- Leonardo S.p.A
- Lockheed Martin Corporation
- Raytheon Technologies Corporation
- Rheinmetall AG
- Saab AB
- THALES
Recent Developments
- In May 2026, Elbit Systems secured an approximately USD 350 million contract from an international customer to upgrade main battle tanks over 4 years. The programme includes advanced fire-control systems, AI-enabled electro-optical sights, situational-awareness solutions, communication systems, and electric gun and turret drives.
- In February 2026, Lockheed Martin received a USD 328.5 million U.S. Foreign Military Sales contract to produce IRST21 Legion-ES sensor systems for the Taiwan Air Force. IRST21 uses long-wave infrared technology to passively detect and track airborne targets at extended ranges. Lockheed Martin also reported more than 300,000 combined flight hours across its legacy IRST systems, supporting the maturity of the technology.
Report Scope
| Report Features | Description |
|---|---|
| Market Value (2025) | USD 9.9 Billion |
| Forecast Revenue (2035) | USD 16.5 Billion |
| CAGR (2026-2035) | 5.3% |
| Base Year for Estimation | 2025 |
| Historic Period | 2020-2024 |
| Forecast Period | 2026-2035 |
| Report Coverage | Revenue Forecast, Market Dynamics, Competitive Landscape, Recent Developments |
| Segments Covered | Global Military Electro-optical And Infrared Systems Market Size, Share and Report Analysis By System Type – (Targeting System, Electronic Support Measure (ESM) System, Imaging System), By Platform – (Airborne, Land, Naval), By Technology – (Infrared, Laser, Imaging), By Application – (Surveillance and Reconnaissance, Target Acquisition and Designation, Weapon Sighting and Fire Control, Navigation and Guidance) |
| Regional Analysis | North America – US, Canada; Europe – Germany, France, The UK, Spain, Italy, Rest of Europe; Asia Pacific – China, Japan, South Korea, India, Australia, Singapore, Rest of APAC; Latin America – Brazil, Mexico, Rest of Latin America; Middle East & Africa – GCC, South Africa, Rest of MEA |
| Competitive Landscape | BAE Systems plc, Elbit Systems Ltd., Teledyne FLIR LLC, Israel Aerospace Industries Ltd., L3Harris Technologies Inc., Leonardo S.p.A., Lockheed Martin Corporation, Raytheon Technologies Corporation, Rheinmetall AG, Saab AB, THALES |
| Customization Scope | Customization for segments and region/country-level will be provided. Moreover, additional customization can be done based on the requirements. |
| Purchase Options | We have three licenses to opt for: Single User License, Multi-User License (Up to 5 Users), Corporate Use License (Unlimited Users and Printable PDF) |





































