


Report Overview
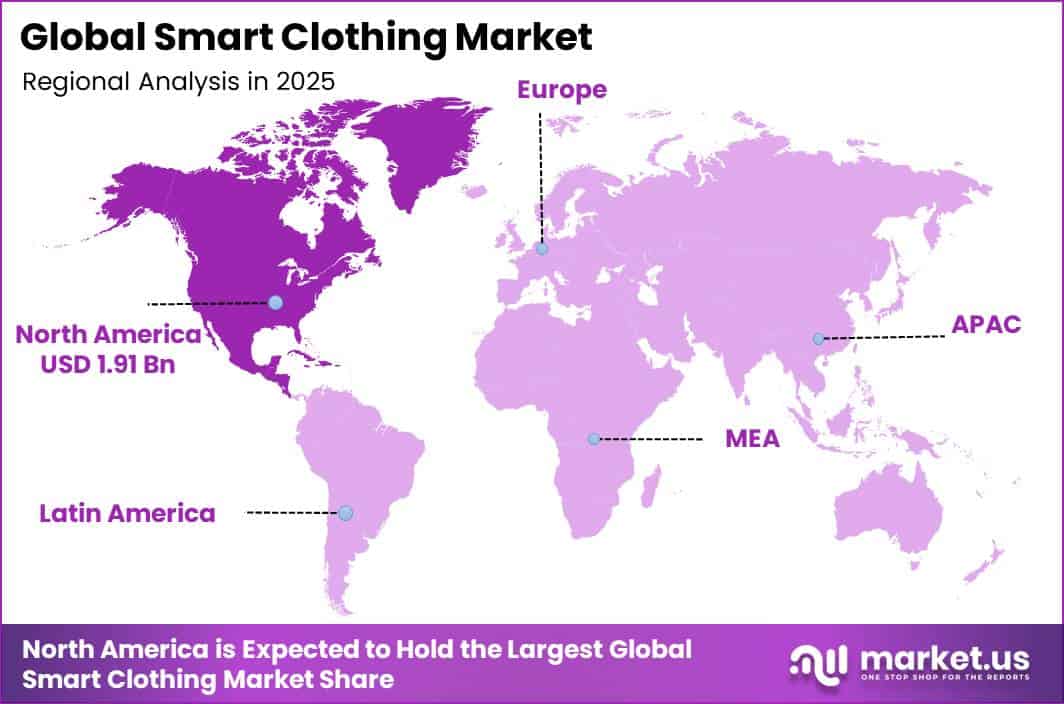
In 2025, the Global Smart Clothing Market was valued at USD 5.0 billion. The market is projected to grow at a CAGR of 23.2% during 2026–2035, reaching approximately USD 40.3 billion by 2035. North America dominated the global market in 2025, accounting for more than 38.2% of the total market share and generating approximately USD 1.91 billion in revenue.
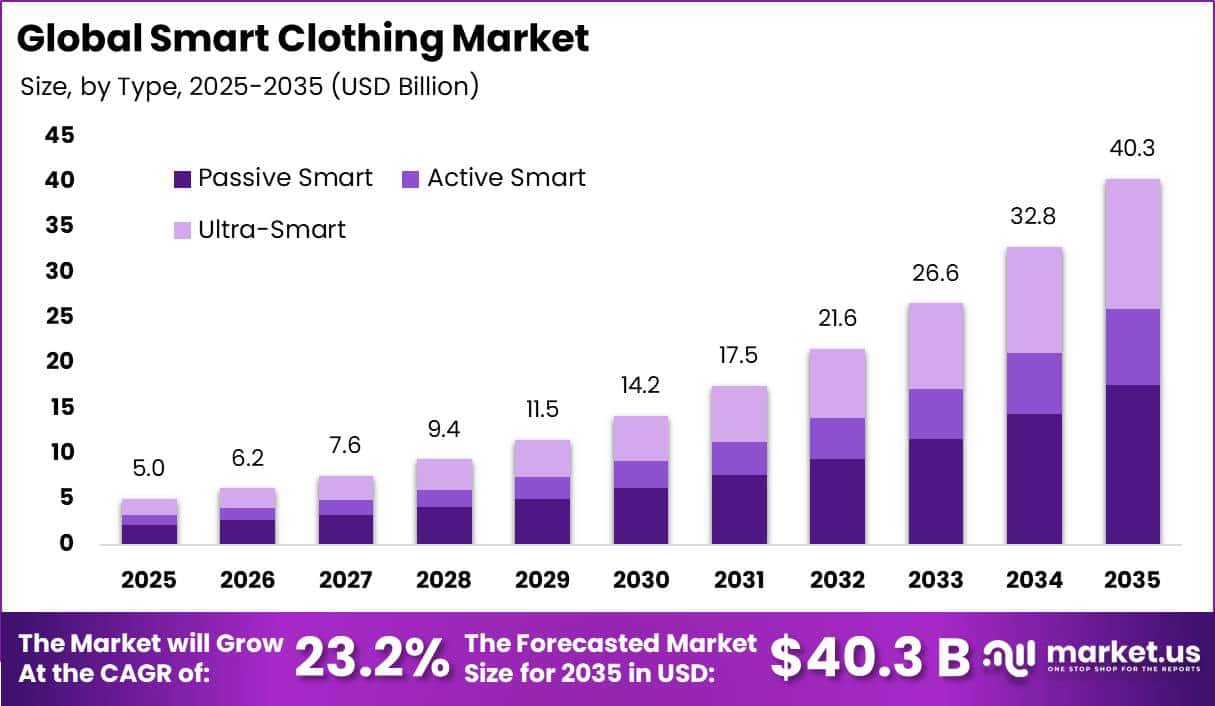
Market growth is being driven by the rising adoption of connected health, fitness, sports, and workplace-safety solutions that can be comfortably worn throughout the day. Smart clothing integrates sensors, conductive fabrics, and wireless technologies to monitor heart rate, body movement, breathing, posture, temperature, sleep, and activity levels.
According to the World Health Organization, around 1.8 billion adults, representing 31% of the global adult population, did not meet recommended physical-activity levels in 2022, compared with 26% in 2010. WHO further expects inactivity to reach 35% by 2030. This trend is creating wider demand for wearable garments that support exercise tracking, rehabilitation, elderly care, sports performance, and remote health monitoring.
CDC data show that nearly 194 million U.S. adults, or 76.4%, had at least one chronic condition in 2023, while 131 million had two or more. Strong online retail also supports market growth, with U.S. e-commerce sales reaching USD 318.0 billion in Q4 2025 and representing 16.7% of total retail sales. These factors support North America’s leading position through 2035.
Key Takeaway
- The Smart Clothing Market was valued at USD 5.0 billion in 2025 and is projected to reach USD 40.3 billion by 2035, growing at a CAGR of 23.2% during 2026–2035.
- Passive smart led the type segment with a 43.8% market share.
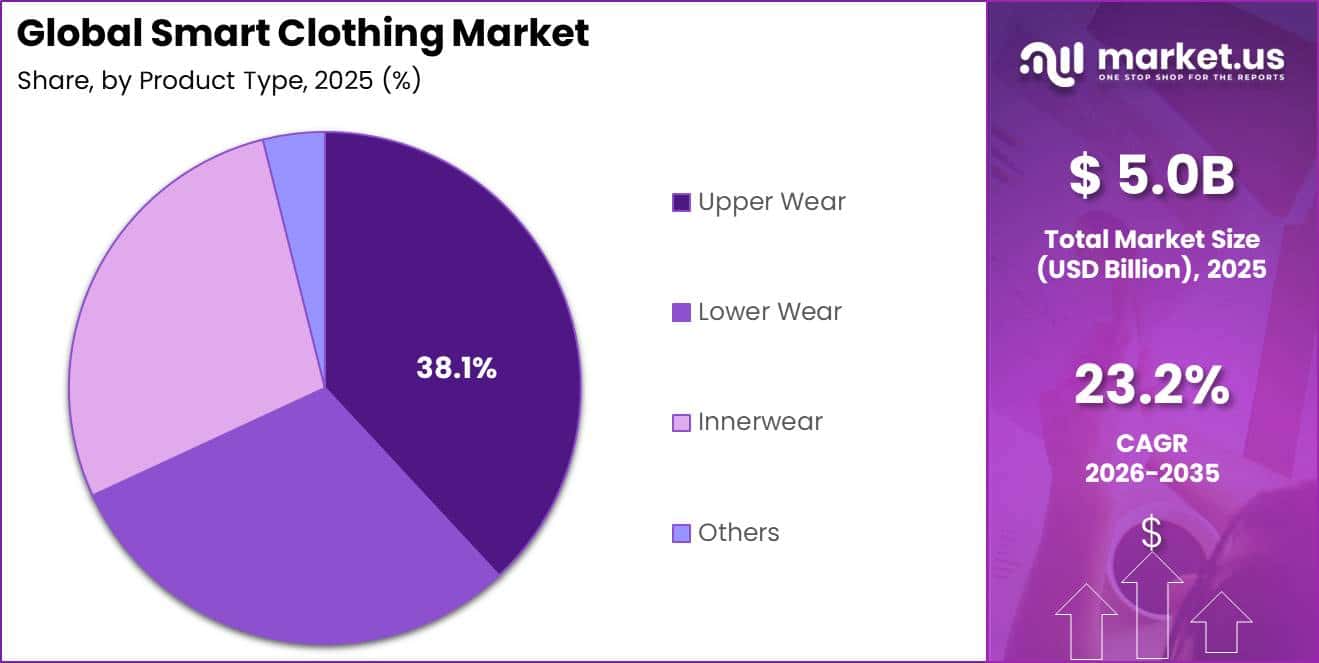
- Upper wear dominated product types with a 38.1% share.
- Offline stores led distribution channels with a 58.7% share.
- Sports and fitness remained the leading end-user segment with a 46.3% share.
- North America led the market in 2025 with a 38.2% share, generating approximately USD 1.91 billion in revenue.
By Type
The Passive Smart segment held a leading position in the smart clothing market, accounting for 43.8% of the total share. Its dominance is supported by lower production costs, lighter designs, improved washability, and easier large-scale manufacturing compared with more advanced smart garments.
The segment also benefits from the large global digital ecosystem. According to the International Telecommunication Union, there were 5.5 billion internet users in 2024, representing 68% of the global population, along with 95 mobile-broadband subscriptions per 100 inhabitants.
GSMA also reported 4.7 billion mobile-internet users and more than 2 billion 5G connections at the end of 2024. This broad connectivity base allows passive smart garments to share activity, location, identification, and safety data through mobile applications, supporting wider adoption and the segment’s 43.8% market leadership.
By Product Type
The Upper Wear segment held a leading position in the smart clothing market, accounting for 38.1% of the total share. Shirts, T-shirts, jackets, vests, sports bras, and compression tops provide suitable areas for placing sensors close to the chest, shoulders, upper back, and lungs. These locations help smart garments monitor heart rate, breathing rate, posture, movement, muscle activity, skin temperature, and training load with lower motion interference.
The segment also benefits from strong participation in sports and fitness activities. World Athletics reported that more than 300 certified road races attracted around 5.5 million participants from 57 countries in 2024. FIFA also recorded at least 128,983 professional football players across 187 countries, supporting demand for garments that track workload, recovery, and movement patterns.
By Distribution Channel
The Offline Stores segment held a leading position in the smart clothing market, accounting for 58.7% of the total share. Its dominance is mainly supported by the continued importance of physical retail, where consumers can directly check product fit, comfort, fabric quality, and sensor placement before buying.
According to UNCTAD, online retail sales represented only around 19.3% of total global retail sales in 2023, indicating that offline channels still accounted for nearly 4 out of every 5 retail purchases worldwide. In the United States, brick-and-mortar stores generated around USD 6.08 trillion in merchandise sales in 2025, showing the strong scale of physical retail.
By End-User
The Sports and Fitness segment held a leading position in the smart clothing market, accounting for 46.3% of the total share. Its dominance is mainly supported by the growing use of wearable garments that provide continuous performance and health data during exercise, training, and recovery.
According to the World Health Organization, physical inactivity could cost global health systems nearly USD 300 billion during 2020–2030, equal to around USD 27 billion each year. This rising economic burden is increasing public awareness of regular exercise and measurable fitness improvement. The International Olympic Committee reported that around 5 billion people, representing 84% of the potential global audience, followed the Paris 2024 Olympic Games.
Key Market Segments
By Type
- Active Smart
- Passive Smart
- Ultra-Smart
By Product Type
- Upper Wear
- Lower Wear
- Innerwear
- Others
By Distribution Channel
- Online Stores
- Offline Stores
- Specialty Stores
By End-User
- Sports and Fitness
- Military and Defence
- Fashion and Entertainment
- Healthcare
- Industrial
- Others
Geopolitical Impact Analysis
Geopolitical disruptions are increasing transportation costs and supply-chain risks for smart clothing manufacturers. Smart garments depend on technical textiles, lithium-ion batteries, conductive yarns, printed sensors, Bluetooth chips, and other electronic components, many of which are sourced internationally. Red Sea disruptions have forced several Asia–Europe shipping services to avoid the Suez Canal.
According to UNCTAD, Suez Canal tonnage transit levels were around 70% below the 2023 average in May 2025. Ships rerouting around the Cape of Good Hope face longer distances, higher fuel use, increased insurance expenses, greater container requirements, and longer delivery times. These disruptions can be particularly challenging for smart-clothing companies sourcing fabrics and electronics from Asia while supplying European markets.
Longer shipping routes can delay seasonal product launches and raise landed costs. UNCTAD reported that global seaborne trade reached 12.72 billion tonnes in 2024, while ton-miles increased by 5.9%, indicating that longer shipping routes increased transport activity faster than cargo volumes.
Trade policies are creating additional cost pressure. U.S. measures effective from November 2025 imposed an additional 10% ad valorem duty on products from China and maintained a separate 10% reciprocal tariff through November 2026. These duties can affect smart garments, electronic modules, chargers, and sensor components. Supply concentration also creates material risks.
The International Energy Agency estimates that a complete disruption in battery-grade graphite trade could place more than USD 300 billion per year of downstream production outside China at risk. In response, manufacturers are adopting multi-country sourcing, regional assembly, higher safety stocks, and alternative freight options, although these strategies can increase working-capital requirements and final product prices.
Regional Analysis
North America led the global smart clothing market in 2025, accounting for 38.2% of total revenue and generating approximately USD 1.9 billion. The region benefits from a strong sports, wellness, connected-device, and health-monitoring ecosystem. In the United States, the outdoor recreation economy generated USD 696.7 billion in value added in 2024, equal to 2.4% of national GDP. Total sector output reached USD 1.3 trillion and supported 5.2 million jobs.
This large base of runners, cyclists, hikers, gym users, team-sport participants, and outdoor workers supports demand for smart shirts, compression wear, sports bras, socks, and jackets. These products can track movement, heart rate, breathing, body temperature, posture, and recovery. Digital readiness also supports adoption, as 88% of people in the Americas used the internet in 2025.
Asia Pacific is expected to be the fastest-growing region, supported by its large population, stronger digital access, rising fitness participation, and manufacturing capacity. Internet use in Asia Pacific increased from 50% in 2019 to 77% in 2025, representing a gain of 27 percentage points in six years.
Key Regions and Countries
North America
- US
- Canada
Europe
- Germany
- France
- The UK
- Spain
- Italy
- Rest of Europe
Asia Pacific
- China
- Japan
- South Korea
- India
- Australia
- Rest of APAC
Latin America
- Brazil
- Mexico
- Rest of Latin America
Middle East & Africa
- GCC
- South Africa
- Rest of MEA
Market Dynamics
Drivers
| Driver | (~) % CAGR | Geographic Relevance | Impact Timeline |
|---|---|---|---|
| Sports performance analytics | +3.0% | North America, Europe, East Asia | Short term (2 years or less) |
| Remote care adoption | +2.6% | North America, Western Europe | Medium term (2 to 4 years) |
| Technical apparel demand | +2.1% | Global urban markets | Short term (2 years or less) |
| Workforce safety monitoring | +1.7% | North America, Europe, Gulf states | Medium term (2 to 4 years) |
| Mobile connectivity scale | +1.4% | Global | Short term (2 years or less) |
Sports performance analytics
Sports performance analytics is a major driver for the smart clothing market because sensor-based garments can collect continuous training data without requiring athletes to carry separate devices. The International Olympic Committee reported that around 5 billion people, representing 84% of the potential global audience, followed the Paris 2024 Olympic Games. World Athletics also recorded more than 300 certified road races across 57countries, attracting around 5.5 million participants in 2024.
Demand is further supported by professional sports. FIFA reported at least 128,983 professional football players across 187 countries, creating opportunities for smart shirts, compression wear, socks, and insoles that monitor movement, workload, and recovery. Frequent garment use can also support repeat purchases and subscription-based analytics services, contributing an estimated +3.0% CAGR upside to the market’s 23.2% baseline CAGR.
Restraints
| Restraint | (~) % CAGR | Geographic Relevance | Impact Timeline |
|---|---|---|---|
| Import tariff exposure | -2.8% | United States, China-linked supply chains | Short term (2 years or less) |
| High unit retail pricing | -2.2% | Price-sensitive emerging markets | Medium term (2 to 4 years) |
| Medical claim compliance | -1.9% | United States, European Union | Medium term (2 to 4 years) |
| Consumer data consent | -1.5% | European Union, North America | Short term (2 years or less) |
| Battery transport restrictions | -1.1% | Global export markets | Short term (2 years or less) |
Import tariff exposure
Import tariffs remain a direct restraint on the smart clothing market because finished products often combine China-linked electronics, rechargeable batteries, conductive materials, and Asia-based textile production. U.S. tariff measures maintained an additional 10% ad valorem duty on certain Chinese-origin goods under the 2025 trade arrangement. The World Trade Organization also projected global merchandise trade volume growth of only 0.9% in 2025, reflecting weaker trade conditions and sourcing disruption.
Higher duties increase landed costs for electronic modules and finished smart garments, with much of the tariff burden passed to importers. For smart-clothing brands, a 10% duty can reduce margins, increase retail prices, and limit investment in new products. These pressures could create an estimated -2.8% CAGR friction drag against the market’s 23.2% baseline CAGR.
Challenges
| Challenge | (~) % CAGR | Geographic Relevance | Mitigation Horizon |
|---|---|---|---|
| Washability and sensor durability | -2.7% | Global | Medium term (2 to 4 years) |
| Battery material concentration | -2.3% | Global supply chains | Long term (4 years or more) |
| Textile electronics integration | -2.0% | East Asia, Europe, North America | Medium term (2 to 4 years) |
| Interoperability standards gaps | -1.6% | Global | Long term (4 years or more) |
| Specialist engineering shortages | -1.2% | North America, Europe, East Asia | Medium term (2 to 4 years) |
Washability and sensor durability
Washability and sensor durability remain a major operational challenge for smart clothing because textile electronics must maintain electrical performance, sensor accuracy, stretch recovery, and user comfort after repeated bending, sweat exposure, and washing. The International Electrotechnical Commission treats washable e-textiles as a multi-material reliability issue involving conductive pathways, encapsulation, connectors, polymers, and textile substrates.
The European Commission’s 2025–2030 Ecodesign work plan places textiles and apparel among priority product groups for stronger durability, circularity, and product-information requirements. It also launched the Digital Product Passport Registry in 2026 under Regulation (EU) 2024/1781. These requirements can increase testing time, supplier qualification costs, and warranty risks, creating an estimated -2.7% CAGR friction drag until manufacturers improve detachable electronics, encapsulation, and verified wash-care standards.
Opportunities
| Opportunity | (~) % CAGR | Geographic Relevance | Execution Window |
|---|---|---|---|
| Industrial safety subscriptions | +3.4% | North America, Europe, Gulf states, East Asia | Medium term (2 to 4 years) |
| Rehabilitation platform partnerships | +2.9% | North America, Europe, Japan | Medium term (2 to 4 years) |
| Textile passport monetisation | +2.3% | European Union | Long term (4 years or more) |
| Defence human-performance systems | +2.0% | North America, Europe, Indo-Pacific | Long term (4 years or more) |
| Female-specific biometric apparel | +1.8% | Global urban markets | Medium term (2 to 4 years) |
Industrial safety subscriptions
Industrial safety subscriptions remain an untapped opportunity for smart clothing, as most current sales come from one-time consumer and sportswear purchases. The International Labour Organization estimates that nearly 3 million workers die each year from work-related accidents and diseases, including more than 330,000 deaths from occupational accidents.
Work-related injuries and illnesses also create an estimated economic loss of around 4% of global GDP annually. In the United States, 5,283 fatal work injuries were recorded in 2023. Smart vests, shirts, and insoles could help employers monitor fatigue, heat stress, ergonomics, and fall risks.
By combining these garments with subscription-based alerts, compliance reporting, and workforce analytics, suppliers could shift from one-time hardware sales toward recurring revenue. At scale, this service model could potentially improve gross margins by around 10%–20% percentage points and provide an estimated +3.4% CAGR upside above the market’s 23.2% baseline CAGR.
Key Players Analysis
The smart clothing market remains highly fragmented, with Under Armour and Ralph Lauren standing out as the only listed companies in the peer group with multi-billion-dollar apparel businesses. Specialist players such as Sensoria, OMSignal, Athos, Hexoskin, Xenoma, Myontec, and AiQ Smart Clothing compete mainly through focused technology and niche applications.
Tier-1 companies are estimated to account for around 20–30% of smart clothing revenue sold under the named brands, supported largely by their strong distribution networks. Under Armour reported USD 4.97 billion in fiscal 2026 net revenue, including USD 3.4 billion from apparel, representing 68.4% of total sales.
This large apparel base supports the company’s position in sensor-enabled tops, compression wear, and athlete-monitoring products. Ralph Lauren generated USD 8.1 billion in fiscal 2026 revenue and USD 941.1 million in net income, while annual capital expenditure reached USD 408.1 million.
Tier-2 companies compete through specialized solutions. Hexoskin and OMSignal focus on biometric garments, Athos on muscle sensing, Sensoria on connected socks, Xenoma on e-skin wearables, and Myontec and AiQ Smart Clothing on textile electronics. Comparable financial data are not publicly available for these private companies.
Under Armour’s USD 3.4 billion apparel revenue equals about 42% of Ralph Lauren’s USD 8.1 billion corporate revenue, showing Ralph Lauren’s larger financial scale while Under Armour remains more closely linked to performance-oriented smart clothing.
Top Key Players in the Market
- Under Armour
- Sensoria
- OMSignal
- Athos
- Hexoskin
- Xenoma
- Ralph Lauren
- Myontec
- AiQ Smart Clothing
Recent Developments
- In 2026, Under Armour introduced the Drive Pro Clone golf shoes and ArmourDry Polo. The ArmourDry Polo uses UA Helix Technology with a coiled-yarn structure designed to improve airflow and moisture evaporation. At only 165 grams, the polo dries 50% faster than Under Armour’s Playoff Polo.
- In 2025, Under Armour entered into an official apparel partnership with Georgia Tech. Under Armour became the university’s official supplier of uniforms, apparel, footwear, and accessories. Georgia Tech was also Under Armour’s first collegiate customer in 1996, nearly 30 years earlier.
Report Scope
| Report Features | Description |
|---|---|
| Market Value (2025) | USD 5.0 Billion |
| Forecast Revenue (2035) | USD 40.3 Billion |
| CAGR (2026-2035) | 23.2% |
| Base Year for Estimation | 2025 |
| Historic Period | 2020-2024 |
| Forecast Period | 2026-2035 |
| Report Coverage | Revenue Forecast, Market Dynamics, Competitive Landscape, Recent Developments |
| Segments Covered | By Type (Active Smart, Passive Smart, Ultra-Smart); By Product Type (Upper Wear, Lower Wear, Innerwear, Others); By Distribution Channel (Online Stores, Offline Stores, Specialty Stores); By End-User (Sports and Fitness, Military and Defence, Fashion and Entertainment, Healthcare, Industrial, Others) |
| Regional Analysis | North America – US, Canada; Europe – Germany, France, The UK, Spain, Italy, Rest of Europe; Asia Pacific – China, Japan, South Korea, India, Australia, Singapore, Rest of APAC; Latin America – Brazil, Mexico, Rest of Latin America; Middle East & Africa – GCC, South Africa, Rest of MEA |
| Competitive Landscape | Under Armour, Sensoria, OMSignal, Athos, Hexoskin, Xenoma, Ralph Lauren, Myontec, AiQ Smart Clothing |
| Customization Scope | We will provide customization for segments and region/country levels. Additional customization can be done based on requirements. |
| Purchase Options | We have three licenses to opt for: Single User License, Multi-User License (Up to 5 Users), Corporate Use License (Unlimited Users and Printable PDF) |





































