


Report Overview
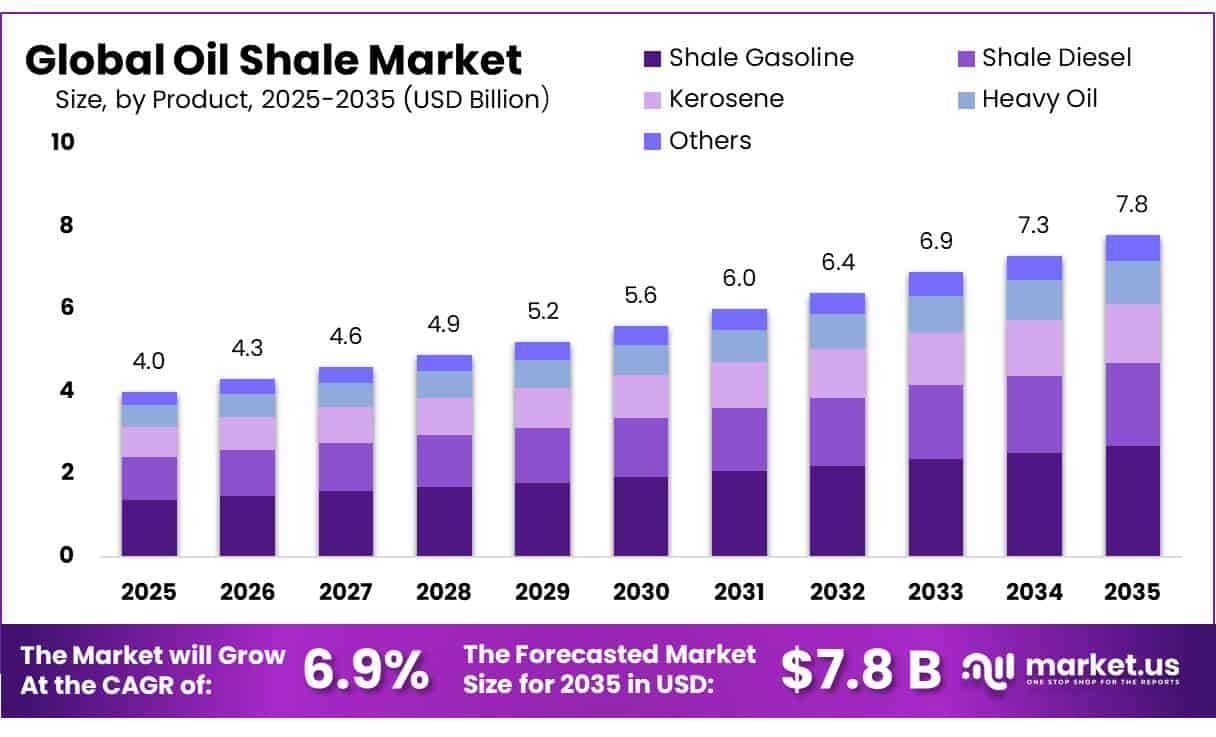
In 2025, the Global Oil Shale Market was valued at USD 4.0 Billion, and between 2026 and 2035, this market is estimated to register a CAGR of 6.9%, reaching about USD 7.8 Billion by 2035. North America held a dominant market position, capturing more than a 44.5% share, holding USD 1.78 Billion in revenue.
Oil shale is a sedimentary rock containing kerogen that can be converted into liquid hydrocarbons through heating, retorting and upgrading. The industry connects mining, thermal processing, power generation and downstream refining, making economics dependent on ore quality, energy use, water availability, carbon costs and crude-oil prices.
- The U.S. Geological Survey estimates that the three principal basins of the Green River Formation contain about 4.285 trillion barrels of oil in place. Using cut-offs of 15 gallons per ton and 25 gallons per ton, USGS identified around 353 billion to 1.146 trillion barrels as having comparatively high development potential. This demonstrates a large long-term resource base, although only a portion can be commercially recovered.
Estonia remains one of the clearest examples of an operating oil-shale value chain. Eesti Energia reported shale-oil production of 378.4 thousand tonnes in 2025, down 16% from the previous year, while sales volume reached 393.8 thousand tonnes. Shale-oil segment revenue totaled EUR 150.0 million. The company also invested EUR 47.5 million in a new shale-oil plant, showing continuing industrial investment alongside a broader energy transition.
Jordan has also established commercial-scale oil-shale utilization. Attarat Power Company operates a 470 MW net mine-mouth power plant based on two 235 MW units. The project is valued at USD 2.1 billion, while its open-pit mine supplies about 10–11 million tonnes of oil shale annually. A 30-year power-purchase agreement with Jordan’s National Electric Power Company provides long-term offtake, supporting domestic energy security and reducing import exposure.
- Energy-security concerns remain an important demand driver. The International Energy Agency reported that global oil supply reached 101.5 million barrels per day in July 2026 but remained 6.3 million barrels per day below the previous year. The IEA also states that around 25% of global seaborne oil trade in 2025 passed through the Strait of Hormuz, highlighting the strategic value of indigenous fuel resources during supply disruptions.
Carbon policy is simultaneously reshaping the industry. The European Commission allocated EUR 354 million through the Just Transition Fund to support Estonia’s move away from oil shale. Oil-shale-related companies account for more than 50% of Estonia’s greenhouse-gas emissions, while the country targets an end to oil-shale electricity production by 2035 and oil shale in energy production by 2040.
Key Takeaways
- Oil Shale Market was valued at USD 4.0 Billion, this market is estimated to register a CAGR of 6.9%, reaching about USD 7.8 Billion by 2035.
- Shale Gasoline held a dominant market position, capturing more than a 34.50% share.
- In-Situ Technology held a dominant market position, capturing more than a 67.20% share.
- Oil Shale Exploration held a dominant market position, capturing more than a 44.00% share.
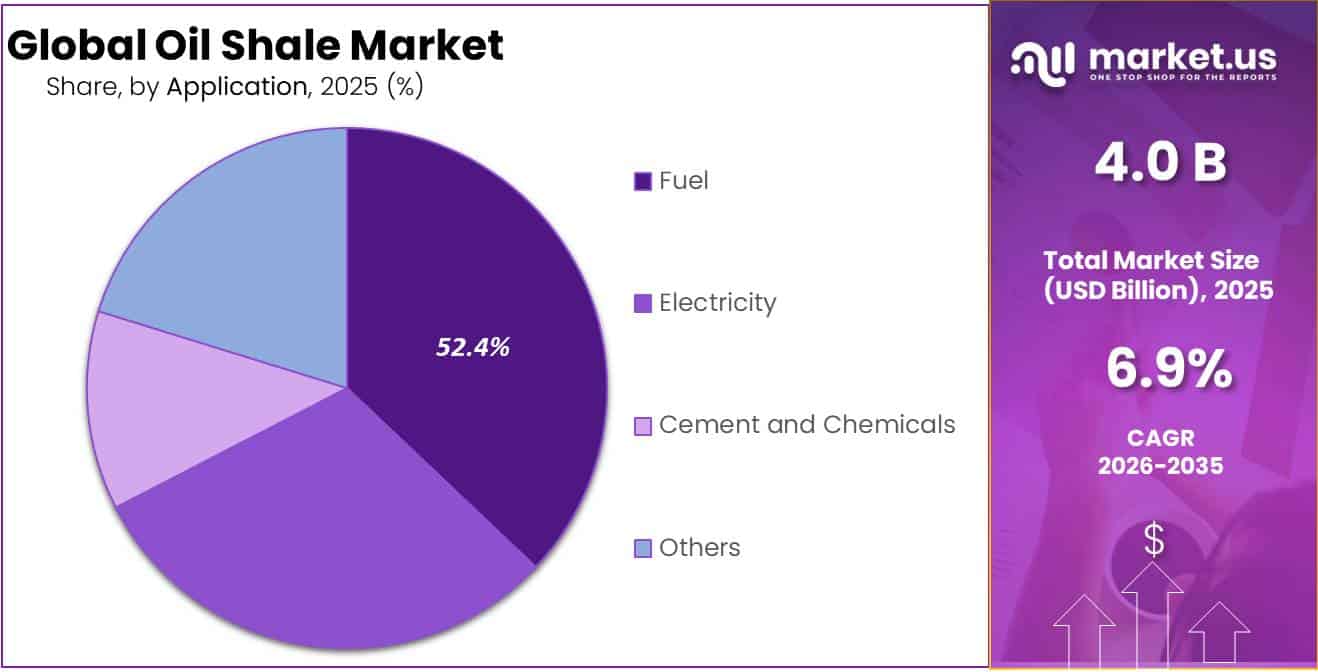
- Fuel held a dominant market position, capturing more than a 52.40% share.
- Automobile/Transportation Fuel held a dominant market position, capturing more than a 30.20% share.
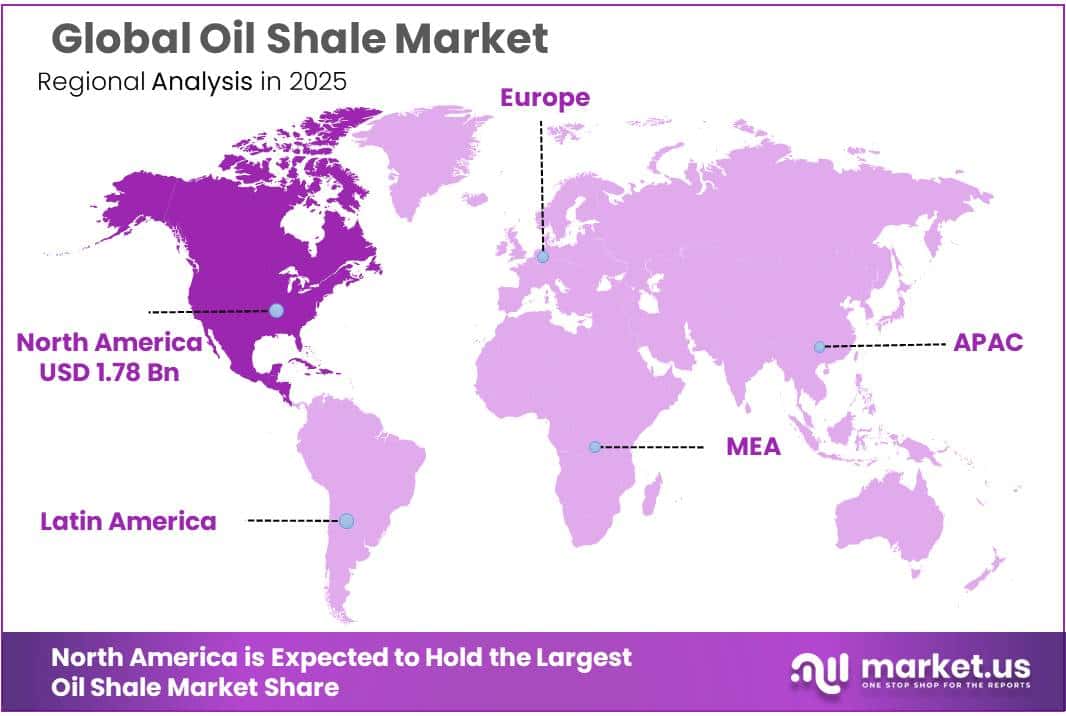
- North America dominates the Oil Shale Market with a 44.50% share and USD 1.78 billion in value.
By Product Analysis
Shale Gasoline dominates the product segment with a 34.50% share, supported by its use as a transportation-fuel fraction from upgraded shale oil.
In 2025, Shale Gasoline held a dominant market position, capturing more than a 34.50% share. The segment benefits from the ability of shale oil to be upgraded and refined into lighter transportation fuels, including gasoline. The U.S. Department of Energy notes that hydrotreated shale oil can be processed in conventional refining facilities to produce gasoline, diesel and jet fuel, supporting the technical feasibility of gasoline recovery from oil shale.
- In 2025, Eesti Energia produced 378.4 thousand tonnes of shale oil, providing an established industrial feedstock base for further refining and fuel applications. Its operations used approximately 3.2 million tonnes of oil shale for shale-oil production during the same year, showing the scale of raw-material processing that can support downstream gasoline and other refined products.
Shale Diesel is an important product segment because upgraded shale oil can be converted into middle-distillate transportation fuels suitable for diesel applications. U.S. Department of Energy technical research confirms that hydrotreated shale oil can be processed into high-quality diesel alongside gasoline and jet fuel.
- In 2026, Eesti Energia reported first-quarter shale-oil production of 118.1 thousand tonnes, showing that commercial oil-shale processing remains active in Europe. The company’s existing oil plants have an annual shale-oil production capacity of around 450 thousand tonnes, while its new Enefit processing facility carries an expected investment cost of EUR 380 million. These investments support future opportunities for upgraded shale-derived diesel and other liquid fuels where domestic energy security and refinery integration remain important.
By Technology/Method Analysis
In-Situ Technology dominates with a 67.20% share, supported by lower surface disturbance and access to deeper oil-shale resources.
In 2025, In-Situ Technology held a dominant market position, capturing more than a 67.20% share. The method is gaining technical attention because it heats kerogen-bearing rock underground and recovers generated oil and gas without first mining and transporting large quantities of rock to a surface retort. A 2025 technical review in the Oil Shale journal identifies in-situ conversion as an approach that can reduce surface disturbance, ecological footprint and mining requirements while supporting development of deeper resources.
- U.S. federal regulations also formally recognize in-situ recovery as an oil-shale production method under 43 CFR 3900.2. In the FY2026 budget request, the U.S. Department of Energy maintained USD 13.0 million for Naval Petroleum and Oil Shale Reserves activities, showing continued federal management of oil-shale-related assets, although this funding should not be interpreted as commercial in-situ production expenditure.
Ex-Situ Technology (surface retorting) continues to hold an important position in the Oil Shale Market because it is already used at commercial scale, particularly in Estonia. Under this method, oil shale is mined and transported to above-ground processing units, where heat converts kerogen into shale oil and retort gas; U.S. federal regulations specifically recognize surface retorting as an oil-shale production method.
- In 2025, Eesti Energia produced 378.4 thousand tonnes of shale oil from its established processing operations. In the first quarter of 2026, production reached another 118.1 thousand tonnes, with the result affected by maintenance at the Enefit 280-1 oil plant. These operating volumes show that surface retorting remains the more visibly commercialized oil-shale conversion route, supported by existing mines, retorts and downstream shale-oil handling infrastructure.
By Process Analysis
Oil Shale Exploration dominates with a 44.00% share, supported by continued geological mapping, well analysis, and assessment of large kerogen resources.
In 2025, Oil Shale Exploration held a dominant market position, capturing more than a 44.00% share. Exploration remains an important first step because developers need reliable information on shale thickness, kerogen content, mineral composition, depth, and potential oil yield before commercial extraction can be considered.
- In June 2025, the U.S. Geological Survey released new geochemical and mineralogical information collected from 34 wells in the Green River Formation in Utah’s Uinta Basin, using core and drilling-cutting samples to improve understanding of the resource. U.S. Geological Survey The U.S. Bureau of Land Management states that the Green River Formation across Colorado, Utah, and Wyoming covers about 16,000 square miles, demonstrating why geological characterization remains important before development decisions are made. U.S. Bureau of Land Management
Extraction/Mining & Ore Preparation forms the physical production stage of the Oil Shale Market, covering open-pit or underground mining, transportation, crushing, sizing, and preparation of shale rock for further thermal processing. In 2025, Eesti Energia mined 4.31 million tonnes of oil shale, showing the continued industrial scale of conventional oil-shale extraction. Eesti Energia 2026 Offering Circular The company reported that around 3.2 million tonnes of oil shale were directed to shale-oil production during the same year, highlighting the close link between mining, ore preparation, and downstream retorting.
By Application Analysis
Fuel dominates the Oil Shale Market with a 52.40% share, supported by established shale-oil production and liquid-fuel demand.
In 2025, Fuel held a dominant market position, capturing more than a 52.40% share. Fuel remains the leading application because processed oil shale produces liquid hydrocarbons that can be sold as fuel oil or further upgraded into transportation fuels and other petroleum products.
- In 2025, Eesti Energia produced 378.4 thousand tonnes of shale oil and sold 393.8 thousand tonnes, demonstrating continued commercial demand for shale-derived liquid fuels. Around 3.2 million tonnes of oil shale were directed to shale-oil production during 2025. Government data from Statistics Estonia also showed that shale-oil manufacturing remained an active industrial category during 2025, although output experienced a 37.9% year-on-year decline in September as production and pricing conditions weakened.
Electricity continues to be an important application of oil shale, particularly in countries with established mine-mouth power plants and domestic shale resources. In 2025, Eesti Energia used approximately 1.5 million tonnes of oil shale for electricity production and reported total electricity generation of 3,623 GWh. The role of oil shale in power generation is mainly supported by its ability to provide controllable domestic generation when electricity markets face supply or security pressures.
- Estonia continued to identify oil shale as an important non-renewable energy resource in 2026, while national electricity production reached 409.8 GWh in June 2026. These operating conditions keep electricity generation relevant for the oil-shale industry, even as utilities gradually increase renewable capacity and reduce dependence on carbon-intensive fuels.
By End-Use Industry Analysis
Automobile/Transportation Fuel leads with a 30.20% share, supported by sustained demand for liquid transportation fuels.
In 2025, Automobile/Transportation Fuel held a dominant market position, capturing more than a 30.20% share. The segment benefits from the ability to process oil shale into liquid fuels and shale-oil gasoline for energy markets. Eesti Energia confirms that it processes oil shale into liquid fuels and sells shale-derived products in international markets.
- In 2025, U.S. motor gasoline consumption averaged 8.9 million barrels per day, showing the continuing scale of transportation-fuel demand. U.S. transportation also consumed approximately 2.94 million barrels per day of distillate diesel fuel during 2025. These large fuel requirements provide a potential downstream outlet for upgraded shale-derived gasoline and diesel where commercial processing is economically viable.
Energy and Utilities continues to represent an important end-use industry because oil shale can supply both electricity-generating plants and integrated energy facilities. In 2025, Eesti Energia used approximately 1.5 million tonnes of oil shale for electricity production, showing the continuing industrial use of the resource in power generation. During the second quarter of 2026, the company’s non-renewable electricity generation reached 165 GWh. The same period generated EUR 14.9 million from Estonia’s strategic reserve capacity mechanism, which helps keep oil-shale power capacity available for security-of-supply needs.
Key Market Segments
By Product
- Shale Gasoline
- Shale Diesel
- Kerosene
- Heavy Oil
- Others
By Technology/Method
- In-Situ Technology
- Ex-Situ Technology (surface retorting)
By Process
- Oil Shale Exploration
- Extraction/Mining & Ore Preparation
- Oil Shale Retorting
By Application
- Fuel
- Electricity
- Cement and Chemicals
- Others
By End-Use Industry
- Automobile/Transportation Fuel
- Energy and Utilities
- Chemical Industry
- Cement and Construction
- Industrial Process Heating
- Agriculture
Driver Analysis
Energy-security, mine-mouth power
Oil shale retains strategic value where it substitutes imported pipeline gas, LNG, or refined fuel at the electricity-system level, particularly in Jordan, where the 470 MW net Attarat Um Ghudran complex operates as two 235 MW units located approximately 110 km southeast of Amman. Its approximately US$2.1 billion mine-mouth configuration reduces exposure to seaborne fuel logistics because fuel is supplied from an adjacent domestic resource rather than imported through regional transport corridors.
Oil shale reportedly supplied about 15% of Jordan’s electricity by 2025, up from 12.6% in 2023, while natural gas still represented roughly 58% of generation in 2024; this leaves meaningful scope for domestically controlled baseload generation to influence fuel-diversification decisions.
However, commercial viability is highly contract-specific: Attarat’s reported tariff of about US$0.17/kWh and an estimated annual system cost near US$280 million demonstrate that oil-shale power increases physical energy security but can transfer substantial affordability risk to utilities, governments and consumers.
Drivers Impact Analysis
| Driver | (~) % Impact on CAGR | Geographic Relevance | Impact Timeline |
|---|---|---|---|
| Energy-security, mine-mouth power | +1.6 pp | Jordan core; MENA spill-over | Short term (≤ 2 years) |
| Estonian shale-oil conversion capacity | +1.2 pp | Estonia; Baltic export markets | Short term (≤ 2 years) |
| Oil-price volatility and fuel substitution | +0.9 pp | Europe; MENA; Asian importers | Short term (≤ 2 years) |
| Local-resource import displacement | +1.0 pp | Jordan; Morocco; select MENA markets | Medium term (2–4 years) |
| Retorting efficiency and co-product value | +0.7 pp | Estonia; China; Jordan | Medium term (2–4 years) |
| Carbon pricing and fossil-fuel phase-down | -2.4 pp | EU core; Estonia; export-linked markets | Long term (≥ 4 years) |
Restraint Analysis
Carbon-cost escalation
The most material restraint is the widening carbon-cost differential between oil shale and lower-emission power or liquid-fuel alternatives: EU ETS policy targets a 62% reduction in covered emissions by 2030 versus 2005, applies a 4.3% annual cap reduction during 2024–2027 and a 4.4% reduction from 2028, and removed 27 million allowances through its scheduled 2026 rebasing, all of which tighten the long-run allowance environment for Estonian assets.
Estonia’s leading producer has indicated that incorporating full CO₂ costs could make local oil-shale production commercially unviable by 2035; the company mined about 3.4 million tonnes in 2025 and cited carbon-cost exposure as a direct reason for targeting a reduction in internal mining costs from roughly €30 per tonne to €20 per tonne. The result is a double squeeze on cash generation: carbon allowances raise variable operating cost while the probability of a shortened asset life reduces the period over which mines, retorts, ash systems and environmental liabilities can be depreciated, thereby elevating required returns and delaying replacement CapEx.
Restraint Impact Analysis
| Restraint | (~) % Impact on CAGR Forecast | Geographic Relevance | Impact Timeline |
|---|---|---|---|
| Carbon-cost escalation | -2.6 pp | Estonia; EU core | Long term (≥ 4 years) |
| Weak shale-oil realizations | -1.5 pp | Estonia; Baltic exports | Short term (≤ 2 years) |
| High mining cost base | -1.3 pp | Estonia; Jordan | Medium term (2–4 years) |
| Waste and remediation burden | -1.1 pp | Estonia; EU markets | Long term (≥ 4 years) |
| Inflexible power tariffs | -1.4 pp | Jordan; MENA | Medium term (2–4 years) |
| Renewable-cost displacement | -1.8 pp | EU; Jordan; MENA | Long term (≥ 4 years) |
Opportunity Analysis
Ash-to-cement materials
This is an untapped circular-materials opportunity rather than a current demand driver because most Estonian oil-shale ash is still treated as a disposal liability rather than as specification-grade construction input: up to 5 million tonnes are generated annually, largely placed in ash hills, yet recent research indicates that separated and controlled ash fractions can be used in cement, road construction, liming products and selected fertilizer applications.
A commercial pathway would require operators to separate bottom ash from potentially contaminated fly ash, construct drying, milling, grading and quality-assurance lines, then sell certified material under multi-year supply agreements to cement producers, road contractors and municipalities; at even 10–15% conversion of the annual ash stream, the addressable secondary-material throughput could reach 0.5–0.75 million tonnes per year.
Opportunity Impact Analysis
| Opportunity | (~) % Potential CAGR Upside | Geographic Relevance | Execution Window |
|---|---|---|---|
| Ash-to-cement materials | +1.4 pp | Estonia; EU Baltics | Medium term (2–4 years) |
| Mine-tailings minerals | +1.1 pp | Estonia; Northern EU | Medium term (2–4 years) |
| Specialty chemical extraction | +0.9 pp | Estonia; EU chemical hubs | Long term (≥ 4 years) |
| Retort-gas monetisation | +0.8 pp | Estonia; Jordan | Short term (≤ 2 years) |
| Low-carbon fuel upgrading | +1.0 pp | Baltic exports; EU ports | Medium term (2–4 years) |
| Asset-conversion M&A | +0.7 pp | Estonia; MENA | Medium term (2–4 years) |
Challenges Analysis
Ageing retort reliability
Oil-shale processing depends on continuous high-temperature operations across crushing, drying, retorting, vapour recovery, gas treatment and ash handling, so a single maintenance outage can reduce output faster than fixed costs can be removed: Eesti Energia produced 118,000 tonnes of shale oil in Q1 2026, down 3% year on year, with the decline attributed primarily to maintenance at Enefit 280-1, while sales volumes fell 12% and revenue declined 27% to €40 million.
The reliability challenge is ongoing rather than an immediate market restraint because these plants continue to operate and sell product, but their availability curve is increasingly governed by corrosion, refractory wear, rotating-equipment failure, heat-exchanger fouling and long lead-time replacement parts; a 5–10 day unplanned outage can erode quarterly throughput by roughly 5–11% for a continuously operated production train. Producers must therefore move from calendar-based maintenance to predictive reliability programs using vibration monitoring, thermal imaging, spare-parts criticality mapping, condition-based shutdown planning and vendor-backed service inventories, while new assets such as the nearly €400 million Enefit 280-2 facility must complete optimisation and laboratory validation before reaching its 250,000-tonne annual design capacity.
Challenges Impact Analysis
| Challenge | (~) % CAGR Friction | Geographic Relevance | Mitigation Horizon |
|---|---|---|---|
| Ageing retort reliability | -1.2 pp | Estonia; Jordan | Medium term (2–4 years) |
| Mine-to-plant variability | -0.9 pp | Estonia; Jordan; China | Medium term (2–4 years) |
| Skilled workforce transition | -0.8 pp | Estonia core; EU Baltics | Long term (≥ 4 years) |
| Ash-water compliance load | -0.9 pp | Estonia; EU regulatory hubs | Long term (≥ 4 years) |
| Product-quality upgrade gap | -1.0 pp | Baltic exports; EU ports | Medium term (2–4 years) |
| Capital allocation uncertainty | -1.1 pp | Estonia; MENA; China | Long term (≥ 4 years) |
Geopolitical Impact Analysis
Ongoing Wars Strengthen the Strategic Role of Domestic Oil Shale
The Russia–Ukraine war and the 2026 Middle East conflict have strengthened the energy-security case for domestic oil-shale resources, while also raising operating risks. EU sanctions continue to restrict Russian crude and petroleum trade, with the Council’s April 2026 package preparing a future maritime-services ban on Russian crude and refined products. This supports interest in locally available fuels where oil shale can reduce exposure to imported hydrocarbons.
- The Middle East conflict has added stronger short-term pressure. The IEA reported that global oil supply fell to 94.5 million barrels per day in May 2026, around 13.6 million barrels per day below pre-conflict levels. Such disruption can improve the strategic value of shale oil and oil-shale power generation during periods of tight fuel supply, particularly in Estonia and other resource-holding countries.
However, war-driven inflation, equipment costs, shipping disruption and volatile oil prices can delay capital-intensive mining and retorting projects. Estonia reported electricity production of 409.8 GWh in June 2026 and noted that a large share of national energy still comes from non-renewable resources such as oil shale. Therefore, geopolitical tension creates a mixed outlook: stronger energy-security demand, but higher cost, financing and environmental pressure for producers across the current global energy system.
Regional Insights
North America dominates with a 44.50% share, valued at USD 1.78 billion, backed by a substantial oil-shale resource base.
North America dominates the Oil Shale Market with a 44.50% share and USD 1.78 billion in value, supported by its exceptionally large resource base, established geological programs, and federal land management framework. The U.S. Bureau of Land Management’s 2025 Colorado Briefing Book states that more than 70% of the Green River Formation lies on public lands across Colorado, Utah, and Wyoming. It also cites an estimated 800 billion barrels of recoverable oil from the formation.
The broader Green River oil-shale area covers about 16,000 square miles, reinforcing North America’s long-term strategic position. Continued resource characterization, leasing oversight, extraction-technology development, and interest in domestic energy security support the region. However, commercial expansion remains dependent on production economics, water requirements, permitting, and environmental performance, which continue to shape the pace at which these large geological resources can move toward industrial development.
Key Regions and Countries Insights
- North America
- US
- Canada
- Europe
- Germany
- France
- The UK
- Spain
- Italy
- Rest of Europe
- Asia Pacific
- China
- Japan
- South Korea
- India
- Australia
- Rest of APAC
- Latin America
- Brazil
- Mexico
- Rest of Latin America
- Middle East & Africa
- GCC
- South Africa
- Rest of MEA
Key Players Analysis
Exxon Mobil Corporation remains relevant to the Oil Shale Market through its large upstream, refining, and hydrocarbon-processing capabilities, although its current reporting does not identify commercial oil-shale production as a separate business. In 2025, ExxonMobil earned USD 28.8 billion and generated USD 52.0 billion in operating cash flow. Cash capital expenditure reached USD 29.0 billion, while upstream production recorded its highest annual level in more than 40 years. Its technical scale supports potential unconventional-resource processing and upgrading applications over time.
Shell plc holds strategic relevance to the Oil Shale Market through its long-standing expertise in unconventional hydrocarbons, refining, thermal processing, and fuel upgrading, although current reporting does not disclose commercial oil-shale output as a separate segment. In 2025, Shell reported USD 18.1 billion in income and USD 18.5 billion in adjusted earnings. Operating cash flow reached USD 42.9 billion, while capital expenditure totaled USD 18.9 billion. This financial and technical capacity supports subsurface studies, processing innovation, and complex energy-project development.
Chevron Corporation contributes to the competitive landscape through its upstream engineering, unconventional-resource development, and large refining network, rather than through separately disclosed commercial oil-shale production. In 2025, Chevron recorded USD 150.5 billion in sales and other operating revenues and invested USD 17.3 billion. Worldwide production increased 12%, while U.S. production rose 16% to record levels. The company also achieved a 158% reserve replacement ratio, reinforcing the technical and financial scale available for complex hydrocarbon-resource development and processing globally at scale.
Top Key Players Outlook
- Exxon Mobil Corporation
- Shell plc
- Chevron Corporation
- Eesti Energia AS (Enefit)
- Viru Keemia Grupp (VKG)
- PetroChina Company Limited
- Sinopec Corp.
- TotalEnergies SE
- ConocoPhillips Company
- Occidental Petroleum Corporation
- Petrobras
- Queensland Energy Resources Ltd.
- JOGMEC
- Red Leaf Resources, Inc.
- American Shale Oil, LLC (AMSO)
Recent Developments
- In April 2026, VKG moved ahead with the expansion by laying the cornerstone for the Uus-Kiviõli mine, whose estimated construction cost was reduced from EUR 110 million to EUR 75 million.
- In March 2026, it agreed with the U.S. Department of the Interior to redirect refunded offshore-wind lease fees into U.S. gas, LNG, and oil development; TotalEnergies stated that its U.S. investment since 2022 had reached nearly USD 12 billion, while U.S. LNG exports by the company totaled 19 million tonnes in 2025.
Report Scope
| Report Features | Description |
|---|---|
| Market Value (2025) | USD 4.0 Bn |
| Forecast Revenue (2035) | USD 7.8 Bn |
| CAGR (2026-2035) | 6.9% |
| Base Year for Estimation | 2025 |
| Historic Period | 2020-2024 |
| Forecast Period | 2026-2035 |
| Report Coverage | Revenue Forecast, Market Dynamics, Competitive Landscape, Recent Developments |
| Segments Covered | By Product (Shale Gasoline, Shale Diesel, Kerosene, Heavy Oil, Others), By Technology/Method (In-Situ Technology, Ex-Situ Technology (surface retorting)), By Process (Oil Shale Exploration, Extraction/Mining & Ore Preparation, Oil Shale Retorting), By Application (Fuel, Electricity, Cement and Chemicals, Others), By End-Use Industry (Automobile/Transportation Fuel, Energy and Utilities, Chemical Industry, Cement and Construction, Industrial Process Heating, Agriculture) |
| Regional Analysis | North America – US, Canada; Europe – Germany, France, The UK, Spain, Italy, Rest of Europe; Asia Pacific – China, Japan, South Korea, India, Australia, Singapore, Rest of APAC; Latin America – Brazil, Mexico, Rest of Latin America; Middle East & Africa – GCC, South Africa, Rest of MEA |
| Competitive Landscape | Exxon Mobil Corporation, Shell plc, Chevron Corporation, Eesti Energia AS (Enefit), Viru Keemia Grupp (VKG), PetroChina Company Limited, Sinopec Corp., TotalEnergies SE, ConocoPhillips Company, Occidental Petroleum Corporation, Petrobras, Queensland Energy Resources Ltd., JOGMEC, Red Leaf Resources, Inc., American Shale Oil, LLC (AMSO) |
| Customization Scope | Customization for segments, region/country-level will be provided. Moreover, additional customization can be done based on the requirements. |
| Purchase Options | We have three licenses to opt for: Single User License, Multi-User License (Up to 5 Users), Corporate Use License (Unlimited User and Printable PDF) |





































