


Report Overview
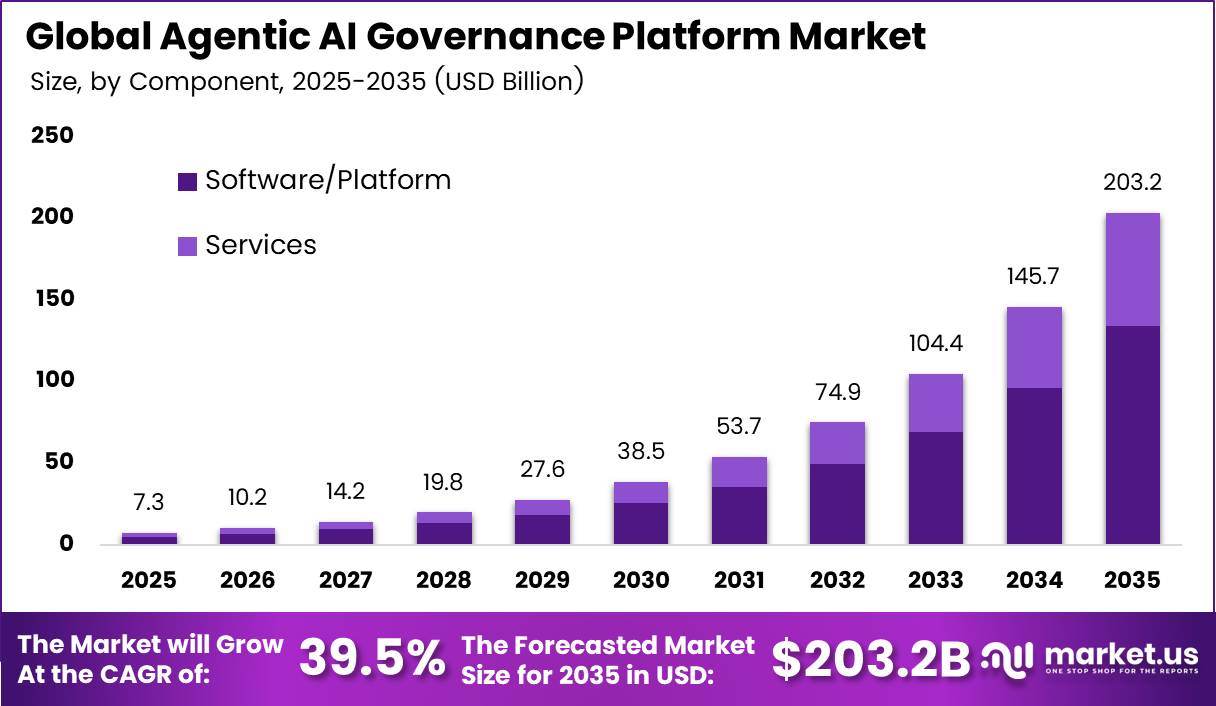
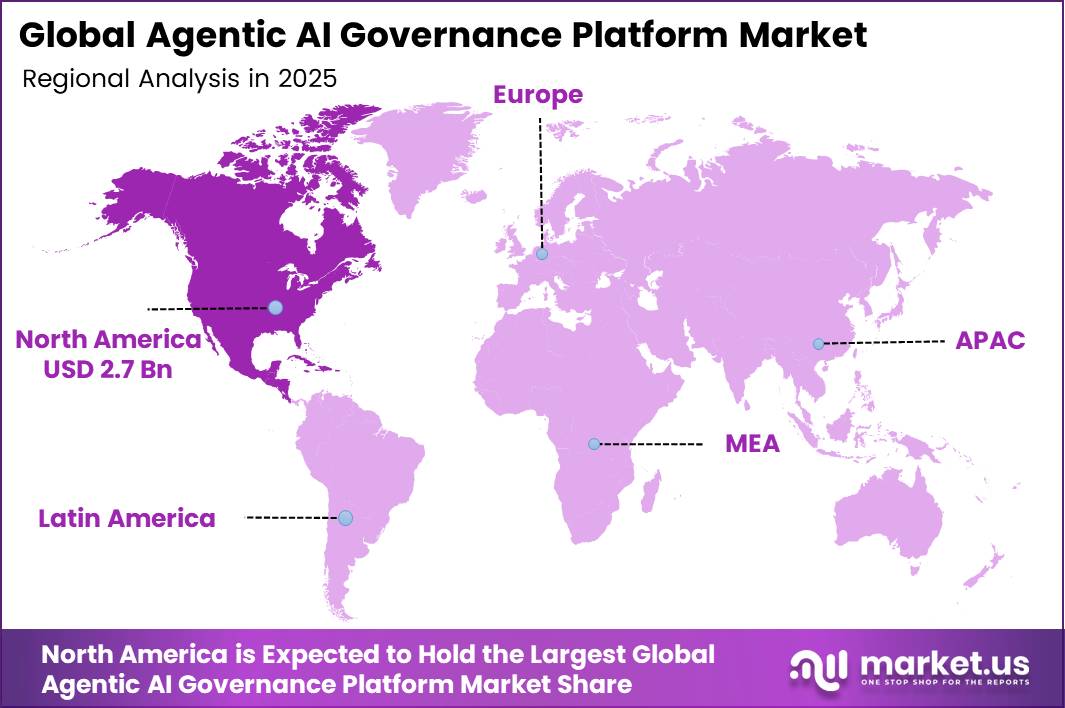
In 2025, the Global Agentic AI Governance Platform Market reached USD 7.3 billion. It will reach USD 203.2 billion by 2035, growing at a CAGR of 39.5% from 2026 to 2035. North America leads the market with a 36.5% share and USD 2.7 billion in revenue.
The OECD reported that 20.2% of firms used AI in 2025, up from 14.2% in 2024 and 8.7% in 2023. That means adoption more than doubled in two years. Big firms lead the shift. 52% of large firms used AI in 2025, compared with 17.4% of small firms. In the ICT sector, 57.3% of firms used AI. Each new AI agent that a firm puts to work needs rules, audit trails, and live monitoring.
North America region hosts the biggest AI platform vendors and their largest customers. Palantir’s 10-K filing shows the company earned 74% of its 2025 revenue from US customers. US government revenue rose to $1.9 billion from $1.2 billion in 2024. Microsoft’s FY2025 annual report shows its research and development spending rose by $3.0 billion, or 10%, driven by cloud and AI engineering. Big home-market buyers and heavy vendor spending keep the region ahead.
Key Takeaways
- The Global Agentic AI Governance Platform Market reached USD 7.3 billion in 2025 and will reach USD 203.2 billion by 2035. grow at a CAGR of 39.5% from 2026 to 2035.
- By component, Software/Platform leads with an 81.2% share.
- By deployment, Cloud-based leads with a 68.5% share.
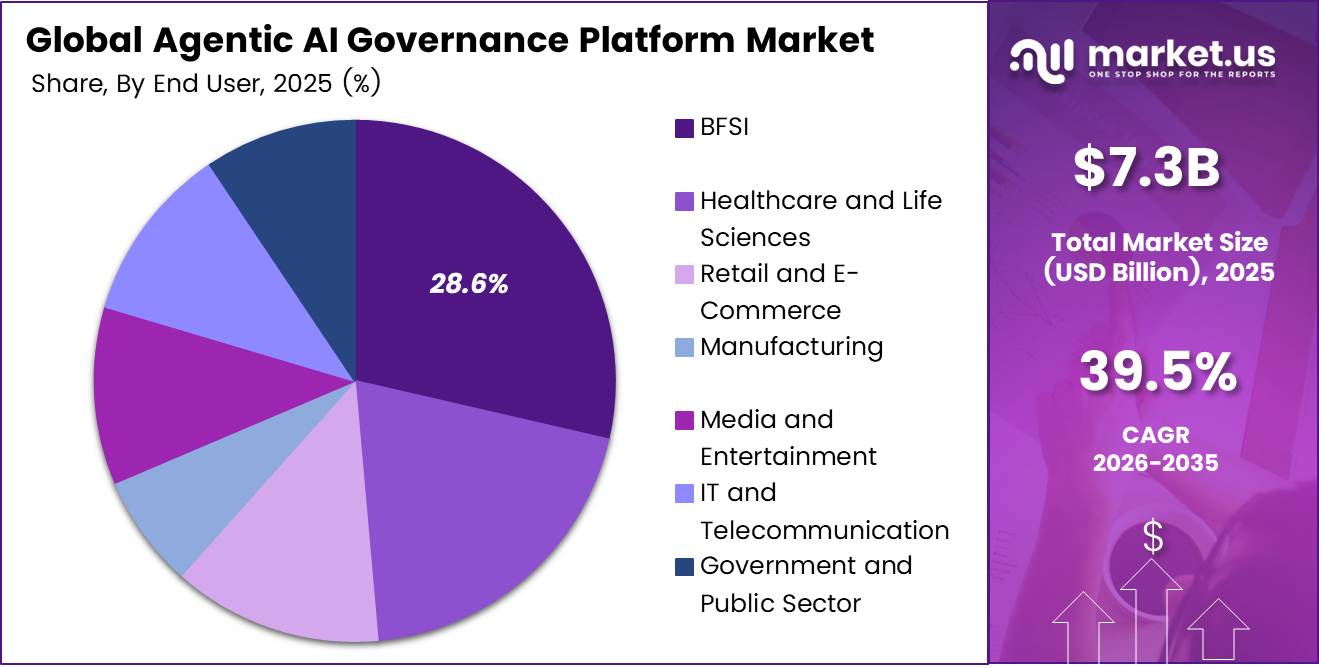
- By end-user industry, BFSI leads with a 28.6% share.
- By governance function, Policy Management and Compliance leads with a 27.9% share.
- North America leads with a 36.5% share, worth USD 2.7 billion in revenue.
By Component
Software/Platform dominates with 81.2% due to centralized controls simplifying enterprise agent oversight.
Software/Platform holds the leading share because companies need one control layer for many autonomous agents. A platform can keep policies, approvals, model records, audit logs, access rules, and risk scores in one place. This setup helps security, legal, data, and business teams follow the same rules while agents act across many workflows.
IBM reported $29.96 billion in software revenue for 2025, which shows the large buying base for enterprise software that can carry governance tools. Its generative AI book of business also passed $12.5 billion, widening demand for controls that work at scale.
Accenture recorded $37.64 billion in consulting bookings during fiscal 2025, while its generative AI bookings reached $5.9 billion. Those figures signal a strong pipeline for setup, change support, and managed governance. Software gives customers the common engine, but services help them adapt that engine to laws, company rules, and complex agent actions.
By Deployment
Cloud-based dominates with 68.5% due to rapid scaling across distributed agent workloads.
Cloud-based deployment leads because agentic AI systems need quick setup, elastic computing, frequent updates, and links to many data tools. Cloud vendors can deliver shared policy libraries, identity controls, logs, dashboards, and model checks without long hardware projects. This model lets global teams govern agents from one console and add capacity when use rises.
Microsoft reported that Azure passed $75 billion in fiscal 2025 revenue and grew 34%, showing how strongly enterprises buy cloud and AI services. This installed base makes cloud delivery the easiest path for governance vendors and customers. Red Hat found that 73% of 1,200 surveyed IT professionals followed a hybrid strategy in 2025. It also found that 71% of business-critical deployments spanned data centers and public clouds.
By End User Industry
BFSI dominates with 28.6% due to strict controls governing high-risk financial decisions.
BFSI leads because banks, insurers, and payment firms face strict rules, heavy audit needs, large data flows, and direct financial risk. They use AI for fraud checks, customer support, credit work, trading and internal operations, so autonomous agents create an urgent need for clear ownership and strong controls.
A 2024 Bank of England and FCA survey found that 75% of responding financial firms already used AI, while another 10% planned adoption within three years. The same survey found that 84% had an accountable person for their AI framework. These mature control structures support early spending on agentic AI governance platforms.
By Governance Function
Policy Management and Compliance dominates with 27.9% due to enterprise rules demanding centralized compliance control.
Policy Management and Compliance leads because every agent needs clear rules before it can act, call tools, use data, or make a choice. Companies want one place to turn laws, internal standards, approval limits, and staff duties into controls that agents follow. This function creates audit records and gives leaders a common view across models and vendors.
NIST organizes its AI Risk Management Framework around 4 core functions: govern, map, measure, and manage. NIST makes governance a cross-cutting function, which supports policy tools as the starting point for risk work. The EU AI Act can impose fines of up to €35 million or 7% of worldwide annual turnover for some violations.
Key Market Segments
By Component
- Software/Platform
- Services
By Deployment
- Cloud-based
- Hybrid
- On-Premises
By End User Industry
- BFSI
- Healthcare and Life Sciences
- Retail and E-Commerce
- Manufacturing
- Media and Entertainment
- IT and Telecommunication
- Government and Public Sector
- Other
By Governance Function
- Policy Management and Compliance
- Bias and Fairness Monitoring
- Explainability and Transparency
- Security and Privacy
- Risk and Incident Management
- Performance and Drift Monitoring
- Other
Geopolitical Impact Analysis
Agentic AI governance platforms run on chips, servers, and data centres that move through tense trade routes. AI hardware dominates world trade flows. The WTO reported that goods trade grew 4.6% in 2025, and AI-related products such as semiconductors and processors made up 42% of that growth.
Trade rules are also splitting apart. The WTO noted that trade under standard MFN terms fell to 72% of global flows. The WTO also forecast that goods trade growth would slow to 1.9% in 2026 because of tariffs, high energy prices, and choke points such as the Strait of Hormuz. First-quarter growth still ran at 3.2%. When fewer goods move under standard terms, vendors pay more for the GPU servers behind hosted governance tools.
Shipping disruption adds delay and cost to hardware rollouts. UNCTAD found that container tonnage crossing the Suez Canal fell 82% by February 2024 for the largest ships. The IMF measured a 50% drop in total Suez trade volume in early 2024. Rerouting ships around the Cape of Good Hope adds 10 to 14 days to the trip from Asia to Europe.
These delays slow server deliveries to European data centres. In turn, buyers lean toward hybrid setups that reuse hardware they already own. Energy risk also raises operating costs. The IEA expects data centre power use to rise from 485 TWh in 2025 to about 950 TWh by 2030. Any Middle East energy shock therefore lifts the cost of running agent monitoring at scale.
Regional Analysis
North America dominates the Agentic AI Governance Platform Market, holding a 36.5% share and generating USD 2.7 billion in revenue. The US gives the region its edge. It hosts the cloud, data, and workflow vendors that build governance into their AI platforms. US enterprises also deploy AI agents faster than buyers in most other markets. Infrastructure growth shows the scale of this demand.
The IEA expects US data centre electricity use to rise by up to 240 TWh by 2030, a 130% jump from 2024 levels. The IEA also projects that data centres will drive almost half of US electricity demand growth over that period. Palantir offers a clear example of commercial demand. Its US commercial revenue grew 109% in 2025 to $1.465 billion.
Asia Pacific is the fastest-growing region in the Agentic AI Governance Platform Market. China drives most of the build-out. The IEA expects Chinese data centre power use to grow by 175 TWh by 2030, a 170% increase from 2024. Japan should add about 15 TWh, an increase of more than 80%. India, South Korea and Australia are adding AI capacity in banking, telecom and public services.
Europe holds a strong second position, driven by strict data and AI rules. Germany, France and the UK lead regional spending, while Spain and Italy grow from a smaller base. The IEA expects European data centre power use to grow by 45 TWh by 2030, a 70% increase. European buyers put strong weight on explainability, privacy, and compliance tools.
Key Regions and Countries
North America
- US
- Canada
Europe
- Germany
- France
- The UK
- Spain
- Italy
- Rest of Europe
Asia Pacific
- China
- Japan
- South Korea
- India
- Australia
- Rest of APAC
Latin America
- Brazil
- Mexico
- Rest of Latin America
Middle East and Africa
- GCC
- South Africa
- Rest of MEA
Market Dynamics
Drivers
| Driver | (~) % Impact on CAGR Forecast | Geographic Relevance | Impact Timeline |
|---|---|---|---|
| AI regulatory enforcement | +1.8% | Europe and global exporters | Short term (2 years or less) |
| Enterprise agent deployment | +1.5% | Global | Short term (2 years or less) |
| Rising AI incident frequency | +1.2% | Global | Short term (2 years or less) |
| Standard-aligned procurement | +0.9% | North America, Europe and APAC | Medium term (2 to 4 years) |
| Cyber-insurance scrutiny | +0.8% | North America and Europe | Medium term (2 to 4 years) |
| BYOAI control demand | +0.6% | Global enterprises | Short term (2 years or less) |
AI regulatory enforcement
The European Commission records the AI Act’s entry into force. Governance and general-purpose-model obligations apply, along with enforcement and transparency requirements. Certain violations carry penalties of up to €15 million or 3% of worldwide annual turnover. This converts governance from discretionary consulting into a funded operating requirement.
NIST’s 26 July 2024 generative-AI profile and ISO/IEC 42001:2023 further established lifecycle governance, documented controls, and continual improvement as recognized procurement baselines. This accelerates the shift from one-time assessments toward recurring software subscriptions for inventories, policy enforcement, evidence capture, and incident reporting.
Stanford HAI reports that organizational AI adoption rose from 78% in 2024 to 88% in 2025. Documented incidents increased from 233 to 362 over the same period. Anchored to these adoption and enforcement milestones, the modeled +1.8% contribution to the stated 39.5% baseline reflects recurring platform conversion. It does not assume that every AI deployment immediately purchases full governance coverage.
Restraints
| Restraint | (~) % Impact on CAGR Forecast | Geographic Relevance | Impact Timeline |
|---|---|---|---|
| Unproven governance ROI | -2.1% | Global | Short term (2 years or less) |
| Undefined agent liability | -1.7% | North America and APAC | Medium term (2 to 4 years) |
| Sovereign data barriers | -1.4% | Europe, China, India and Middle East | Medium term (2 to 4 years) |
| Lengthy enterprise procurement | -1.1% | Global enterprises | Short term (2 years or less) |
| SME affordability ceiling | -0.9% | Global SMEs and emerging markets | Medium term (2 to 4 years) |
| Workforce consultation delays | -0.7% | Europe and unionized industries | Short term (2 years or less) |
Unproven governance ROI
The OECD identifies advance estimation of AI return on investment as the most frequent adoption obstacle, cited by 62% of manufacturers and 56% of information-and-communications enterprises. This makes governance especially vulnerable when buyers classify it as overhead rather than as a production control.
Stanford HAI reports overall organizational AI use at 88% in 2025, but agent deployment stays in the single digits across nearly all business functions. An MIT CISR survey of 152 enterprises also found that organizations confined to pilots and capability-building produced below-industry-average financial performance.
The modeled -2.1% drag therefore reflects current sales lost to proof-of-value cycles, narrower initial seat counts and postponed capital expenditure. Vendors absorb integration and evaluation work, which can compress early-account gross margins.
Challenges
| Challenge | (~) % CAGR Friction Drag | Geographic Relevance | Mitigation Horizon |
|---|---|---|---|
| Autonomous agent attack surface | -2.0% | Global | Long term (4 years or more) |
| Continuous evaluation drift | -1.6% | Global | Long term (4 years or more) |
| Governance talent scarcity | -1.4% | Global | Medium term (2 to 4 years) |
| Legacy workflow integration | -1.2% | Global enterprises | Medium term (2 to 4 years) |
| Cascading multi-agent errors | -1.0% | Global | Long term (4 years or more) |
| Model-release control churn | -0.8% | Global | Short term (2 years or less) |
Autonomous agent attack surface
The UK government’s AI-security review found significant gaps around agent security, tool access, and inter-agent communication. It recorded a 216% year-over-year increase in agentic-security papers during 2025 and anticipated widespread deployment within 2 to 3 years.
NIST’s 2026 identity-and-authorization work highlights unresolved requirements for agent identification, authorization, auditing, non-repudiation, and prompt-injection defenses. OWASP’s peer-reviewed framework, developed with more than 100 contributors, enumerates 10 critical risk classes, including goal hijacking, tool misuse, privilege abuse, and cascading failures.
The resulting -2.0% friction drag reflects persistent engineering expenditure rather than a sales freeze. Enterprises must add deterministic policy gateways, least-privilege credentials, transaction-level approvals, sandboxing, kill paths, and continuous red-team testing. This raises implementation hours and support intensity until agent identity and authorization protocols mature.
Opportunities
| Opportunity | (~) % Potential CAGR Upside | Geographic Relevance | Execution Window |
|---|---|---|---|
| Vertical governance control packs | +1.6% | North America, Europe and APAC | Medium term (2 to 4 years) |
| Embedded OEM governance APIs | +1.3% | Global | Medium term (2 to 4 years) |
| Continuous assurance exchanges | +1.1% | Global regulated industries | Long term (4 years or more) |
| Governance telemetry monetization | +0.9% | Global enterprises | Medium term (2 to 4 years) |
| Point-tool M&A roll-ups | +0.8% | North America and Europe | Medium term (2 to 4 years) |
| Localized emerging-market editions | +0.7% | Asia, Africa and Latin America | Long term (4 years or more) |
Vertical governance control packs
This remains future white space rather than a current driver. Stanford HAI reports generative AI in at least one business function at 70% of organizations, but agent deployment stays in the single digits across nearly every function. This leaves healthcare, financial services, industrial operations, and government without mature, repeatable agent-control configurations.
The OECD reports core-business AI adoption below 10% across G7 countries in 2024 and finds that 50% of surveyed SMEs lack employee skills for generative AI. The World Bank reports only about 40% adoption among sampled frontier firms in emerging markets. It identifies high cloud costs, regulatory complexity, and workflow integration as sector-specific impediments.
The OECD’s observed productivity premium of more than 4%, and in some settings above 15%, serves as an external operating benchmark rather than a revenue forecast. Reusable sector taxonomies, pre-mapped evidence templates and certified workflow connectors could plausibly support 4% to 7% gross-margin expansion and a 15% to 25% reduction in implementation cost per governed workflow.
This underpins the modeled +1.6% upside, which holds if vendors deliberately productize these packs instead of continuing bespoke, consulting-heavy deployments.
Key Players Analysis
Tier 1 leaders pair huge revenue bases with deep AI budgets. Microsoft grew Microsoft Cloud revenue 23% to $168.9 billion in FY2025, with Azure up 34% and the Intelligent Cloud segment adding $18.8 billion, a 21% rise. Google, AWS, Oracle and SAP complete this tier with cloud scale and large enterprise customer bases.
IBM earned $29.96 billion in software revenue in 2025, up 10.6%. It raised R&D spending 11.2% to $8.32 billion to fund AI, hybrid cloud, and quantum work. Its Automation unit brought in $6.56 billion and its Data unit $5.63 billion, while watsonx.Governance now tracks AI agents from development through deployment.
Tier 2 challengers win through focus and fast growth. Palantir generated $4.48 billion in 2025 revenue, up 56%, and served 954 customers. Government customers made up 54% of its revenue, which shows strong pull from regulated buyers.
ServiceNow uses M&A to build its AI control tower, agreeing to buy Armis for $7.75 billion in cash. Armis reported $340 million in annual recurring revenue at a $6.1 billion valuation, so the deal priced in a 27% premium. SAS, HPE, Meta, Clarifai, and DataRobot compete in niche areas such as model risk, open models, and MLOps monitoring.
Top Key Players in the Market
- International Business Machines Corporation
- Microsoft Corporation
- Alphabet Inc. (Google LLC)
- Amazon.com Inc. (Amazon Web Services)
- SAS Institute Inc.
- SAP SE
- Oracle Corporation
- Hewlett Packard Enterprise Company
- ServiceNow Inc.
- Meta Platforms Inc.
- Palantir Technologies Inc.
- Clarifai Inc.
- DataRobot Inc.
Recent Developments
- In March 2026, Google completed its $32 billion Wiz acquisition after US approval in November 2025 and EU approval in February 2026, and folded Wiz into Google Cloud. Google announced an agreement to acquire cloud and AI security platform Wiz for $32 billion in cash, the largest deal in its history.
- In March 2026, IBM completed its roughly $11 billion Confluent acquisition, adding a platform used by more than 6,500 enterprises, including 40% of the Fortune 500, and linking it to watsonx. data. IBM agreed to acquire data streaming platform Confluent for $31 per share in cash, an enterprise value of about $11 billion, to help firms govern data for AI agents.
Report Scope
| Report Features | Description |
|---|---|
| Market Value (2025) | USD 7.3 Billion |
| Forecast Revenue (2035) | USD 203.2 Billion |
| CAGR (2026-2035) | 39.5% |
| Base Year for Estimation | 2025 |
| Historic Period | 2020-2024 |
| Forecast Period | 2026-2035 |
| Report Coverage | Revenue Forecast, Market Dynamics, Competitive Landscape, Recent Developments |
| Segments Covered | By Component (Software/Platform, Services); By Deployment (Cloud-based, Hybrid, On-Premises); By End User Industry (BFSI, Healthcare and Life Sciences, Retail and E-Commerce, Manufacturing, Media and Entertainment, IT and Telecommunication, Government and Public Sector, Other); By Governance Function (Policy Management and Compliance, Bias and Fairness Monitoring, Explainability and Transparency, Security and Privacy, Risk and Incident Management, Performance and Drift Monitoring, Other) |
| Regional Analysis | North America – US, Canada; Europe – Germany, France, The UK, Spain, Italy, Rest of Europe; Asia Pacific – China, Japan, South Korea, India, Australia, Singapore, Rest of APAC; Latin America – Brazil, Mexico, Rest of Latin America; Middle East & Africa – GCC, South Africa, Rest of MEA |
| Competitive Landscape | International Business Machines Corporation, Microsoft Corporation, Alphabet Inc. (Google LLC), Amazon.com Inc. (Amazon Web Services), SAS Institute Inc., SAP SE, Oracle Corporation, Hewlett Packard Enterprise Company, ServiceNow Inc., Meta Platforms Inc., Palantir Technologies Inc., Clarifai Inc., DataRobot Inc. |
| Customization Scope | We will provide customization for segments and region/country levels. Additional customization can be done based on requirements. |
| Purchase Options | We have three licenses to opt for: Single User License, Multi-User License (Up to 5 Users), Corporate Use License (Unlimited Users and Printable PDF) |





























