
Quick Navigation
Report Overview
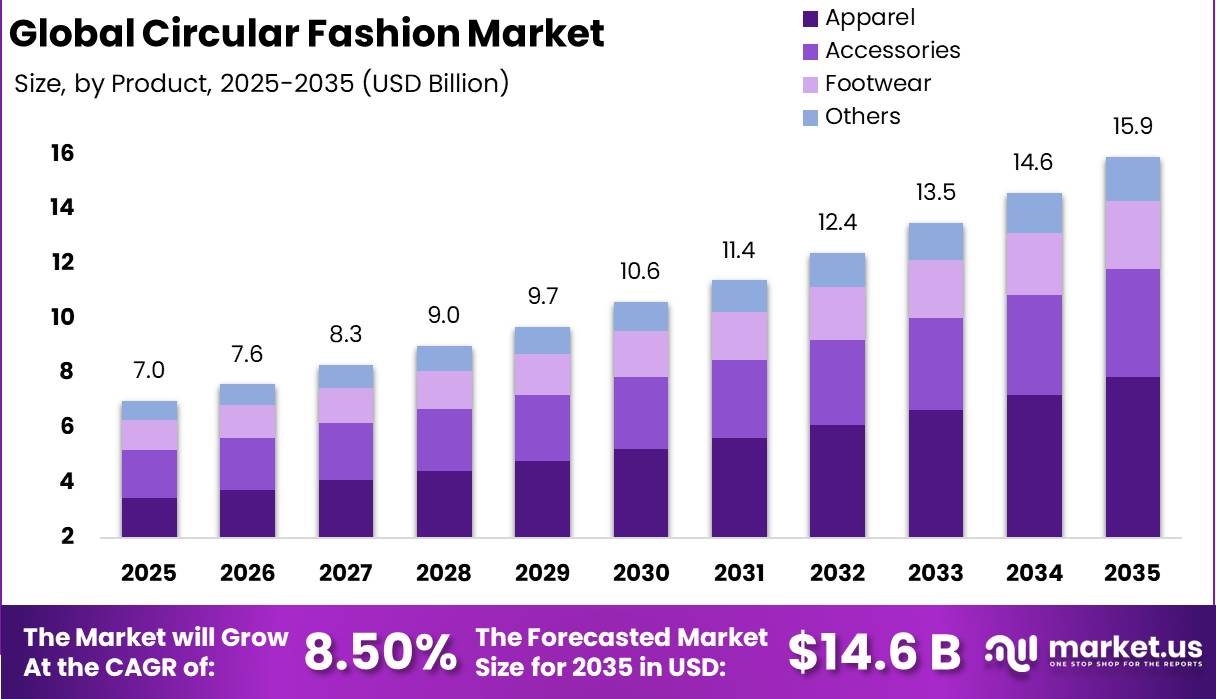
Global Circular Fashion Market size is expected to be worth around USD 14.6 Billion by 2035 from USD 7.0 Billion in 2025, growing at a CAGR of 8.50% during the forecast period 2026 to 2035.
The circular fashion market covers apparel, accessories, and footwear designed for extended product life through resale, repair, recycling, and reuse. This market spans multiple distribution channels, end-user categories, and textile sourcing types. Its structure includes both brand-led take-back programs and independent resale platforms operating across digital and physical retail environments.
Key Takeaways
- Market size in 2025 stands at USD 7.0 Billion, projected to reach USD 14.6 Billion by 2035.
- The market grows at a CAGR of 8.50% during the forecast period 2026 to 2035.
- Apparel leads By Product Type with a 49.40% share in 2025.
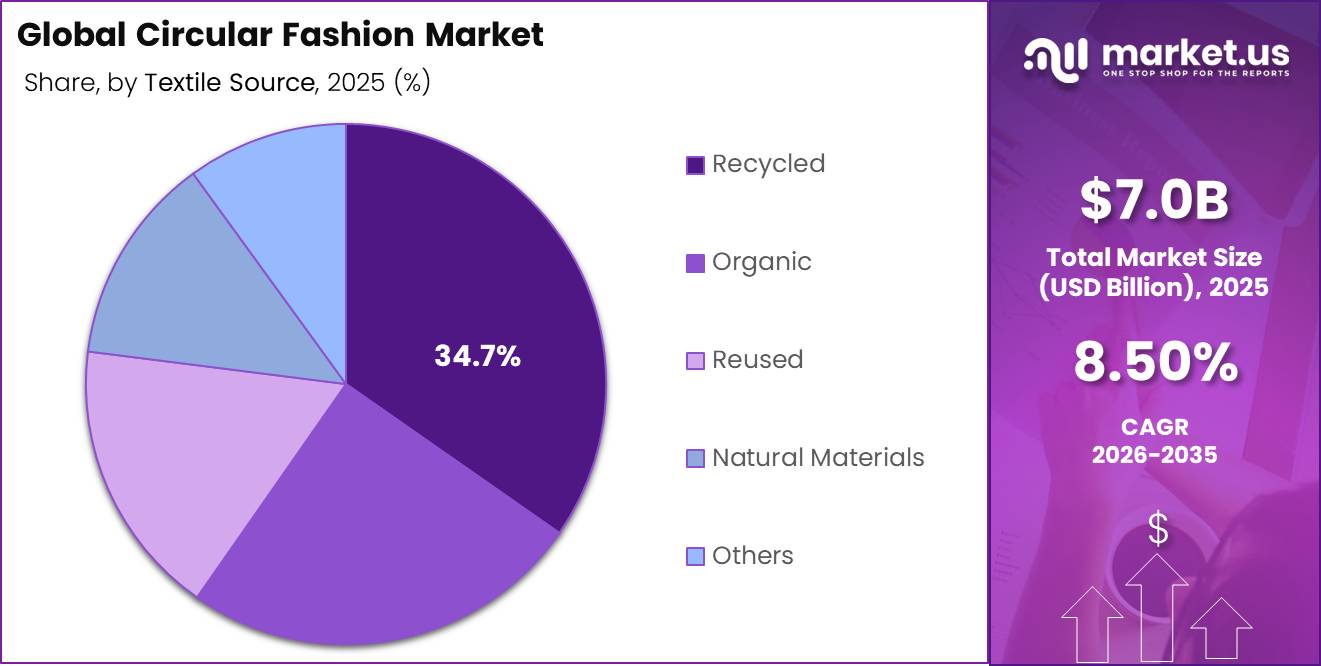
- Recycled textile source leads By Textile Source with a 34.70% share in 2025.
- Female end-users account for the largest share at 46.50% By End-User in 2025.
- Online distribution dominates By Distribution Channel with a 67.30% share in 2025.
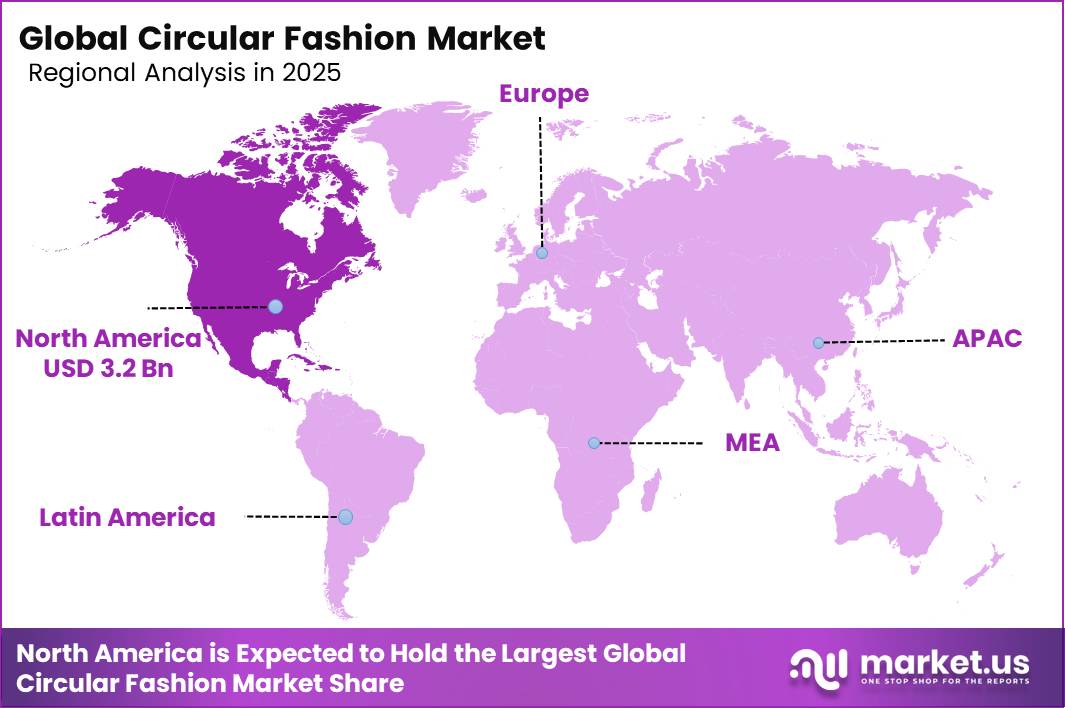
- North America leads regional share at 45.7%, valued at USD 3.2 Billion in 2025.
Government policy is reshaping supply chain obligations for fashion brands at scale. The EU Ecodesign for Sustainable Products Regulation mandates durability, repairability, and recycled-content disclosures for apparel sold after 2024. From 19 July 2026, large EU companies are prohibited from destroying unsold apparel, footwear, and accessories. These rules create direct compliance pressure that shifts circular infrastructure from optional to operationally required.
According to the European Environment Agency, an estimated 4 to 9% of all textile products placed on the European market are destroyed without ever serving their intended purpose. This destruction represents recoverable economic value that circular models can redirect into resale, repair, or recycling channels. Brands that build recovery infrastructure ahead of regulatory deadlines will reduce write-off costs and access secondary revenue streams before competitors.
Data from the European Environment Agency shows about 20% of clothing bought online in Europe is returned, and roughly one third of those returned garments are destroyed rather than resold or reused. In June 2025, Syre announced launch partnerships with Gap Inc., Houdini Sportswear, and Target to scale textile-to-textile recycled polyester supply. This signals that major brands are actively building closed-loop sourcing infrastructure to absorb returned and surplus inventory.
Product Type Analysis
Apparel dominates with 49.40% due to high volume, resale demand, and policy focus.
In 2025, Apparel held a dominant market position in the By Product Type segment of the Circular Fashion Market, with a 49.40% share. Fast fashion production generates 2.5 to 5 billion surplus garments annually, with large volumes ending in landfill or incineration. This surplus creates a structural supply base for resale and recycling platforms, making apparel the most commercially viable entry point for circular business models.
Accessories hold a 25.00% share in the circular fashion market. This category includes handbags, belts, and jewelry items that carry high resale value relative to their material weight. Premium accessories attract strong secondary market demand, particularly among luxury and near-luxury consumers, making this segment economically attractive for brands building in-house resale infrastructure.
Footwear accounts for a 15.60% share of the circular fashion market. Footwear circularity is constrained by complex multi-material construction that makes disassembly and fiber recovery technically difficult. Brands that invest in mono-material shoe design or modular construction will gain a structural advantage in footwear resale and recycling programs as regulatory scrutiny on end-of-life product management increases.
Textile Source Analysis
Recycled dominates with 34.70% due to policy alignment and cost competitiveness of recycled fibers.
In 2025, Recycled held a dominant market position in the By Textile Source segment of the Circular Fashion Market, with a 34.70% share. Figures from the European Environment Agency show textile waste sent to landfill in Europe dropped from 21% in 2010 to 12% in 2022, reflecting a structural shift toward material recovery. This trajectory increases feedstock availability for recycled fiber production and strengthens the supply economics for brands committed to recycled input targets.
Organic textiles hold a 25.00% share in the circular fashion market. Organic sourcing appeals to consumers seeking lower chemical impact in fabric production. However, organic fiber supply remains constrained by certified land availability and yield limitations, which caps how quickly this sub-segment can scale relative to recycled alternatives.
Reused textiles account for a 17.30% share within the By Textile Source segment. As reported by the European Environment Agency, EU exports of used textiles nearly tripled from approximately 550,000 tonnes to about 1.4 million tonnes between 2000 and 2019. This volume growth confirms that reused textile flows are large enough to support structured commercial operations, including grading, sorting, and regional distribution networks.
End-User Analysis
Female dominates with 46.50% due to higher purchase frequency and resale platform engagement.
In 2025, Female held a dominant market position in the By End-User segment of the Circular Fashion Market, with a 46.50% share. Gen Z women represent a particularly active buyer group, with Gen Z consumers purchasing over 40% of secondhand fashion online. Platforms that target this cohort with curated, condition-graded listings and social discovery features will retain higher repeat purchase rates than those operating on generic catalog models.
The Kids segment occupies a structurally logical position in circular fashion. Children outgrow clothing faster than adults, creating predictable resale cycles with consistent quality for items worn only briefly. Brands that build dedicated kids resale channels or take-back programs can capture repeat parental purchasing while reducing per-unit acquisition costs across the product lifecycle.
The Male segment presents underpenetrated demand in circular fashion. Male consumers historically demonstrate lower engagement with secondhand apparel channels compared to female buyers. Brands entering this space with workwear, casualwear, or technical apparel categories can use circular models as a differentiated acquisition tool in a segment where resale competition remains limited. In July 2025, Goldwin Play Earth Fund invested in Ambercycle, supporting expansion of its molecular regeneration recycled polyester technology, signaling growing interest in performance-wear circularity that closely aligns with male consumer categories.
Distribution Channel Analysis
Online dominates with 67.30% due to platform scale, resale infrastructure, and Gen Z digital behavior.
In 2025, Online held a dominant market position in the By Distribution Channel segment of the Circular Fashion Market, with a 67.30% share. Apparel resale platforms are achieving double-digit GMV growth as Gen Z purchases over 40% of secondhand fashion through digital channels. This concentration of demand in online resale creates strong network effects, where larger platforms attract more sellers and buyers simultaneously, compressing the competitive window for new entrants.
Offline distribution retains a complementary role in circular fashion despite the dominance of digital channels. Physical take-back programs integrated into brand-owned retail locations provide a tangible touchpoint for consumers who prefer in-person product assessment before resale or recycling. Brands with established retail footprints hold a structural cost advantage in offline collection relative to standalone circular startups.
Key Market Segments
By Product Type
- Apparel
- Accessories
- Footwear
- Others
By Textile Source
- Organic
- Recycled
- Reused
- Natural Materials
- Others
By End-User
- Female
- Kids
- Male
- Unisex
By Distribution Channel
- Online
- Offline
Market Dynamics
Market Opportunity Analysis - Offline channels, male consumers, and emerging markets present underexploited entry points for circular fashion operators
Offline distribution holds a 32.70% share of the circular fashion market yet receives far less investment than online platforms. Physical take-back and resale infrastructure remains underdeveloped relative to the volume of garments consumers bring to stores. Brands with existing retail networks can convert store footprints into circular collection points at lower cost than building standalone logistics operations.
The male end-user segment is structurally underpenetrated in circular fashion. Male consumers engage with secondhand apparel at significantly lower rates than female buyers, leaving a wide gap between available inventory and active demand. Operators entering with workwear, technical apparel, or casualwear specifically curated for male purchasing behavior face limited direct competition in this sub-segment today.
Natural Materials holds a 13.00% share in the By Textile Source segment, making it one of the least commercially developed sourcing categories in the circular market. This sub-segment benefits from clean end-of-life recyclability compared to blended synthetics, but lacks the brand investment and processing infrastructure that recycled fiber has received. This creates an early-mover window for brands that build natural fiber recovery and certification programs ahead of incoming EU traceability requirements.
Latin America and the Middle East and Africa remain the least commercially structured circular fashion regions despite the existence of large informal textile reuse networks. These informal flows indicate real consumer willingness to engage with used clothing at scale. Operators that formalize collection, grading, and distribution in these regions can access underserved consumer bases while generating EPR-compliant material flows for global brand partners seeking diversified sourcing.
Technology and Innovation Landscape - Molecular recycling, AI sorting, and digital product passports define the next competitive layer in circular fashion
Molecular regeneration technology for recycled polyester represents a material breakthrough that addresses one of the core limitations of mechanical recycling. Goldwin Play Earth Fund’s July 2025 investment in Ambercycle specifically supports the commercial scaling of this approach. Brands that secure early offtake agreements with molecular recycling suppliers will lock in recycled fiber access before supply becomes constrained by competing demand from large apparel manufacturers.
AI-driven material sorting systems are improving post-consumer textile recycling yield rates by automating the identification and separation of fiber types that manual sorting misclassifies. Higher sorting accuracy reduces contamination in recycled feedstock, which directly improves the quality and commercial value of output fiber. This technology lowers the unit cost of recycled fiber production, making it more price-competitive against virgin inputs across standard apparel grades.
Digital product passports enable automated resale, repair, and recycling workflows by embedding product-level material and provenance data into a scannable format accessible across the supply chain. The EU is advancing DPP requirements as part of its Ecodesign regulation framework, creating a compliance deadline that functions as a commercial deployment trigger. Brands that implement DPP infrastructure ahead of regulatory requirements can monetize traceability data through premium resale pricing and verified sustainability claims.
Textile-to-textile recycled polyester at commercial scale is the output goal of Syre’s June 2025 supply partnerships with Gap Inc., Houdini Sportswear, and Target. These agreements demonstrate that offtake-backed circular supply chains are commercially viable at brand scale. This model, where brands commit to purchasing recycled fiber output before production begins, reduces investment risk for recycling technology developers and accelerates the timeline for industrial-scale circular feedstock availability.
Drivers
Resale and repair economics are becoming a growth catalyst as supportive policy measures improve the commercial viability of circular fashion models. A 2026 circular-economy assessment found that optimized policy frameworks could lift gross profit margins to as high as 55% for resale and 41 to 44% for repair activities. These figures reframe resale and repair as profit-generating operations rather than cost-absorbing sustainability programs.
Proposed measures include a 6% VAT rate on resale and repair services in the EU, elimination of sales tax on resale transactions in parts of North America, and reduced employer labour charges for resale and repair jobs. These changes help offset costs associated with cleaning, inspection, logistics, refurbishment, and labour-intensive repair work. Improved economics allow brands to invest in dedicated recommerce platforms, trade-in programs, repair networks, and omnichannel resale operations.
| Driver | (~) % Impact on CAGR Forecast | Geographic Relevance | Impact Timeline |
|---|---|---|---|
| EU textile policy enforcement | +2.5% | EU core, UK spill-over, export-linked APAC | Short term (≤ 2 years) |
| Resale and repair margin expansion | +2.1% | North America, EU, UK, premium Asia | Medium term (2-4 years) |
| DPP-led data transparency adoption | +1.8% | EU, UK spill-over, global supply bases | Medium term (2-4 years) |
| Rising textile consumption base | +1.6% | EU, North America, urban APAC | Medium term (2-4 years) |
| Unsold inventory destruction ban | +1.4% | EU, luxury hubs, sourcing corridors | Short term (≤ 2 years) |
| EPR-funded collection infrastructure | +1.7% | EU, North America policy-followers | Long term (≥ 4 years) |
Restraints
Unsold inventory monetization remains a significant challenge as fashion brands adapt to stricter circular economy regulations. From 19 July 2026, large EU companies are prohibited from destroying unsold apparel, footwear, and accessories, with standardized reporting requirements taking effect in February 2027. Many brands still lack sufficient resale, repair, donation, or recycling infrastructure to handle excess inventory efficiently under this new framework.
Seasonal overstock, failed collections, and returned products must now be stored, sorted, refurbished, redirected, or recycled rather than written off. This extends inventory holding periods and increases warehousing, logistics, and labor costs. Lower-priced products are particularly affected because processing expenses can exceed the value recovered from secondary channels, reducing operational flexibility and constraining brands experimenting with new collections.
| Restraint | (~) % Impact on CAGR Forecast | Geographic Relevance | Impact Timeline |
|---|---|---|---|
| High EPR compliance burden | -2.1% | EU core, UK spill-over, export APAC | Medium term (2-4 years) |
| Unsold inventory monetization gap | -1.8% | EU, luxury hubs, North America | Short term (≤ 2 years) |
| Weak low-value garment economics | -1.7% | EU, North America, fast-fashion Asia | Medium term (2-4 years) |
| Traceability system CapEx | -1.5% | EU, Turkey, North Africa, Asia | Medium term (2-4 years) |
| Sorting-quality mismatch | -1.3% | EU, UK, OECD textile markets | Long term (≥ 4 years) |
| Rising apparel throughput pressure | -1.1% | EU, North America, urban APAC | Long term (≥ 4 years) |
Challenges
Reverse logistics cost intensity remains a major operational barrier for circular fashion because returned garments must pass through collection, sorting, inspection, cleaning, repair, and redistribution before reuse. Industry discussions in 2025 highlighted persistent gaps in textile collection capacity, contamination management, and efficient routing of materials to appropriate end-of-life channels. Unlike traditional supply chains, reverse logistics relies on low-density pickups and multiple handling stages that are both labour-intensive and costly.
Many programs face per-item handling costs of several euros before any resale value is recovered, placing direct pressure on profitability. These costs are particularly difficult to absorb in lower-priced apparel categories where product margins are already thin. Brands frequently limit circular initiatives to selected high-margin categories as a result. Service fees introduced to offset logistics expenses can also reduce consumer participation rates across Europe, North America, and major APAC sourcing corridors.
| Challenge | (~) % CAGR Friction Drag | Geographic Relevance | Mitigation Horizon |
|---|---|---|---|
| Repair and resale skills gap | -1.9% | EU, UK, North America, Japan | Long term (≥ 4 years) |
| Reverse logistics cost intensity | -1.7% | EU, North America, APAC corridors | Medium term (2-4 years) |
| DPP data and systems complexity | -1.5% | EU regulatory hubs, global suppliers | Medium term (2-4 years) |
| Fragmented collection and sorting | -1.4% | EU, UK, emerging EPR markets | Long term (≥ 4 years) |
| Brand operational capability lag | -1.3% | Global brands, sourcing regions | Medium term (2-4 years) |
| Macro demand–sustainability tension | -1.1% | EU, North America, urban APAC | Long term (≥ 4 years) |
Opportunities
Repair-as-a-service is emerging as a commercially viable opportunity as consumers seek to extend garment life rather than replace products. Circular fashion research published in 2026 found that optimized repair models can improve gross profit margins by as much as 41%. Despite this potential, repair adoption remains low in mainstream apparel due to service friction, labour costs, and limited infrastructure, leaving substantial untapped margin for early movers.
Brands are investing in centralized repair hubs, regional tailoring networks, and app-based repair services to reduce this friction. Product categories including denim, outerwear, luxury fashion, children’s clothing, and technical apparel are particularly suited to repair programs due to longer usage cycles and higher replacement costs. Policy discussions around reduced VAT on repairs and labour-tax incentives in Europe are strengthening the business case for scalable repair services at a structural level.
| Opportunity | (~) % Potential CAGR Upside | Geographic Relevance | Execution Window |
|---|---|---|---|
| Branded resale profit stacks | +2.4% | North America core, EU, UK, urban APAC | Short term (≤ 2 years) |
| Repair-as-a-service scaling | +1.9% | EU, UK, North America, Japan | Medium term (2-4 years) |
| DPP-enabled traceability monetization | +1.7% | EU core, UK spill-over, premium APAC | Medium term (2-4 years) |
| Fiber-to-fiber premium loops | +2.1% | EU, North America, Nordics, East Asia | Long term (≥ 4 years) |
| Circular marketplace roll-ups | +1.6% | North America, EU, India, Southeast Asia | Medium term (2-4 years) |
| B2B recommerce infrastructure | +1.8% | EU, U.S., UK, GCC premium retail | Short term (≤ 2 years) |
Regional Analysis
North America Dominates the Circular Fashion Market with a Market Share of 45.7%, Valued at USD 3.199 Billion
North America holds the largest share of the circular fashion market at 45.7%, valued at USD 3.2 Billion in 2025. The region benefits from a mature e-commerce infrastructure, high smartphone penetration, and a strong Gen Z consumer base actively driving secondhand apparel adoption. Platform-led resale models have scaled rapidly across US urban centers, giving North American brands early operational experience in circular distribution that is difficult for newer regional entrants to replicate quickly.
Europe is the most regulation-driven circular fashion region globally. The EU Ecodesign for Sustainable Products Regulation, the incoming unsold inventory destruction ban effective July 2026, and extended producer responsibility frameworks collectively force brands to build structured circular infrastructure. This regulatory density accelerates adoption of take-back, repair, and recycling programs across European markets faster than in any other region.
Asia Pacific represents an operationally complex but commercially significant region for circular fashion. Countries such as China and India generate large textile waste volumes while simultaneously hosting major global sourcing operations. Our research indicates that brand-level Scope 3 emissions targets now cover over 70% of global apparel emissions, placing pressure on APAC-based manufacturers to adopt circular sourcing practices to remain on approved supplier lists for international brands.
Latin America and the Middle East and Africa regions show early-stage circular fashion activity. Informal textile collection and trading networks in these regions already handle large volumes of used clothing, creating a foundation that formal circular fashion operators can build on. However, limited policy frameworks and constrained formal resale infrastructure mean commercial scaling requires longer lead times compared to North America and Europe.
Key Regions and Countries
North America
- US
- Canada
Europe
- Germany
- France
- The UK
- Spain
- Italy
- Rest of Europe
Asia Pacific
- China
- Japan
- South Korea
- India
- Australia
- Rest of APAC
Latin America
- Brazil
- Mexico
- Rest of Latin America
Middle East and Africa
- GCC
- South Africa
- Rest of MEA
Key Company Insights
H&M operates one of the largest brand-owned garment take-back programs globally, positioning it as a volume leader in circular fashion infrastructure. This scale gives H&M direct access to post-consumer textile feedstock, reducing dependence on virgin fiber suppliers. However, 75% of global textile waste still reaches landfill, indicating that H&M’s take-back volumes remain insufficient to close the loop at the brand’s production scale.
Zara, operating under Inditex, has committed to using recycled and sustainably sourced materials across its product lines as part of its corporate sustainability framework. Zara’s vast store network provides a physical collection infrastructure that most digital-only circular competitors cannot replicate. Its challenge lies in scaling fiber-to-fiber recycling partnerships fast enough to absorb the blended textile volumes generated by its high-frequency production model.
Key Players
- H&M
- Zara
- Gap Inc.
- Gucci
- Nike
- Adidas
- Levi Strauss & Co.
- VF Corporation
- Prada
- Burberry
- Hermes
- Ralph Lauren
- PUMA
Recent Developments
- January 2026 – eBay expanded its Circular Fashion Fund programme to include businesses and startups across the EU, Switzerland, and Canada for the first time, broadening global participation in circular fashion innovation funding.
- May 2026 – Belgian startup Trosort won the global 2026 eBay Circular Fashion Fund, earning the opportunity to receive a USD 300,000 investment from eBay Ventures for its AI-powered textile sorting technology.
Report Scope
| Report Features | Description |
|---|---|
| Market Value (2025) | USD 7.0 Billion |
| Forecast Revenue (2035) | USD 14.6 Billion |
| CAGR (2026-2035) | 8.50% |
| Base Year for Estimation | 2025 |
| Historic Period | 2020-2024 |
| Forecast Period | 2026-2035 |
| Report Coverage | Revenue Forecast, Market Dynamics, Market Opportunity Analysis, Technology and Innovation Landscape, Competitive Landscape, Recent Developments |
| Segments Covered | By Product Type (Apparel, Accessories, Footwear, Others), By Textile Source (Organic, Recycled, Reused, Natural Materials, Others), By End-User (Female, Kids, Male, Unisex), By Distribution Channel (Online, Offline) |
| Regional Analysis | North America (US and Canada), Europe (Germany, France, The UK, Spain, Italy, and Rest of Europe), Asia Pacific (China, Japan, South Korea, India, Australia, and Rest of APAC), Latin America (Brazil, Mexico, and Rest of Latin America), Middle East and Africa (GCC, South Africa, and Rest of MEA) |
| Competitive Landscape | H&M, Zara, Gap Inc., Gucci, Nike, Adidas, Levi Strauss & Co., VF Corporation, Prada, Burberry, Hermes, Ralph Lauren, PUMA |
| Customization Scope | Customization for segments, region/country-level will be provided. Additional customization can be done based on requirements. |
| Purchase Options | We have three licenses to opt for: Single User License, Multi-User License (Up to 5 Users), Corporate Use License (Unlimited User and Printable PDF) |


