


Market Overview
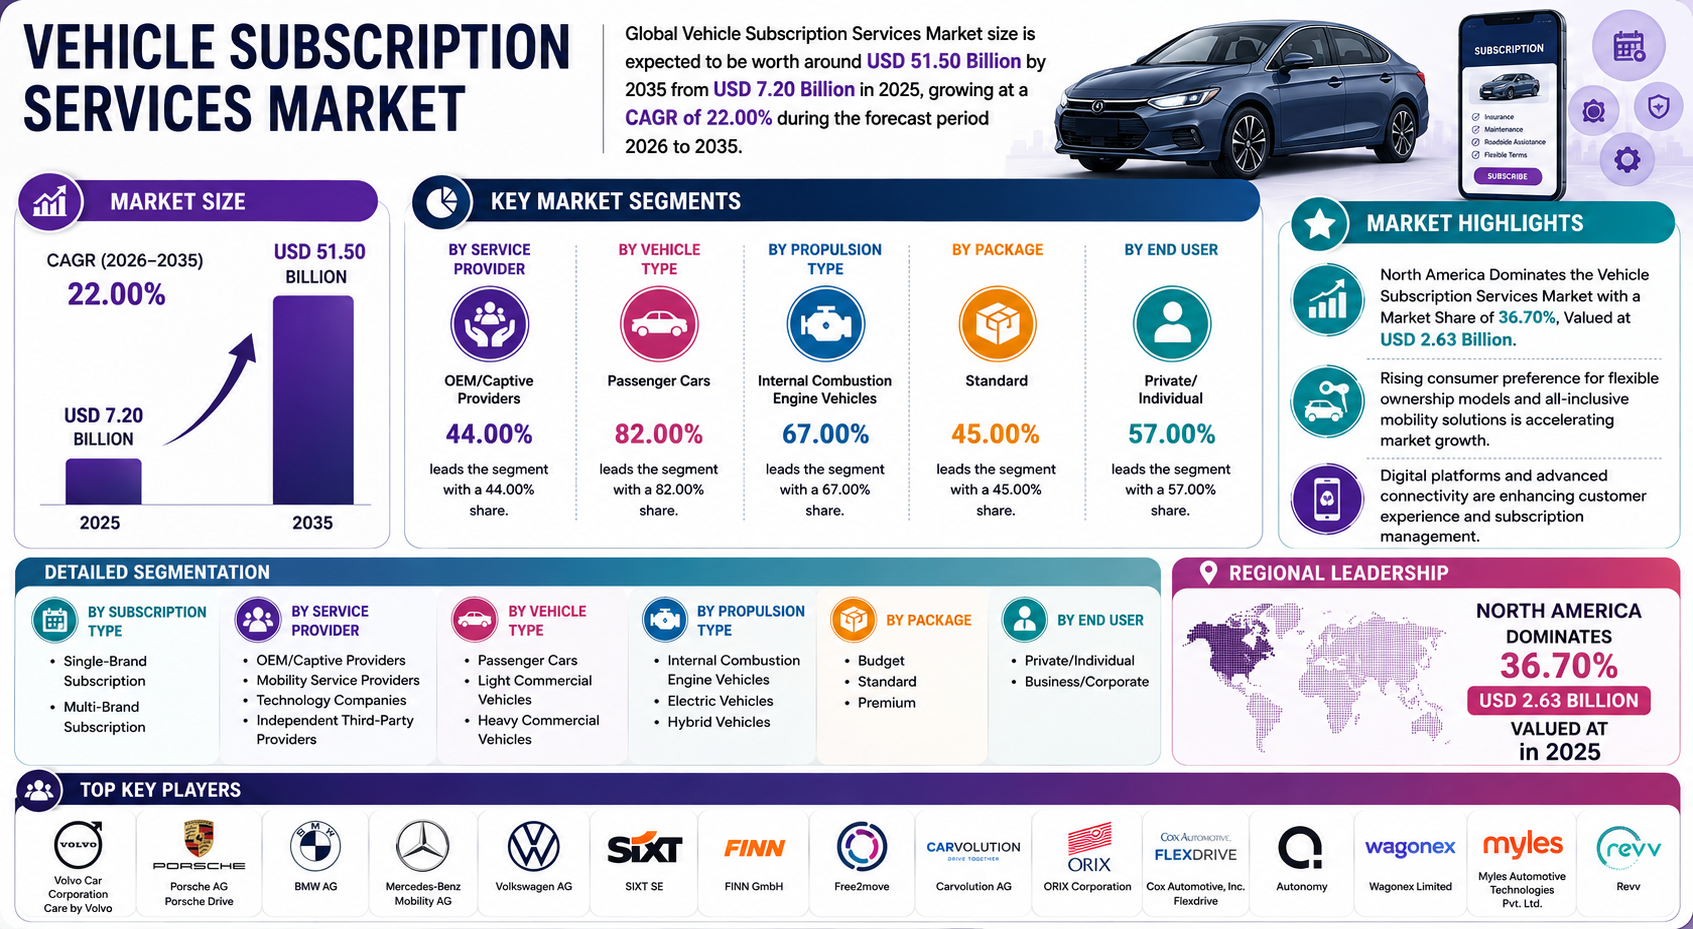
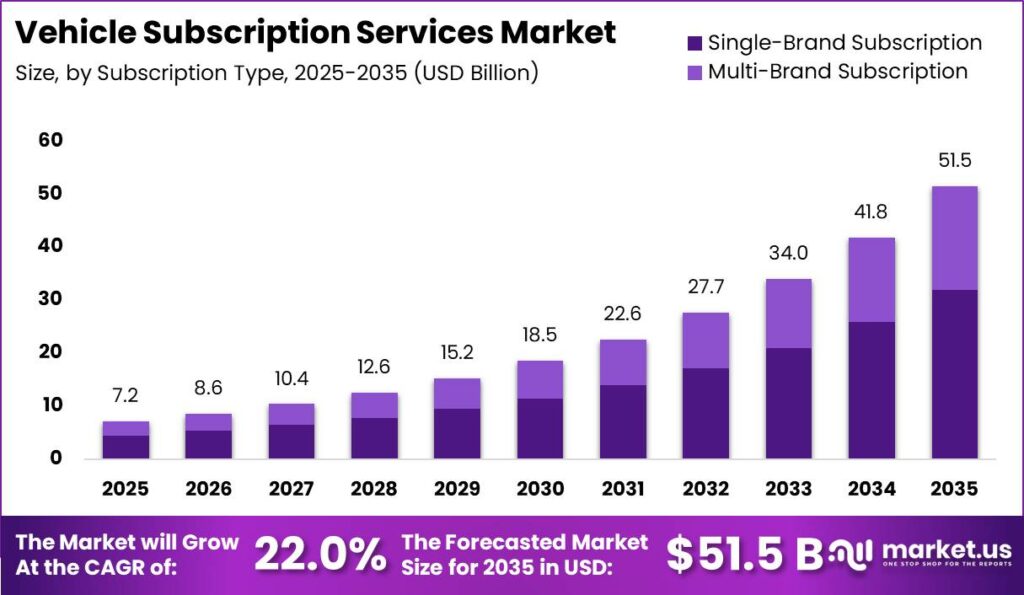
The Vehicle Subscription Services Market is valued at USD 7.20 Billion in 2025 and is projected to reach USD 51.50 Billion by 2035, growing at a CAGR of 22.00% over the forecast period 2026 to 2035. This expansion reflects a structural shift from vehicle ownership toward flexible access models that bundle insurance, maintenance, and digital support into a single monthly fee.
Vehicle subscription services are recurring contracts that give users temporary vehicle access without long-term financing commitments. Providers structure offers by brand scope, vehicle class, propulsion type, package tier, and end-user category. This architecture lets operators serve both private households seeking monthly flexibility and corporate buyers replacing owned fleets with usage-based contracts.
Private urban mobility, corporate fleet management, gig-economy delivery, and executive mobility programs are the primary sectors driving subscription demand. Passenger cars account for the dominant share of subscribed vehicles, anchored by daily commute and household flexibility needs. Light commercial vehicles add a growing B2B layer as small businesses and delivery platforms use short-term subscriptions to manage seasonal and project-driven vehicle needs.
Data-Driven Insights for Smarter Business Decisions: Explore the Full Report
Telematics-enabled dynamic pricing, in-app charging integration, and digital booking platforms are improving fleet utilization and subscriber retention for service providers. Free2move added approximately 300 Fiat 500e electric vehicles to its German fleet in March 2025 alongside in-app charging tools, raising retention among urban electric subscribers. These capability investments shift competitive advantage from vehicle inventory size to digital experience quality.
OEM captive-finance pivots, urban mobility bundling, and elevated household preference for monthly flexibility over multi-year loans reinforce the market’s high-growth trajectory. SIXT+ set a minimum U.S. subscription duration of 30 days in 2026, lowering entry friction for price-sensitive urban drivers who reject traditional lease commitments. Operators who match this flexibility capture private users faster than rigid lease competitors locked into annual contract structures.
The IEA projected global electric car sales to surpass 20 million units in 2025, a milestone that accelerates EV residual-value uncertainty and pushes consumers toward subscription access over outright purchase. FINN reported subscription terms spanning 6 to 24 months in 2026, a fourfold commitment range that allows providers to serve both short-cycle private buyers and longer-tenure corporate accounts within a single platform architecture.
Key Takeaways
- The market is valued at USD 7.20 Billion in 2025 and is projected to reach USD 51.50 Billion by 2035, growing at a CAGR of 22.00%.
- Single-Brand Subscription leads the Subscription Type segment with a 61.90% share, driven by OEM captive fleet control and brand-managed residual values.
- OEM/Captive Providers lead the Service Provider segment with a 44.00% share, converting one-time sale margins into recurring fee income.
- Passenger Cars lead the Vehicle Type segment with an 82.00% share, anchored by private urban commuting and household mobility demand.
- Internal Combustion Engine Vehicles lead the Propulsion Type segment with a 67.00% share, supported by clearer resale curves and established fleet financing.
- Standard packages lead the Package segment with a 45.00% share, offering balanced mileage and features without premium markups.
- Private/Individual users lead the End User segment with a 57.00% share, preferring monthly access over multi-year loan commitments.
- North America leads regionally with a 36.70% share valued at USD 2.63 Billion in 2025.
- FINN raised €140 million in a Series D round in June 2026 to expand its subscription platform, fleet operations, and technology infrastructure.
- IEA projected global EV sales to surpass 20 million units in 2025, amplifying residual-value uncertainty that pushes consumers toward subscription models.
Market Segmentation Overview
Single-Brand Subscription commands a 61.90% share of the subscription type segment in 2025. Captive OEM programs keep residual risk, pricing control, and brand experience within a single manufacturer stack. SIXT reported 2026 terms allowing automatic 30-day renewals up to 90 days, a structure that raises switch costs for loyal subscribers while protecting operator residual values on pooled inventory.
Multi-Brand Subscription attracts corporate users who rotate vehicle classes by project need and private buyers who prioritize model variety over brand loyalty. Platforms that aggregate multi-brand inventory allow one digital interface to cover several badges, reducing friction for switchers. This model creates a direct competitive lane for independent operators to challenge captive OEMs on convenience and selection breadth rather than badge prestige alone.
OEM/Captive Providers lead the service provider segment at 44.00%, converting fixed retail sale income into higher-margin recurring fee streams. SIXT data shows a one-time U.S. sign-up fee of USD 199 in 2026, a pricing structure that protects fleet warehousing costs while maintaining volume. Mobility Service Providers compete on digital booking speed and flexible pause rules, with Free2move adding 400 Opel Corsa vehicles to Berlin, Munich, and Frankfurt in February 2025 as a product benchmark for European urban digital fleets.
Passenger Cars dominate the vehicle type segment at 82.00%, reflecting private user preference for daily commute flexibility over commercial alternatives. Light Commercial Vehicles serve last-mile delivery and small-business fleets that need short access windows better suited to seasonal work than multi-year leases. Heavy Commercial Vehicles remain a smaller niche tied to specialized logistics contracts where fleet managers use short subscriptions to bridge peak demand without long-cycle capital commitments.
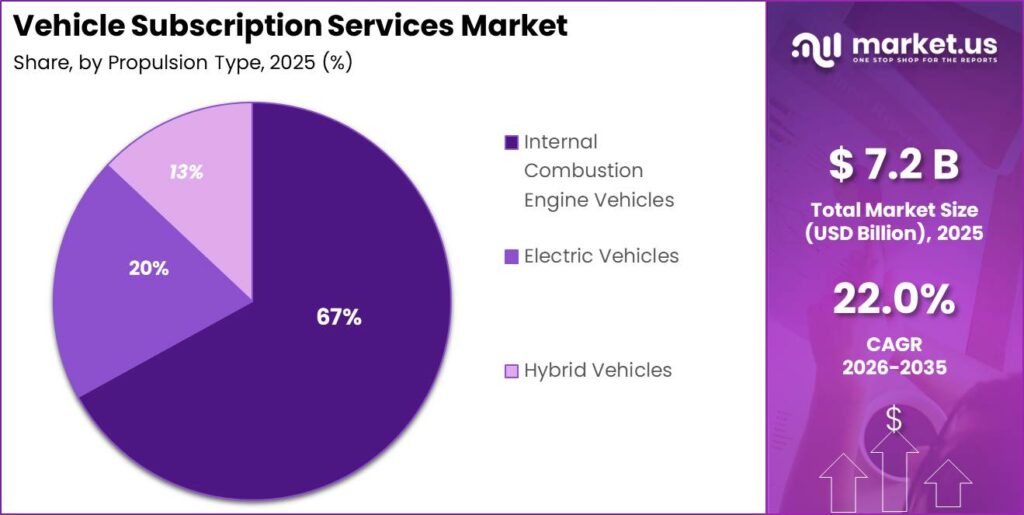
Internal Combustion Engine Vehicles hold a 67.00% propulsion share, as clearer resale value curves allow operators to price subscription months with lower residual risk. Electric Vehicles attract urban subscribers who want lower running costs and access without battery-depreciation exposure blocking outright purchase decisions. Hybrid Vehicles serve suburban users who need highway range without full charging infrastructure, giving fleet operators a staged path toward lower-emission pool composition over the forecast period.
Standard packages lead at 45.00%, offering balanced mileage allowances and feature sets without the markups of premium tiers. Volvo UK terms charge GBP 0.20 per excess mile above the stated allowance, a transparent pricing structure that protects operator margins while giving private users predictable monthly spend. Budget packages expand the addressable base among first-time subscribers, while Premium packages serve business users and high-income private buyers willing to pay for newer models, higher mileage, and concierge vehicle swap services.
Drivers
OEM captive-finance arms are shifting balance sheets from fixed retail loans toward recurring usage contracts, with company earnings disclosures showing subscription-linked volumes rising at double-digit rates year over year. OECD consumer-finance indicators confirm households prefer flexible monthly fees while benchmark interest rates remained elevated through 2025. This structural pivot lifts operator margin from one-time sale profit into higher-margin service attach revenue across new-vehicle placement channels.
EV residual-value volatility is pushing a growing share of consumers toward subscription access over outright vehicle purchase, as battery depreciation uncertainty makes ownership economics harder to model. Urban mobility-as-a-service bundling that packages insurance, maintenance, and charging credits into a single monthly fee removes the friction points that previously anchored buyers to conventional financing. These two forces combine to accelerate adoption well above baseline vehicle replacement growth rates across North America, Europe, and major Asia Pacific metro markets.
Use Cases
Private urban households subscribe to passenger car plans on monthly terms to replace multi-year loan commitments that no longer suit flexible work and relocation patterns. AMT Auto data shows UK mileage allowances ranging from 1,000 to 3,000 miles per month, a band that covers most daily commuting and weekend use without overage exposure. Operators who match plan mileage to real commute patterns cut overage friction and lift renewal rates among price-sensitive private subscribers.
Moreover, corporate mobility teams replace owned executive and project fleets with business subscription programs that eliminate residual risk and remove vehicle assets from company balance sheets. FINN’s 6 to 24 month term range in 2026 allows enterprise buyers to align subscription length with project timelines and headcount cycles. Providers who serve both private and corporate pools within a single platform diversify churn risk and anchor higher average revenue per user across the full subscriber base.
Major Challenges
Legacy insurance actuarial models built for annual named-driver policies fail when applied to rotating multi-driver subscription pools. Per-vehicle insurance loadings run an estimated 15% to 25% higher than owned-vehicle policies per insurer disclosures, raising subscriber prices and slowing conversion in price-sensitive markets. Industry committees flag a 2 to 4 year horizon to normalize loss ratios as telematics risk-scoring engines and fleet-block insurance treaties mature.
However, fleet reconditioning and turnaround talent shortages in North America and Europe limit how quickly operators can return subscribed vehicles to pool-ready condition between users. Extended reconditioning cycles increase idle days, reduce utilization rates, and compress per-unit margins on pools that rely on high turnover to sustain unit economics. Operators who invest in standardized inspection workflows and certified reconditioning partnerships gain a durability advantage over rivals absorbing unplanned idle cost.
Business Opportunities
Regional dealer networks in emerging markets still rely on paper-based leasing and lack the telematics infrastructure needed to run modern subscription programs. Platform providers who license turnkey subscription software and financing on a revenue-share model can capture platform gross margins of 35% to 45% versus 15% to 20% for direct fleet ownership, without requiring warehouse capital expenditure. Dealer-side customer acquisition cost per subscriber could fall 20% to 30% versus greenfield launches per automotive retail tech benchmarks.
Additionally, embedding subscription vehicle access within ride-hailing and delivery super-apps in Asia Pacific and Latin America creates a new demand channel that reaches gig workers who need short-cycle access tied directly to income-generating platform activity. Corporate mobility-as-a-benefit rollups that package subscription vehicles into enterprise employee benefit programs add a recurring enterprise revenue layer with lower churn than individual private accounts. Early movers who secure platform integration agreements and enterprise contracts before OEM captives fully localize their stacks gain durable structural advantages.
Regional Analysis
North America dominates the Vehicle Subscription Services Market with a 36.70% share valued at USD 2.63 Billion in 2025. Dense urban demand, mature captive-finance distribution channels, and strong household preference for monthly flexibility over long financing terms anchor this lead position. California-style regulatory pressure on ICE ownership and high digital booking adoption rates further concentrate subscription growth across major U.S. and Canadian metro markets.
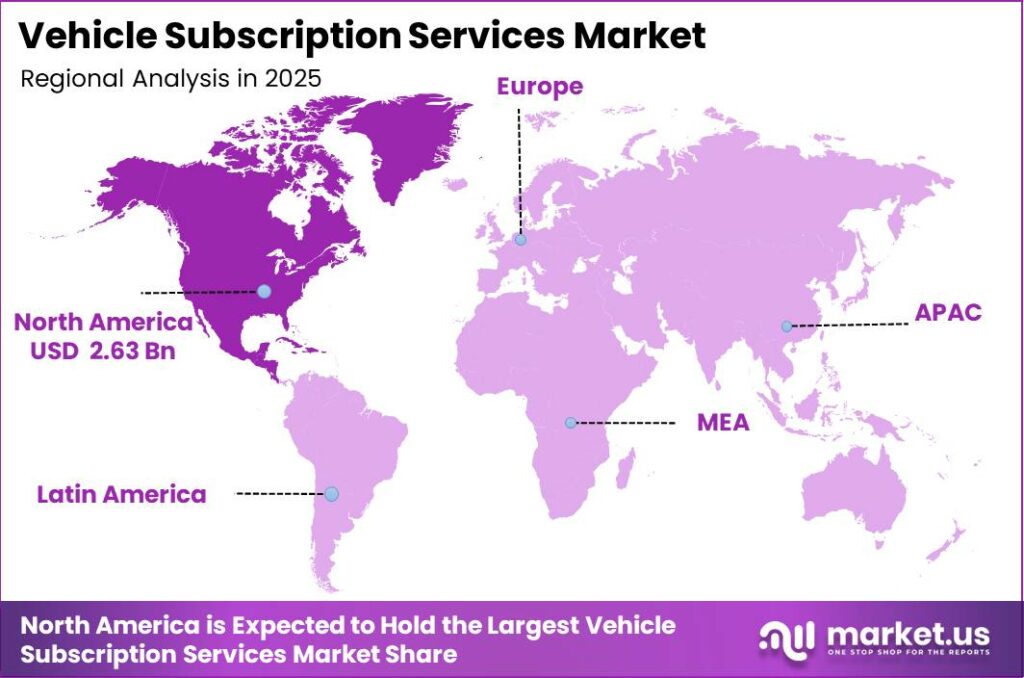
Consequently, Asia Pacific ranks as the fastest-growing region, driven by metro density, rising flexible-work vehicle demand, and expanding multi-brand platform deployment in India and Southeast Asia. Europe holds a strong second-tier position through established OEM captive programs and mobility specialist operators, with Free2move’s European city fleet expansions setting product benchmarks that Asia Pacific operators adapt for local market conditions. Investors who enter Asia Pacific early gain volume leverage before captive OEMs fully localize subscription technology stacks across the region’s fragmented dealer base.
Recent Developments
- June 2026 — FINN GmbH raised €140 million through a Series D funding round to expand its car subscription platform, fleet operations, technology infrastructure, and growth across flexible vehicle subscription services globally.
- November 2025 — SIXT SE launched SIXTcarhub.com, a digital vehicle remarketing platform enabling fleet operators, leasing companies, insurers, and OEMs to trade used fleet vehicles through a centralized marketplace.
- May 2025 — Free2move announced continued growth of its global mobility platform following integration of strategic acquisitions including Share Now, expanding rental, car sharing, and subscription services across key markets.
- March 2025 — Free2move added approximately 300 Fiat 500e electric vehicles to its German subscription fleet with integrated in-app charging support, targeting urban EV subscribers in major German cities.
- February 2025 — Free2move added 400 Opel Corsa vehicles across Berlin, Munich, and Frankfurt, strengthening its European multi-city subscription inventory ahead of peak spring demand.
- 2025 — Carvolution AG continued expansion of its car subscription model, increasing availability of flexible vehicle access solutions across Switzerland.
Conclusion
The Vehicle Subscription Services Market is on an exceptional growth trajectory, propelled by OEM captive-finance pivots, EV residual-value uncertainty, and a household preference for flexible monthly access over multi-year ownership commitments. A CAGR of 22.00% through 2035 reflects a structural consumption shift rather than a cyclical uptick, as both private users and corporate fleet managers reallocate vehicle budgets from capital expenditure into recurring service contracts.
Single-Brand Subscription and OEM/Captive Providers dominate current market structure, while Passenger Cars and Standard packages anchor the highest-volume demand pools. North America’s 36.70% regional lead reflects mature digital infrastructure and regulatory pressure on ICE ownership, while Asia Pacific emerges as the highest-growth corridor on metro density and platform-driven flexible mobility demand.
Operators who invest in telematics risk-scoring for insurance, white-label dealer platform licensing in emerging markets, and EV-paired charging bundles will capture the broadest share of a market growing to USD 51.50 Billion by 2035. Speed to multi-region digital platform deployment and depth of corporate mobility partnerships will define which providers convert today’s structural tailwinds into durable recurring revenue leadership.
Looking for data tailored to your specific market, region, or business need? Request a custom report or consultation — write to us at [email protected]




















