


Report Overview
Global Vehicle Subscription Services Market size is expected to be worth around USD 51.50 Billion by 2035 from USD 7.20 Billion in 2025, growing at a CAGR of 22.00% during the forecast period 2026 to 2035. This expansion reflects a structural shift from ownership toward flexible access models that bundle insurance, maintenance, and digital support into one monthly fee.
Therefore, the market covers recurring contracts that give users temporary vehicle access without long-term loans. Providers structure offers by brand scope, vehicle class, propulsion, package tier, and end-user type. This architecture lets investors map margin pools across captive OEM fleets and independent mobility platforms with clear unit economics.
Key Takeaways
- The market is valued at USD 7.20 Billion in 2025 and is set to reach USD 51.50 Billion by 2035 at a CAGR of 22.00%.
- Single-Brand Subscription leads Subscription Type with a 61.90% share.
- OEM/Captive Providers lead Service Provider with a 44.00% share.
- Passenger Cars lead Vehicle Type with an 82.00% share.
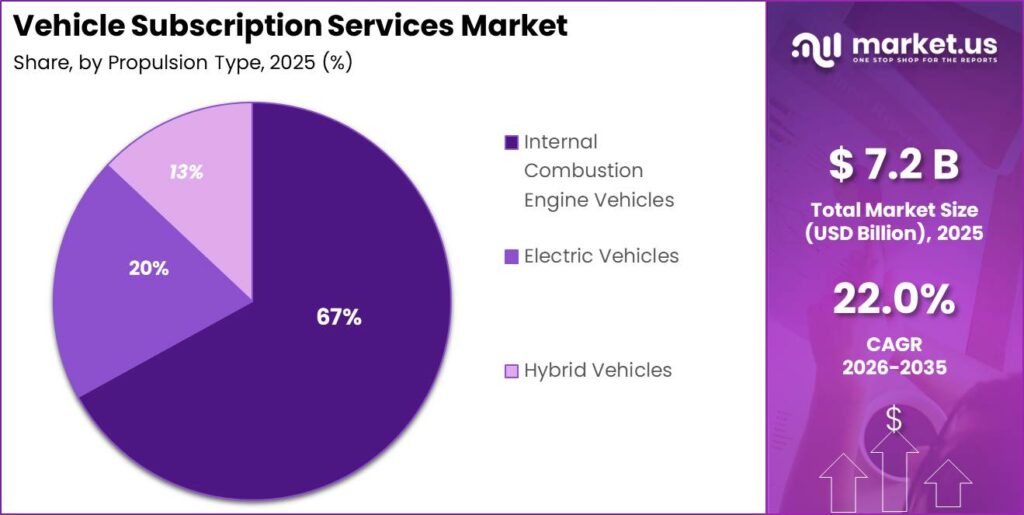
- Internal Combustion Engine Vehicles lead Propulsion Type with a 67.00% share.
- Standard leads Package with a 45.00% share.
- Private/Individual leads End User with a 57.00% share.
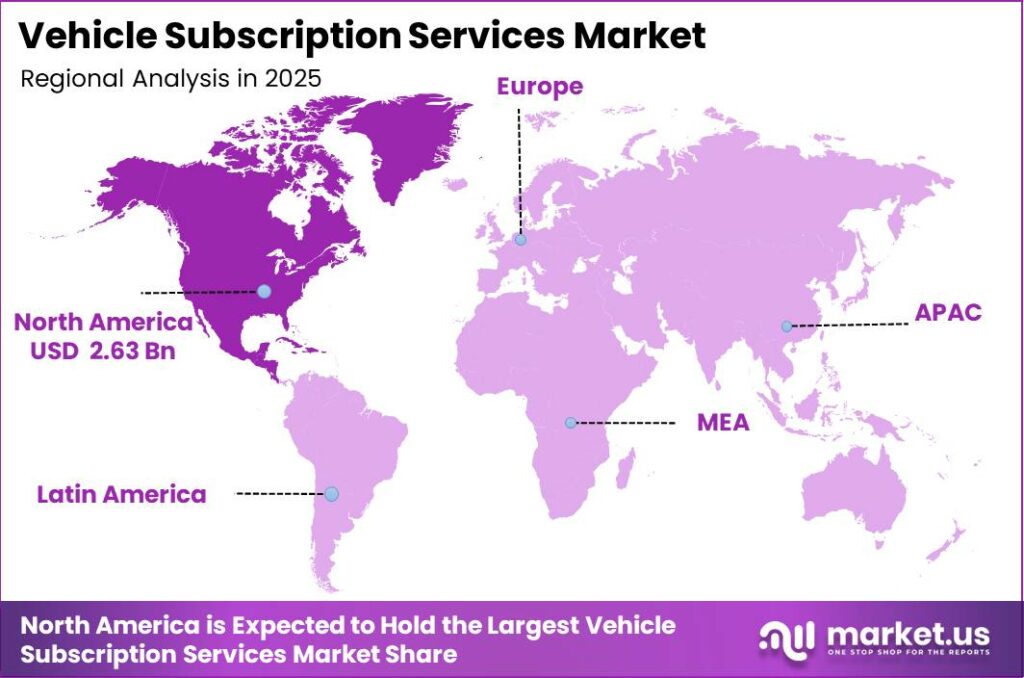
- North America leads regionally with a 36.70% share valued at USD 2.63 Billion.
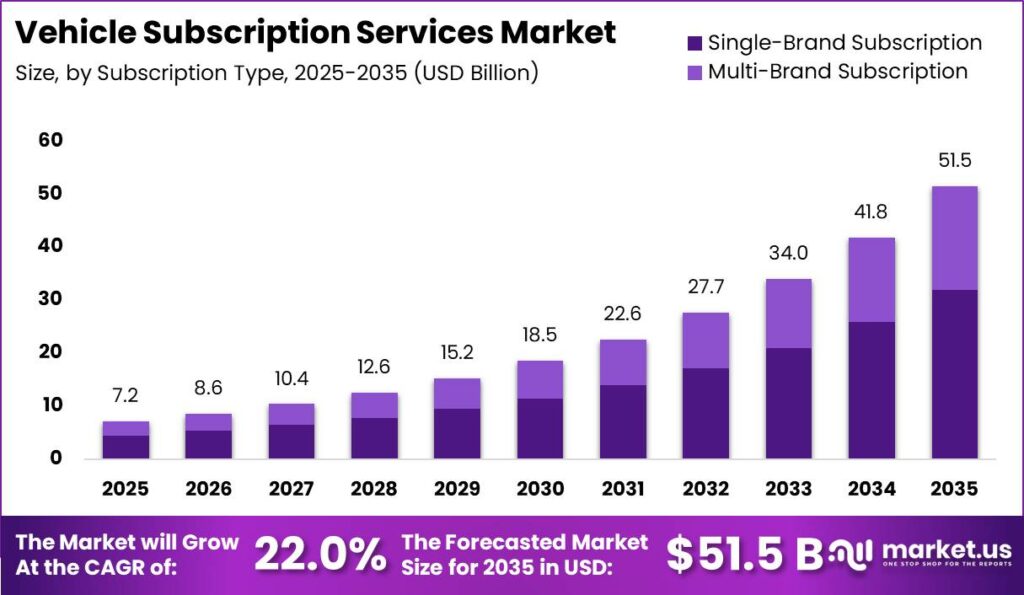
As per our research, SIXT+ set a minimum U.S. vehicle-subscription duration of 30 days in 2026. This short floor lowers entry friction for urban drivers who reject multi-year loans. Consequently, operators who match this flexibility capture price-sensitive private users faster than rigid lease competitors. Free2move expanded its U.S. flexible access footprint in December 2025 through a co-branded DriveItAway program across additional cities.
This means corporate mobility budgets now feed direct subscription demand as firms replace owned fleets with usage contracts. As reported by FINN, 2026 terms spanned 6 to 24 months, a fourfold commitment range. Providers who offer that span lock in longer revenue while still serving short-cycle private buyers who switch brands often.
Subscription Type Analysis
Single-Brand Subscription dominates with 61.90% due to OEM captive fleet control.
In 2025, Single-Brand Subscription held a dominant market position in the By Subscription Type segment of Vehicle Subscription Services Market, with a 61.90% share. Captive programs keep residual risk and brand experience inside one OEM stack. As reported by SIXT, 2026 terms allowed automatic 30-day renewals up to 90 days. Operators who keep single-brand pools tight protect residual values and raise switch costs for loyal owners.
Multi-Brand Subscription serves buyers who want choice across makers without separate contracts. Platforms aggregate inventory so one app covers several badges. This model attracts corporate users who rotate vehicle classes by project need. Investors who fund multi-brand tech stacks gain share where single-brand loyalty is weak and switching costs stay low.
Cross-brand inventory also supports Vehicle As A Service pilots that test demand before heavy CapEx. Platforms that master multi-brand logistics reduce idle days and lift utilization. This creates a path for independent operators to challenge captive OEMs on convenience rather than badge alone.
Service Provider Analysis
OEM/Captive Providers dominate with 44.00% due to balance-sheet fleet ownership.
In 2025, OEM/Captive Providers held a dominant market position in the By Service Provider segment of Vehicle Subscription Services Market, with a 44.00% share. Captive finance arms move margin from one-time sales into recurring fees. Data from SIXT shows a one-time U.S. sign-up fee of USD 199 in 2026. Captives that price entry fees carefully protect volume while still funding fleet warehousing costs.
Mobility Service Providers run dedicated subscription fleets outside pure OEM channels. They compete on digital booking speed and flexible pause rules. Free2move added around 300 Fiat 500e electric vehicles to its German fleet in March 2025 and launched in-app charging. Providers who pair EV stock with charging tools cut range anxiety and raise retention among urban subscribers.
Technology Companies supply software, telematics, and pricing engines that power white-label offers. Independent Third-Party Providers fill local gaps with lean fleets and dealer partnerships. Together these groups hold the remaining share and pressure captives on speed and price transparency.
Vehicle Type Analysis
Passenger Cars dominate with 82.00% due to private urban mobility demand.
In 2025, Passenger Cars held a dominant market position in the By Vehicle Type segment of Vehicle Subscription Services Market, with an 82.00% share. Private users favor cars for daily commute flexibility over commercial platforms. Figures from OICA show passenger car production remaining the bulk of global light-vehicle output into 2026. Operators who stock popular car trims first fill the largest demand pool and cut idle inventory risk.
Light Commercial Vehicles serve last-mile delivery and small-business fleets that need short access windows. Subscription terms fit gig and seasonal work better than multi-year leases. Providers who equip LCVs with telematics raise utilization and justify premium monthly rates to cost-focused fleets.
Heavy Commercial Vehicles remain a smaller niche tied to specialized logistics contracts. Fleet managers use short subscriptions to bridge peak seasons without long CapEx. Light Commercial Vehicles and Heavy Commercial Vehicles together hold the remaining share and open B2B margin lanes for operators who master uptime SLAs.
Propulsion Type Analysis
Internal Combustion Engine Vehicles dominate with 67.00% due to residual value clarity.
In 2025, Internal Combustion Engine Vehicles held a dominant market position in the By Propulsion Type segment of Vehicle Subscription Services Market, with a 67.00% share. Clear resale curves let operators price months with lower residual risk. According to the IEA, global electric car sales were set to surpass 20 million in 2025. ICE fleets still anchor cash flow while EV residual models mature for wider subscription use.
Electric Vehicles attract urban subscribers who want lower running costs and cleaner access. Subscription EV offers remove battery-depreciation fear that blocks outright purchase. Operators who pair EVs with charging credits raise conversion among city dwellers who lack home chargers.
Hybrid Vehicles bridge range anxiety and fuel savings for mixed driving patterns. They suit suburban users who need highway range without full EV infrastructure. Electric Vehicles and Hybrid Vehicles hold the remaining share and give fleets a staged path toward lower-emission pools.
Package Analysis
Standard dominates with 45.00% due to balanced mileage and feature mix.
In 2025, Standard held a dominant market position in the By Package segment of Vehicle Subscription Services Market, with a 45.00% share. Mid-tier bundles cover insurance and maintenance without premium markups. Based on Volvo UK terms, excess mileage drew GBP 0.20 per mile above allowance. Packages that set clear mileage bands protect margins while giving private users predictable monthly spend.
Budget packages target price-sensitive drivers who accept older stock and tighter mileage caps. Lower monthly fees expand the addressable base among first-time subscribers. Operators who keep Budget fleets high-utilization offset thinner per-unit margins with volume.
Premium packages add newer models, higher mileage, and concierge swaps. Business users and high-income private buyers pay for status and convenience. Budget and Premium hold the remaining share and let operators ladder customers up as loyalty and income rise.
End User Analysis
Private/Individual dominates with 57.00% due to flexible personal mobility needs.
In 2025, Private/Individual held a dominant market position in the By End User segment of Vehicle Subscription Services Market, with a 57.00% share. Households choose monthly access over loans when rates stay high. Data from AMT Auto shows UK mileage allowances from 1,000 to 3,000 miles per month. Private plans that match real commute miles cut overage shock and lift renewal rates.
Business/Corporate users subscribe for project fleets, executive cars, and mobility benefits. Companies avoid residual risk and balance-sheet vehicle assets. Shared Mobility programs inside enterprises raise utilization across teams and cut idle owned cars.
Corporate buyers also demand Car Rental-style swap rights inside longer subscriptions. Providers who serve both private and business pools diversify churn risk. Business/Corporate holds the remaining share and anchors higher average revenue per user for scaled operators.
Key Market Segments
By Subscription Type
- Single-Brand Subscription
- Multi-Brand Subscription
By Service Provider
- OEM/Captive Providers
- Mobility Service Providers
- Technology Companies
- Independent Third-Party Providers
By Vehicle Type
- Passenger Cars
- Light Commercial Vehicles
- Heavy Commercial Vehicles
By Propulsion Type
- Internal Combustion Engine Vehicles
- Electric Vehicles
- Hybrid Vehicles
By Package
- Budget
- Standard
- Premium
By End User
- Private/Individual
- Business/Corporate
Regional Analysis
North America Dominates the Vehicle Subscription Services Market with a Market Share of 36.70%, Valued at USD 2.63 Billion
North America leads on dense urban demand, mature captive-finance channels, and digital booking habits. Operators scale Fleet Management tools to track utilization and dynamic pricing across large metro pools. High household preference for monthly flexibility over long loans supports the 36.70% share and USD 2.63 Billion base that anchors global revenue.
Asia Pacific ranks as the fastest-growing region on metro density and rising flexible-work vehicle needs. Local platforms expand multi-brand pools in India and Southeast Asia. Free2move added 400 Opel Corsa vehicles in February 2025 for Berlin, Munich, and Frankfurt, showing how European digital fleets still set product benchmarks that Asia operators adapt.
Europe holds a strong second tier through OEM captives and mobility specialists. Latin America and Middle East and Africa trail on capital intensity yet open white-label dealer paths. Investors who enter Asia Pacific early gain volume leverage before captive OEMs fully localize subscription stacks.
Key Regions and Countries
North America
- US
- Canada
Europe
- Germany
- France
- The UK
- Spain
- Italy
- Rest of Europe
Asia Pacific
- China
- Japan
- South Korea
- India
- Australia
- Rest of APAC
Latin America
- Brazil
- Mexico
- Rest of Latin America
Middle East and Africa
- GCC
- South Africa
- Rest of MEA
Market Dynamics
Market Opportunity Analysis - Multi-brand, commercial, and emerging-region gaps invite focused capital
Multi-Brand Subscription remains underexploited relative to the 61.90% single-brand lead. Buyers who want badge choice still face thin inventory in many metros. New entrants that aggregate OEM stock into one app can win switchers without owning every residual. This creates a software-led path for investors who avoid full fleet CapEx.
Light Commercial Vehicles sit far below the 82.00% passenger-car share yet serve gig and delivery demand. Operators who stock LCVs with telematics open B2B contracts that private car pools miss. Early movers lock enterprise SLAs before captives prioritize commercial trims.
Asia Pacific growth outpaces the mature North America base of 36.70% and USD 2.63 Billion. Local platforms can pair white-label dealer tools with short-term private plans. Therefore, capital that funds regional tech and light fleets captures volume before global captives fully localize.
Business/Corporate end users lag the 57.00% private lead but pay higher average revenue per user. Mobility-as-benefit roll-ups remain thin outside North America and Europe. Providers who bundle insurance and reporting for HR teams unlock sticky enterprise revenue with lower churn than retail private contracts.
Technology and Innovation Landscape - Digital fleets, telematics pricing, and remarketing platforms reshape margins
SIXT launched SIXTcarhub.com in November 2025 as a digital remarketing marketplace for fleet operators, lessors, insurers, and OEMs. Centralized used-vehicle trade shortens exit cycles and improves residual realization. Operators who plug fleets into such platforms free capital faster and fund fresher subscription stock.
Free2move added in-app digital charging with its March 2025 Fiat 500e expansion of about 300 units in Germany. Charging visibility inside the booking app cuts range anxiety for EV subscribers. Providers who integrate charge status raise EV utilization and protect the propulsion mix shift.
Fleet telematics enables dynamic pricing and utilization tracking cited as a short-term growth support. Real-time mileage and location data let operators adjust rates and maintenance windows. Investors who fund telematics depth gain pricing power over static monthly packages.
SIXT expanded its SIXT ONE digital rewards program across European markets in March 2026. App-based retention tools lift recurring engagement and cut acquisition cost. Platforms that embed rewards inside booking flows convert one-off users into multi-year subscription relationships.
Drivers
OEM captive finance arms shift balance sheets from fixed retail loans toward recurring usage contracts. Company earnings disclosures show subscription-linked volumes rising at double-digit rates year over year. OECD consumer-finance indicators confirm households prefer flexible monthly fees while rates stayed elevated through 2025. This move lifts margin from one-time sale profit into higher-margin service attach revenue for investors.
Treasury teams reallocate CapEx from dealer expansion into on-balance-sheet subscription fleets. National registration data show more new-vehicle placements flowing through fleet and subscription channels. This creates durable recurring cash flow that supports growth above the baseline path into 2026 for sellers and capital partners.
| Driver | (~) % Impact on CAGR Forecast | Geographic Relevance | Impact Timeline |
|---|---|---|---|
| OEM captive-finance pivot to usage-based access | +4.2% | North America, Western Europe | Short term (2 years or less) |
| EV residual-value volatility pushing consumers to subscription over purchase | +3.6% | Global, concentrated in EU and China | Short term (2 years or less) |
| Urban mobility-as-a-service bundling with insurance and maintenance | +2.8% | Asia Pacific metros, EU cities | Medium term (2 to 4 years) |
| Fleet telematics enabling dynamic pricing and utilization tracking | +2.1% | North America, Western Europe | Short term (2 years or less) |
| Gig-economy and flexible-employment demand for short-term vehicle access | +1.9% | North America, India, Southeast Asia | Medium term (2 to 4 years) |
Restraints
Restrictive monetary policy kept policy rates above pre-2022 norms through 2025. Fleet-acquisition financing spreads widened by roughly 150 to 200 basis points over benchmarks per bank lending disclosures. Operators slow fleet replenishment and face older pool ages. This freezes expansion CapEx and hits smaller players first on growth plans.
Higher floor-plan interest compresses gross margins by an estimated 3 to 5 percentage points when costs cannot fully pass to subscribers. Mid-sized operators renegotiate sale-leaseback deals instead of ordering new stock. This signals tighter unit economics until borrowing costs ease for market participants who lack captive funding.
| Restraint | (~) % Impact on CAGR Forecast | Geographic Relevance | Impact Timeline |
|---|---|---|---|
| Elevated fleet-financing borrowing costs freezing new pool acquisition | -3.8% | North America, Western Europe | Short term (2 years or less) |
| State-level titling and licensing bans on short-term subscription contracts | -2.4% | United States (select states), India | Short term (2 years or less) |
| High capital intensity limiting new-entrant fleet scale-up | -2.0% | Global, acute in emerging markets | Short term (2 years or less) |
| OEM program shutdowns reducing branded subscription supply | -1.7% | North America, Europe | Short term (2 years or less) |
Challenges
Legacy actuarial models built for annual named-driver policies fail on rotating multi-driver pools. Per-vehicle insurance loadings run an estimated 15 to 25% higher than owned-vehicle policies per insurer disclosures. Claims cycles lengthen when liability spans many short-term users. This raises subscriber prices and slows conversion in price-sensitive markets.
Operators must build telematics risk-scoring engines and negotiate fleet-block treaties. Industry committees flag a 2 to 4 year horizon to normalize loss ratios. Firms that solve underwriting first unlock lower pricing power and a new data-driven insurance revenue stream without eroding baseline growth.
| Challenge | (~) % CAGR Friction Drag | Geographic Relevance | Mitigation Horizon |
|---|---|---|---|
| Fragmented insurance underwriting for short-term users | -1.9% | North America, Europe, India | Medium term (2 to 4 years) |
| Fleet reconditioning and turnaround talent shortages | -1.5% | North America, Europe | Medium term (2 to 4 years) |
| Consumer awareness and trust deficit versus leasing | -1.3% | Asia Pacific, Latin America | Medium term (2 to 4 years) |
| Telematics data integration across multi-OEM fleets | -1.1% | Global | Long term (4 years or more) |
| Residual value forecasting uncertainty for EV fleets | -1.4% | Global, acute in EU and China | Medium term (2 to 4 years) |
Opportunities
Regional dealer networks in emerging markets still rely on paper leasing and lack telematics stacks. Platform providers can license turnkey subscription software and financing on revenue share. Unit models show platform gross margins of 35 to 45% versus 15 to 20% for direct fleet ownership. This opens high-margin software revenue without warehouse CapEx for early movers.
Dealer-side customer acquisition cost per subscriber could fall 20 to 30% versus greenfield launches per automotive retail tech benchmarks. Capturing dealers before consolidation closes the window lifts growth above the baseline. Investors who fund white-label stacks gain scalable exposure across India and Southeast Asia dealer bases.
| Opportunity | (~) % Potential CAGR Upside | Geographic Relevance | Execution Window |
|---|---|---|---|
| White-label subscription platforms for regional dealer networks | +2.9% | Emerging markets, India, Southeast Asia | Medium term (2 to 4 years) |
| Embedded subscription bundling within ride-hailing and delivery platforms | +2.3% | Asia Pacific, Latin America | Medium term (2 to 4 years) |
| Corporate mobility-as-benefit roll-ups for enterprise fleets | +1.8% | North America, Europe | Long term (4 years or more) |
| Secondary-life EV battery-backed subscription pricing models | +1.6% | Europe, China | Long term (4 years or more) |
| Cross-border subscription roaming for frequent travelers | +1.2% | EU, Gulf states | Long term (4 years or more) |
Key Company Insights
Volvo Car Corporation positions Care by Volvo around clear mileage rules and brand-controlled residuals. UK terms charge GBP 0.20 per excess mile, protecting unit economics. SIXT+ commuter plans allow pauses up to 3 months, a flexibility benchmark captives must match. Volvo’s controlled fleet lowers residual risk yet may lose urban users who want multi-brand choice.
Porsche AG runs Porsche Drive as a premium single-brand access layer that protects luxury residuals. High monthly fees fit status buyers who reject depreciation shock. SIXT business plans started at USD 749 versus USD 989 regular, a USD 240 gap that shows price pressure even in premium mobility. Porsche’s brand moat holds margin but limits volume scale versus multi-brand rivals.
Key Players
- Volvo Car Corporation — Care by Volvo
- Porsche AG — Porsche Drive
- BMW AG
- Mercedes-Benz Mobility AG
- Volkswagen AG
- SIXT SE
- FINN GmbH
- Free2move
- Carvolution AG
- ORIX Corporation
- Cox Automotive, Inc. — Flexdrive
- Autonomy
- Wagonex Limited
- Myles Automotive Technologies Pvt. Ltd.
- Revv
Recent Developments
- June 2026: FINN GmbH raised €140 million through a Series D funding round to expand its car subscription platform, fleet operations, technology infrastructure, and growth across flexible vehicle subscription services.
- May 2025: Free2move announced continued growth of its mobility services business after integrating strategic acquisitions, including Share Now, and reported expansion of its global mobility platform supporting rental, car sharing, and subscription services.
- November 2025: SIXT SE launched SIXTcarhub.com, a digital vehicle remarketing platform allowing fleet operators, leasing companies, insurers, OEMs, and other partners to trade used fleet vehicles through a centralized marketplace.
- 2025: Carvolution AG continued expansion of its car subscription business model by increasing availability of flexible vehicle access solutions in Switzerland.
Geopolitical Impact Analysis
According to the WTO, merchandise trade volume growth slowed near 2.7% in recent assessment windows while average applied tariffs on vehicles and parts stayed in double-digit bands for several corridors. These frictions raise landed cost for imported subscription fleet units. As a result, operators delay cross-border pool expansion and favor local OEM supply to protect monthly price points.
Data from UNCTAD shows maritime trade still moves over 80% of global goods while the world fleet grew about 3% with developing economies owning 41%. Transit delays and energy price swings lift vehicle logistics and fuel-linked operating costs. Therefore, subscription providers reprice mileage bands and idle fees to defend margins when shipping and energy volatility hit fleet replenishment cycles.
Report Scope
| Report Features | Description |
|---|---|
| Market Value (2025) | USD 7.20 Billion |
| Forecast Revenue (2035) | USD 51.50 Billion |
| CAGR (2026-2035) | 22.00% |
| Base Year for Estimation | 2025 |
| Historic Period | 2020-2024 |
| Forecast Period | 2026-2035 |
| Report Coverage | Revenue Forecast, Market Dynamics, Market Opportunity Analysis, Technology and Innovation Landscape, Competitive Landscape, Recent Developments |
| Segments Covered | By Subscription Type (Single-Brand Subscription, Multi-Brand Subscription), By Service Provider (OEM/Captive Providers, Mobility Service Providers, Technology Companies, Independent Third-Party Providers), By Vehicle Type (Passenger Cars, Light Commercial Vehicles, Heavy Commercial Vehicles), By Propulsion Type (Internal Combustion Engine Vehicles, Electric Vehicles, Hybrid Vehicles), By Package (Budget, Standard, Premium), By End User (Private/Individual, Business/Corporate) |
| Regional Analysis | North America (US and Canada), Europe (Germany, France, The UK, Spain, Italy, and Rest of Europe), Asia Pacific (China, Japan, South Korea, India, Australia, and Rest of APAC), Latin America (Brazil, Mexico, and Rest of Latin America), Middle East and Africa (GCC, South Africa, and Rest of MEA) |
| Competitive Landscape | Volvo Car Corporation — Care by Volvo, Porsche AG — Porsche Drive, BMW AG, Mercedes-Benz Mobility AG, Volkswagen AG, SIXT SE, FINN GmbH, Free2move, Carvolution AG, ORIX Corporation, Cox Automotive, Inc. — Flexdrive, Autonomy, Wagonex Limited, Myles Automotive Technologies Pvt. Ltd., Revv |
| Customization Scope | Customization for segments, region / country-level will be provided. Additional customization can be done based on requirements. |
| Purchase Options | We have three licenses to opt for: Single User License | Multi-User License (Up to 5 Users) | Corporate Use License (Unlimited User and Printable PDF) |





































