


Report Overview
Global Electric Vehicle Market size is expected to be worth around USD 3,682.76 Billion by 2035 from USD 944.56 Billion in 2025, growing at a CAGR of 14.58% during the forecast period 2026 to 2035. As per our research, 10.8 million new passenger cars were registered across the EU, Norway, and Iceland in 2025, with BEVs accounting for 18.9% of total registrations. This structural shift toward electric mobility creates sustained procurement pressure on battery suppliers, charging infrastructure providers, and grid operators across the region.
The electric vehicle market encompasses all road-going vehicles powered fully or partially by electric drivetrains. This includes battery electric vehicles, hybrid electric vehicles, fuel cell electric vehicles, passenger cars, commercial trucks, electric buses, and two-wheelers. The market spans the full value chain from raw material extraction and battery cell manufacturing through vehicle assembly, software integration, charging infrastructure deployment, and after-market services.
Key Takeaways
- Market size in 2025: USD 944.56 Billion
- Forecast market size by 2035: USD 3,682.76 Billion
- CAGR 2026 to 2035: 14.58%
- Dominant vehicle type segment: Passenger Cars with 72.30% share
- Dominant propulsion type segment: Battery Electric Vehicle (BEV) with 57.80% share
- Dominant drive type segment: Front-Wheel Drive (FWD) with 45.20% share
- Dominant end use segment: Personal with 61.00% share
- Dominant region: Asia Pacific with 49.17% share, valued at USD 464.40 Billion
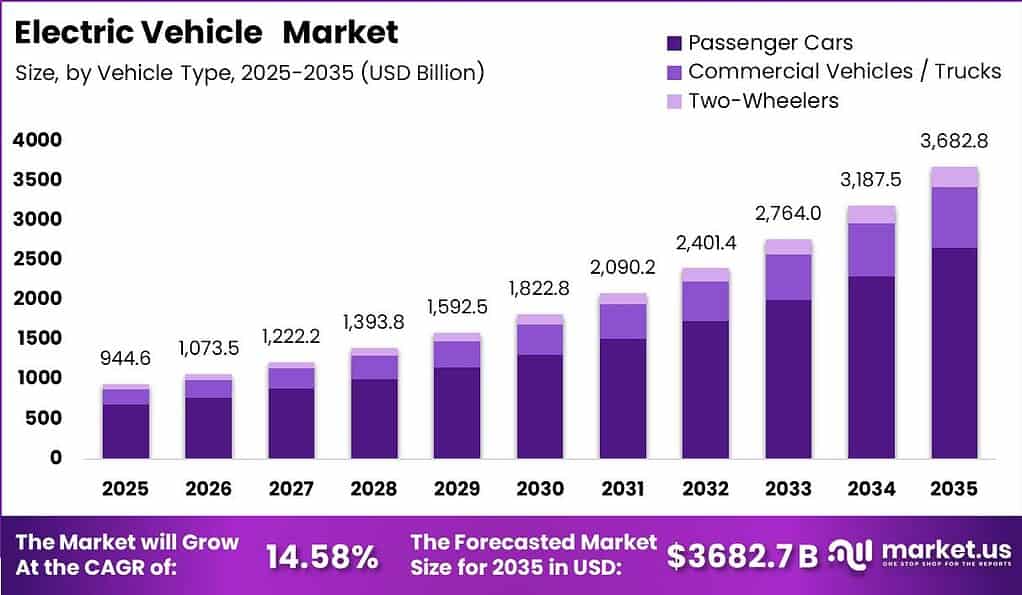
Government policy continues to shape EV adoption trajectories more directly than any other single variable. CO₂ compliance mandates in Europe and purchase subsidies across Asia force OEMs to accelerate electrification timelines regardless of near-term profitability. Investors who track regulatory calendars rather than sales headlines will anticipate model launch cycles and infrastructure spending waves before they appear in quarterly revenue figures.
According to the European Environment Agency, battery electric cars sold in Europe in 2025 accounted for 18.9% of all new passenger car registrations, up 4.5 percentage points from 2024. Average tailpipe CO₂ emissions from new cars fell to 96.7 g/km, a reduction of 10 g/km versus 2024. This acceleration confirms that fleet CO₂ compliance pressure is translating directly into BEV volume commitments from manufacturers across Europe.
As reported by the European Alternative Fuels Observatory, Europe recorded approximately 298,000 plug-in passenger vehicle registrations in January 2026, a 22% year-on-year increase versus January 2025. BEVs represented 20% of all new passenger car registrations, up from 17% a year earlier. This trend signals that EV penetration in Europe has crossed into self-reinforcing territory, where rising consumer familiarity and expanding model choice are sustaining volume growth independent of short-term incentive cycles.
Vehicle Type Analysis
Passenger Cars dominates with 72.30% due to personal mobility demand concentration.
In 2025, Passenger Cars held a dominant market position in the By Vehicle Type segment of the Electric Vehicle Market, with a 72.30% share. The International Organization of Motor Vehicle Manufacturers reports that passenger cars account for the majority of global vehicle production, with over 70 million units produced annually in recent years. This structural volume concentration means battery supply chains, charging networks, and policy incentives are all calibrated primarily around the passenger car segment, reinforcing its lead position for at least the next five years.
Commercial Vehicles and Trucks represent the fastest-growing sub-segment within the vehicle type breakdown. The International Energy Agency reported that electric bus and truck sales reached over 3 million units globally in 2024, with fleet operators in logistics and public transport driving the bulk of procurement. In February 2025, Rivian opened orders for its Electric Commercial Van to fleet customers following the end of its exclusivity arrangement, expanding the commercial EV addressable market and signaling growing supplier confidence in fleet-scale demand. Vendors targeting this sub-segment gain access to repeat procurement cycles that generate more predictable revenue than retail consumer channels.
Two-Wheelers, covering electric scooters and electric motorcycles, serve high-density urban markets where range anxiety and charging constraints that hinder car adoption are largely irrelevant. The International Energy Agency estimates that electric two-wheeler sales exceeded 50 million units annually across Asia in recent years, with India and Southeast Asia accounting for the fastest absolute volume growth. Manufacturers who establish two-wheeler platforms in these markets build distribution and service networks that lower the cost of subsequent four-wheel EV market entry.
Propulsion Type Analysis
Battery Electric Vehicle (BEV) dominates with 57.80% due to zero-emission policy alignment globally.
In 2025, Battery Electric Vehicle (BEV) held a dominant market position in the By Propulsion Type segment of the Electric Vehicle Market, with a 57.80% share. IEA data confirms that BEV sales exceeded 13 million units globally in 2024, representing a compound share gain over plug-in hybrids driven by improving range, falling battery costs, and tightening zero-emission mandates across Europe and China. OEMs that over-index on BEV platform investment now benefit from regulatory tailwinds that actively penalize continued ICE or mild-hybrid production.
Hybrid Electric Vehicles (HEVs), covering mild hybrid and full hybrid sub-segments, serve markets where charging infrastructure remains underdeveloped or where buyers face high upfront cost sensitivity. The Japan Automobile Manufacturers Association reports that Japan produced over 3 million hybrid vehicles in 2023, confirming that HEV technology retains structural relevance in markets with mature ICE ecosystems. For manufacturers, the HEV platform provides a transitional margin bridge while BEV cost parity is reached in each regional market.
Fuel Cell Electric Vehicles (FCEVs) represent the fastest-growing propulsion sub-segment, gaining traction in heavy commercial applications where battery weight and range constraints limit BEV viability. The Hydrogen Council estimates that global hydrogen fuel cell vehicle deployments reached approximately 72,000 units by end of 2023, with South Korea, Japan, and China leading fleet adoption. Suppliers investing in FCEV infrastructure now position themselves for a long-cycle technology bet where first-mover advantage in refueling networks creates durable competitive barriers. Lithium-ion NMC and LFP battery sub-segments within BEV continue to diverge on chemistry economics, with LFP gaining commercial fleet share due to lower cost per cycle.
Drive Type Analysis
Front-Wheel Drive (FWD) dominates with 45.20% due to cost efficiency in compact EV platforms.
In 2025, Front-Wheel Drive (FWD) held a dominant market position in the By Drive Type segment of the Electric Vehicle Market, with a 45.20% share. FWD configurations reduce drivetrain component counts, lower vehicle weight, and cut manufacturing costs by an estimated 10–15% compared to all-wheel drive systems on equivalent platforms, according to structural benchmarking data from the European Automobile Manufacturers Association. For volume EV manufacturers targeting mid-price segments, FWD remains the default powertrain architecture because it directly supports the cost parity strategies needed to reach mass-market buyers.
Rear-Wheel Drive (RWD) configurations serve the performance and premium EV segments where handling dynamics and power delivery take precedence over cost minimization. Patent filings with the USPTO show a sustained increase in RWD-specific electric motor and torque vectoring applications since 2020, reflecting OEM investment in high-margin EV variants that justify premium retail pricing. Manufacturers who offer credible RWD performance EVs alongside FWD entry models capture a wider price band and defend against both value and premium competitors simultaneously.
All-Wheel Drive (AWD) is the fastest-growing drive type sub-segment, driven by dual-motor adoption in crossovers and SUVs where consumer expectations for off-road capability and all-weather traction are highest. The Society of Automotive Engineers reports that AWD adoption in electrified vehicles has grown steadily as dual-motor configurations achieve greater software maturity and production cost reduction. AWD EV variants consistently command a 10–20% transaction price premium over equivalent FWD models, creating a direct margin uplift opportunity for OEMs that scale dual-motor production efficiently.
End Use Analysis
Personal dominates with 61.00% due to individual ownership preference in mature EV markets.
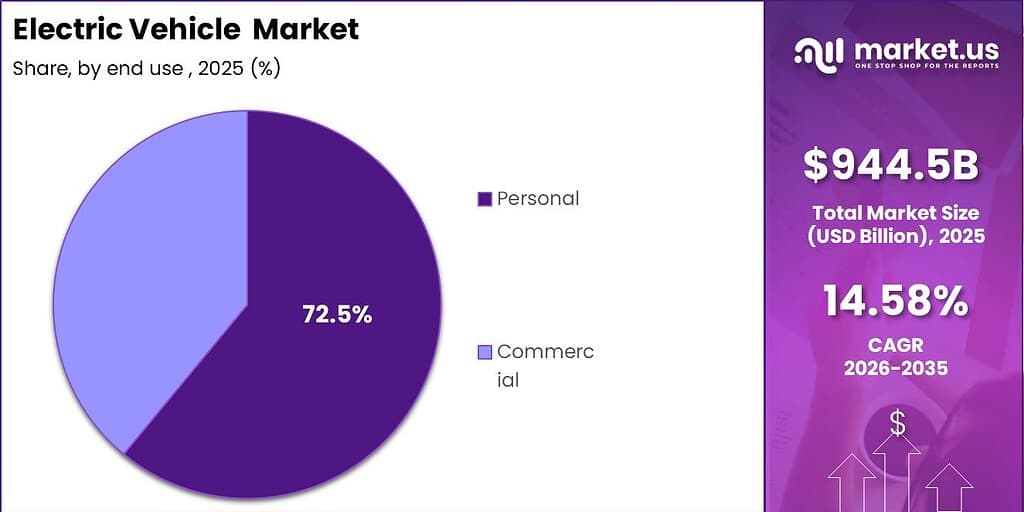
In 2025, Personal end use held a dominant market position in the By End Use segment of the Electric Vehicle Market, with a 61.00% share. National registration data compiled by the European Environment Agency shows that private individuals account for the majority of passenger EV purchases across EU member states, with household fleet registrations forming a secondary but growing sub-category. The personal ownership concentration means that consumer financing terms, home charging availability, and model-level range specifications are the three most decisive purchase variables for the segment that controls the largest revenue pool.
Commercial end use is the fastest-growing segment, encompassing ride-hailing fleets, corporate fleets, and logistics fleets where total cost of ownership replaces sticker price as the primary procurement criterion. The International Transport Forum estimates that commercial vehicle fleets account for a disproportionate share of total vehicle kilometers traveled relative to their unit count, amplifying the emissions and fuel cost impact of each EV unit added to a fleet. Fleet procurement cycles are also more compressed and volume-based than retail cycles, making commercial end use a structurally higher-velocity revenue channel for EV manufacturers and leasing partners who establish preferred supplier agreements. Individual Ownership and Household Fleet remain the core sub-segments within Personal use, while Ride-Hailing, Corporate, and Logistics Fleets form the three high-growth pillars of the Commercial segment.
Key Market Segments
By Vehicle Type
- Passenger Cars
- Hatchbacks
- Sedans
- SUVs and Crossovers
- Commercial Vehicles / Trucks
- Light Commercial Vehicles
- Electric Buses
- Two-Wheelers
- Electric Scooters
- Electric Motorcycles
By Propulsion Type
- Battery Electric Vehicle (BEV)
- Lithium-ion NMC Battery
- Lithium Iron Phosphate (LFP) Battery
- Hybrid Electric Vehicle (HEV)
- Mild Hybrid
- Full Hybrid
- Fuel Cell Electric Vehicle (FCEV)
By Drive Type
- Front-Wheel Drive (FWD)
- Rear-Wheel Drive (RWD)
- All-Wheel Drive (AWD)
By End Use
- Personal
- Individual Ownership
- Household Fleet
- Commercial
- Ride-Hailing Fleets
- Corporate Fleets
- Logistics Fleets
Regional Analysis
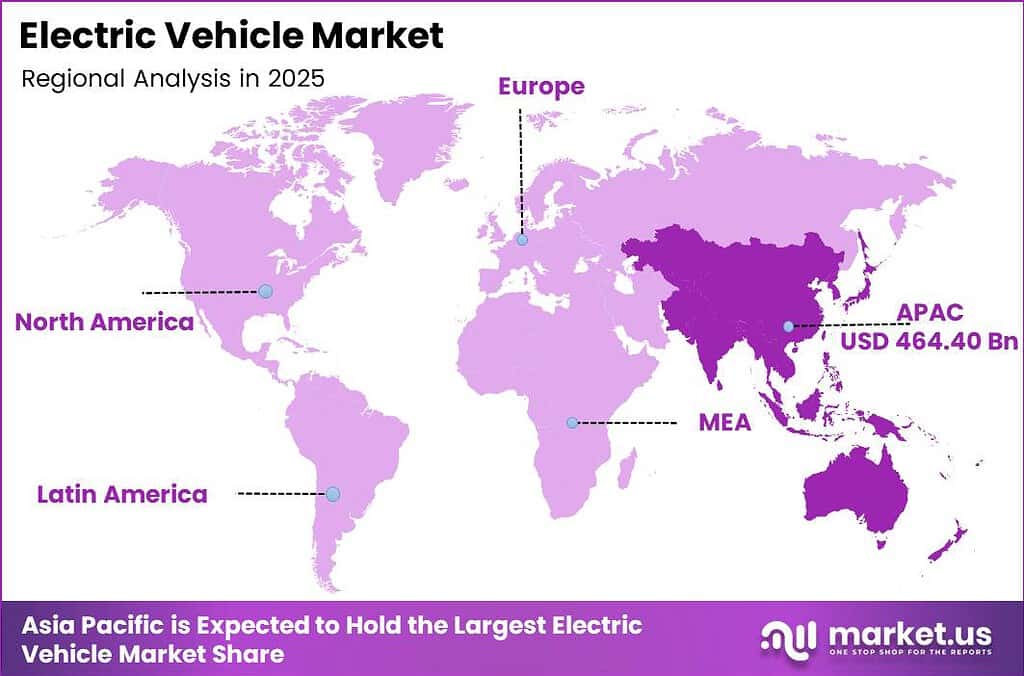
Asia Pacific Dominates the Electric Vehicle Market with a Market Share of 49.17%, Valued at USD 464.40 Billion
Asia Pacific holds the largest share of the global electric vehicle market, underpinned by China’s manufacturing scale, government procurement mandates, and an established battery supply chain that no other region yet replicates at equivalent cost. China alone accounts for roughly 64% of global EV sales, creating a regional concentration that gives Asia Pacific OEMs structural cost advantages in battery sourcing, tooling amortization, and software development cycles. Any investor or OEM ignoring China’s domestic competitive dynamics will systematically underestimate their cost exposure in every other global market.
India represents the fastest-growing sub-market within Asia Pacific. Data from the VAHAN portal shows that luxury EV sales in India rose 66% year-on-year to 2,027 units in the first five months of 2025, up from 1,223 units in the same period of 2024. This premium segment growth signals that consumer willingness to pay for EVs in India has crossed an early adoption threshold, creating a market entry window for international OEMs before domestic players consolidate the volume segments below.
Europe represents the second-largest regional market, driven by mandatory CO₂ fleet targets and expanding public charging infrastructure. By the end of June 2026, over 2,100,000 fully electric cars were on UK roads, representing approximately 6.1% of the roughly 34 million cars in the UK, according to Zapmap data. This penetration rate, though still below the EU average for new registrations, confirms that the UK parc is building toward a critical mass where second-hand EV supply will begin shaping total market pricing dynamics within the forecast period.
Key Regions and Countries
North America
- US
- Canada
Europe
- Germany
- France
- The UK
- Spain
- Italy
- Rest of Europe
Asia Pacific
- China
- Japan
- South Korea
- India
- Australia
- Rest of APAC
Latin America
- Brazil
- Mexico
- Rest of Latin America
Middle East and Africa
- GCC
- South Africa
- Rest of MEA
Market Dynamics
Market Opportunity Analysis - Underserved commercial and emerging-market segments offer high-velocity entry points for new EV players
The Commercial end use segment is the fastest-growing end use category yet holds only a minority share of the current revenue base, concentrated in ride-hailing, corporate, and logistics fleets. Fleet operators evaluate EV procurement primarily on total cost of ownership rather than sticker price, which compresses the sales cycle relative to retail channels. New entrants who build fleet-specific service agreements, telematics integration, and charging depot solutions first will establish switching cost barriers before the segment reaches price commoditization.
Fuel Cell Electric Vehicles represent the fastest-growing propulsion sub-segment but carry the smallest current installed base within the overall EV propulsion mix. This gap between growth rate and penetration depth signals an addressable white space for infrastructure and vehicle platform investors. A PLOS Climate study published in 2025 concluded that BEVs reduce total environmental damage costs by 2 to 3.5 times compared with ICE vehicles over a full lifetime, a finding that positions zero-emission powertrains broadly, including FCEVs, as increasingly defensible from a regulatory cost-of-carbon perspective.
All-Wheel Drive configurations are the fastest-growing drive type sub-segment, yet FWD currently commands 45.20% of the market. This structural gap between current share and growth trajectory signals that AWD EV platforms are still in an early penetration phase. Suppliers who develop efficient dual-motor and torque vectoring systems at scale now will benefit from an extended demand runway as SUV and crossover EV models proliferate across both premium and volume price tiers over the forecast period.
India’s luxury EV segment grew 66% year-on-year in the first five months of 2025, yet absolute volumes remain at just over 2,000 units. This combination of high growth rate and low base volume defines a pre-scale entry window where brand positioning and service network investment today will determine which OEMs capture volume share when the segment crosses into mass-market territory. Early movers who establish after-sales infrastructure before the volume inflection point avoid the higher customer acquisition costs that follow market saturation.
Technology and Innovation Landscape - Battery chemistry advances and lifecycle science reshape EV economics and competitive positioning
Lithium Iron Phosphate battery chemistry has emerged as the dominant cost-reduction vector within the BEV segment, with LFP pack costs reaching approximately $81 per kilowatt-hour globally in 2025 versus approximately $128 per kilowatt-hour for NMC chemistries. This 37% cost differential is reshaping OEM battery sourcing decisions at the platform level. Manufacturers who commit to LFP chemistry in their volume models gain a direct input cost advantage that compounds over multi-year production runs compared to competitors maintaining NMC-only supply chains.
The 800V electrical architecture, as deployed in Volvo’s ES90 platform unveiled in March 2025, represents a hardware innovation that reduces charging time and thermal management complexity at the system level. Higher voltage architectures allow the same power delivery with lower current, reducing cable weight and heat generation across the drivetrain. OEMs who transition their platforms to 800V now front-load the engineering investment but eliminate a recurring competitive disadvantage as ultra-fast charging infrastructure scales across Europe and Asia Pacific.
According to ICCT research published in 2025, battery electric cars sold in Europe produce 73% fewer greenhouse gas emissions over their lifetime than comparable gasoline cars under the EU’s current electricity mix. This lifecycle performance gap is not static. As grid electricity decarbonizes further, the emissions advantage of BEVs widens automatically without requiring any vehicle hardware changes, creating a durable regulatory and consumer credibility asset for manufacturers who have already committed to BEV platforms.
An MDPI study in 2025 showed that replacing gasoline vehicles with electric vehicles while reducing coal’s share in power generation to 50% can reduce overall emissions from the combined vehicle and energy system by approximately 48.2%. This finding reframes EV technology impact as a system-level variable rather than a vehicle-level metric. Grid decarbonization policy and EV adoption policy are co-dependent levers, meaning OEMs and infrastructure investors who engage with energy transition frameworks gain a strategic positioning advantage beyond the vehicle market itself.
Drivers
Global electric car sales exceeded 20 million units in 2025, growing approximately 20% year-on-year, with roughly one in four new cars sold worldwide being electric. Major outlooks project passenger EV sales reaching around 23.3 million units in 2026, representing approximately 27% of global car sales. This scale-up dynamic compresses OEM payback periods on EV platform investments and forces component suppliers to expand capacity ahead of confirmed order volumes or risk losing long-term contracts.
| Driver | (~) % Impact on CAGR Forecast | Geographic Relevance | Impact Timeline |
|---|---|---|---|
| Rapid growth in global electric car sales and share | +4.0% | Global | Short term (≤ 2 years) |
| Declining lithium-ion battery pack costs | +3.1% | Global, led by China | Short term (≤ 2 years) |
| Policy support and CO2 standards for road transport | +2.6% | Europe, China | Medium term (2–4 years) |
| High BEV share within total EV mix | +1.9% | Global | Short term (≤ 2 years) |
Restraints
Global EV sales grew approximately 16% in 2025 to roughly 20.7 million units. However, North America registered a decline of approximately 4% year-on-year while Europe posted roughly 33% growth and other regions approximately 48%. This uneven distribution means OEMs cannot apply a single global growth strategy. Differentiated regional approaches become mandatory for any manufacturer seeking to maintain volume targets across all major markets simultaneously.
Global EV sales are forecast at roughly 22.7 million units in 2026, implying a comparatively modest growth step as incentives taper and early adopter saturation sets in across select markets. EV share is projected to approach approximately 24.7% of total light-vehicle sales, yet the pace of sequential growth is slowing in specific segments. This plateauing effect subtracts an estimated 3.4% from the baseline CAGR, reinforcing the case for OEMs to invest now in second-wave buyer conversion strategies targeting cost-sensitive mainstream consumers.
| Restraint | (~) % Impact on CAGR Forecast | Geographic Relevance | Impact Timeline |
|---|---|---|---|
| Regional disparities in EV uptake and slowing growth in some markets | -3.4% | North America, selected emerging markets | Short term (≤ 2 years) |
| Higher battery pack costs outside China | -2.6% | United States, Europe | Short term (≤ 2 years) |
| Declining purchase incentives and policy uncertainty | -2.1% | Global | Medium term (2–4 years) |
Challenges
Global lithium-ion battery pack prices fell to approximately $108 per kilowatt-hour in 2025, an estimated 8–9% drop year-on-year. However, this global average masks sharp regional dispersion. Battery pack costs in the United States and Europe remained approximately 44% and 56% above the global average respectively. OEMs sourcing outside China face a structural cost penalty that reduces gross margin on every unit sold into these markets unless offset by localized production scale.
China’s LFP pack costs were approximately $84 per kilowatt-hour in 2025, roughly 13% lower year-on-year, while NMC packs averaged approximately $128 per kilowatt-hour globally. This chemistry-level spread forces OEMs to make sourcing decisions that lock in cost structures for multiple model generations. The resulting supply chain concentration creates a friction drag of roughly 2.8% on the market’s maximum growth potential, requiring continuous capital allocation toward regional battery manufacturing partnerships to remain price competitive.
| Challenge | (~) % CAGR Friction Drag | Geographic Relevance | Mitigation Horizon |
|---|---|---|---|
| Battery cost dispersion and supply-chain concentration | -2.8% | Global | Medium term (2–4 years) |
| Charging infrastructure and grid-integration constraints | -2.3% | Global | Medium term (2–4 years) |
| Balancing BEV and PHEV portfolios amid evolving regulations | -1.9% | Europe, China | Medium term (2–4 years) |
Opportunities
Battery pack costs in the United States and Europe sit roughly 44% and 56% above global averages, and more than 30% above leading Chinese LFP pack costs. Regional cell and pack manufacturing expansion represents a clear opportunity to close this gap. If localized production reduces pack costs in high-cost regions by approximately 20–25%, OEMs gain direct margin headroom or can reduce EV purchase price premiums to accelerate mid-segment adoption, where cost sensitivity is most acute.
This localization shift requires multi-year gigafactory capital expenditure, critical mineral supply contracts, and regional workforce development. These commitments are not incremental operational changes. Consequently, OEMs and battery manufacturers who commit early secure long-duration offtake agreements and government co-investment that later entrants cannot easily replicate. Market.us estimates that executing this localization strategy effectively could add approximately 3.2% upside to the baseline CAGR of 14.58%, representing one of the highest single-factor return opportunities in the forecast period.
| Opportunity | (~) % Potential CAGR Upside | Geographic Relevance | Execution Window |
|---|---|---|---|
| Regional manufacturing and localized battery production to narrow cost gaps | +3.2% | United States, Europe, India | Medium term (2–4 years) |
| Digital and online EV sales channels scaling beyond 50% mix | +2.4% | Global | Medium term (2–4 years) |
| Second-life battery and stationary storage monetization | +2.0% | Global | Long term (≥ 4 years) |
Key Company Insights
BYD Company Limited leads the global EV market through vertical integration across battery chemistry, cell production, and vehicle assembly, a structure that eliminates the supplier margin layers that erode profitability for less integrated competitors. An Indian TCO analysis published in 2025 found that EVs cost approximately ₹1.2 to ₹1.5 per kilometer in energy versus ₹6 to ₹9 per kilometer for petrol and diesel vehicles, a 75–85% lower running cost advantage that BYD’s price positioning directly monetizes in emerging market fleet procurement.
Tesla, Inc. maintains a software and direct-sales model that competitors have not replicated at scale, allowing margin capture that asset-heavy traditional OEMs structurally cannot match. A fleet-focused TCO analysis from early 2025 found that while ICE vehicles carry a 25–30% upfront price advantage, EVs deliver lower total cost over a 3 to 5 year horizon for most B2B fleets. In June 2026, BMW completed its USD 1.7 billion investment to prepare its South Carolina plants for next-generation BEV production, illustrating how legacy OEMs are committing irreversible capital to compete directly on Tesla’s terrain.
Key Players
- BYD Company Limited
- Tesla, Inc.
- Volkswagen AG
- Bayerische Motoren Werke AG (BMW)
- Hyundai Motor Company
- Ford Motor Company
- General Motors Company
- Stellantis N.V.
- Nissan Motor Co., Ltd.
- Mercedes-Benz Group AG
Recent Developments
- July 2025: Tesla officially entered the Indian passenger EV market by opening its first showroom in Mumbai and introducing the Model Y, marking its commercial launch in one of the world’s fastest-growing EV sub-markets.
- June 2025: Xiaomi officially launched the YU7 electric SUV, its second EV model after the SU7, targeting the premium electric SUV segment in China and expanding its consumer electronics-to-mobility transition.
- March 2025: Volvo Cars unveiled the fully electric ES90 executive sedan built on its SPA2 platform with 800V architecture, expanding its premium EV portfolio and positioning the brand in the high-voltage performance segment.
Geopolitical Impact Analysis
According to World Trade Organization data, tariff escalation between major EV-producing economies has materially disrupted cross-border vehicle trade flows. The European Union imposed tariffs of up to 45% on Chinese-manufactured electric vehicles in 2024, while US Section 301 tariffs on Chinese EVs reached 100%. These measures directly raise the landed cost of vehicles and components sourced from China, forcing OEMs to restructure supply chains toward higher-cost regional alternatives or absorb margin compression on models priced for competitive mid-market segments.
Data from the World Bank indicates that lithium carbonate prices experienced a decline of over 80% between their 2022 peak and 2024 lows, creating volatility in long-term battery supply contract pricing. This means that mineral cost assumptions embedded in multi-year OEM pricing strategies have become structurally unreliable. As a result, manufacturers exposed to spot-price lithium procurement face margin volatility that fixed-price contracted peers avoid. Cross-country econometric evidence published in 2025 finds that a 1% increase in EV fleet share produces an average 0.13% reduction in national CO₂ emissions, a metric that governments are increasingly using to justify tariff and localization policies that reshape trade flows in the EV supply chain.
Report Scope
| Report Features | Description |
|---|---|
| Market Value (2025) | USD 944.56 Billion |
| Forecast Revenue (2035) | USD 3,682.76 Billion |
| CAGR (2026-2035) | 14.58% |
| Base Year for Estimation | 2025 |
| Historic Period | 2020-2024 |
| Forecast Period | 2026-2035 |
| Report Coverage | Revenue Forecast, Market Dynamics, Market Opportunity Analysis, Technology and Innovation Landscape, Competitive Landscape, Recent Developments |
| Segments Covered | By Vehicle Type (Passenger Cars: Hatchbacks, Sedans, SUVs and Crossovers; Commercial Vehicles / Trucks: Light Commercial Vehicles, Electric Buses; Two-Wheelers: Electric Scooters, Electric Motorcycles), By Propulsion Type (Battery Electric Vehicle: Lithium-ion NMC Battery, Lithium Iron Phosphate (LFP) Battery; Hybrid Electric Vehicle: Mild Hybrid, Full Hybrid; Fuel Cell Electric Vehicle (FCEV)), By Drive Type (Front-Wheel Drive (FWD), Rear-Wheel Drive (RWD), All-Wheel Drive (AWD)), By End Use (Personal: Individual Ownership, Household Fleet; Commercial: Ride-Hailing Fleets, Corporate Fleets, Logistics Fleets) |
| Regional Analysis | North America (US and Canada), Europe (Germany, France, The UK, Spain, Italy, and Rest of Europe), Asia Pacific (China, Japan, South Korea, India, Australia, and Rest of APAC), Latin America (Brazil, Mexico, and Rest of Latin America), Middle East and Africa (GCC, South Africa, and Rest of MEA) |
| Competitive Landscape | BYD Company Limited, Tesla Inc., Volkswagen AG, Bayerische Motoren Werke AG (BMW), Hyundai Motor Company, Ford Motor Company, General Motors Company, Stellantis N.V., Nissan Motor Co. Ltd., Mercedes-Benz Group AG |
| Customization Scope | Customization for segments, region / country-level will be provided. Additional customization can be done based on requirements. |
| Purchase Options | We have three licenses to opt for: Single User License | Multi-User License (Up to 5 Users) | Corporate Use License (Unlimited User and Printable PDF) |





































