


Report Overview
Global Fuel Cell Electric Vehicle Market size is expected to be worth around USD 77.4 Billion by 2035 from USD 7.1 Billion in 2025, growing at a CAGR of 27.1% during the forecast period 2026 to 2035. This scale of expansion signals a shift from pilot deployment toward commercial-scale hydrogen mobility. Investors gain a long runway backed by policy support and fleet demand.
Fuel cell electric vehicles convert hydrogen into electricity through onboard fuel cell stacks, powering electric motors with water as the only tailpipe output. The market structures around passenger cars, commercial vehicles, and two and three wheelers, alongside fuel cell types, range bands, drive layouts, and applications. This layered structure lets suppliers target distinct buyer needs. Therefore, vendors can build focused product lines rather than one-size offerings.
Key Takeaways
- Global market size reaches USD 7.1 Billion in 2025 and climbs to USD 77.4 Billion by 2035 at a 27.1% CAGR.
- Passenger Cars lead the By Vehicle segment with a 56.3% share.
- Phosphoric acid fuel cell holds a 81.1% share of the By Fuel Cell segment.
- Medium Range vehicles capture a 48.2% share of the By Range segment.
- All-Wheel Drive leads the By Drive segment with a 40.7% share.
- Personal use holds a 30.2% share of the By Application segment.
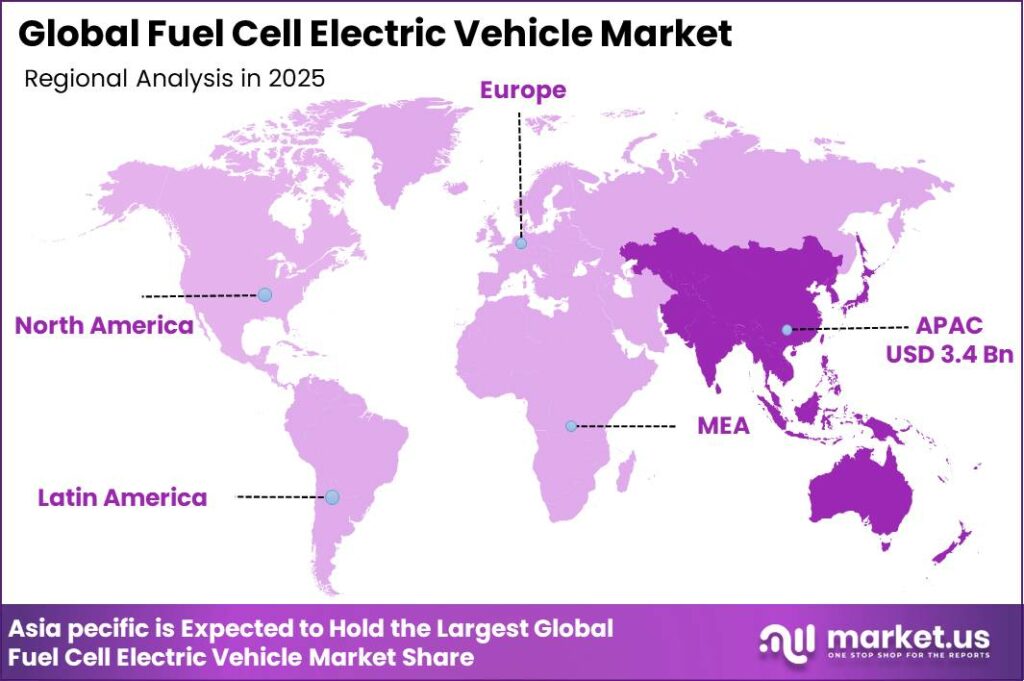
- Asia-Pacific dominates with a 48.1% share, valued at USD 3.4 Billion.
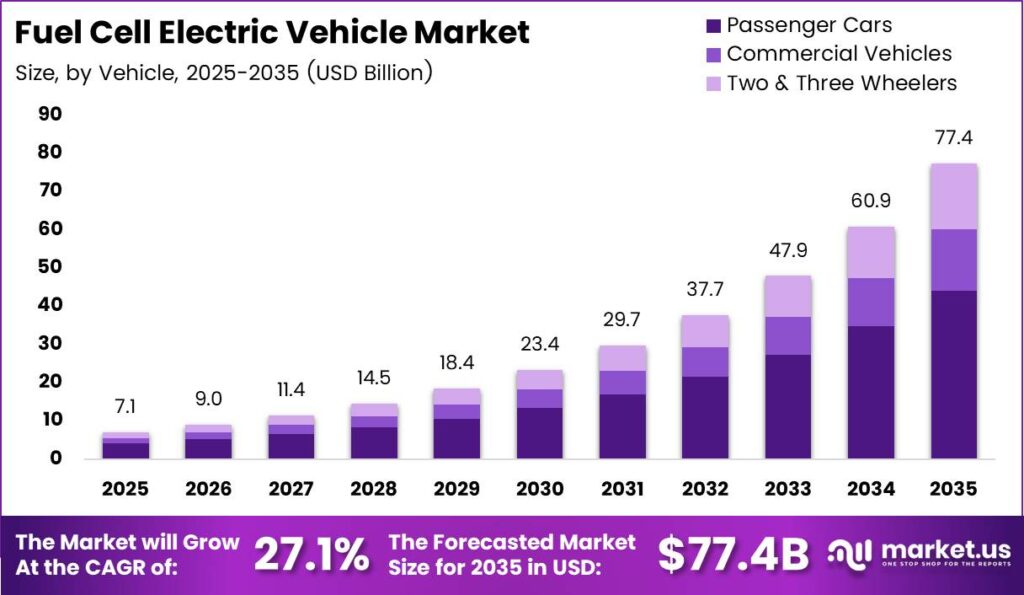
Government programs anchor early demand and lower adoption risk for private buyers. Public procurement of hydrogen buses and trucks creates guaranteed order volume that manufacturers can plan production around. This steady pipeline lets suppliers commit to stack manufacturing capacity. As a result, unit costs fall faster than open-market demand alone would allow. The Green Transportation Market benefits directly as zero-emission fleet targets convert into contracted vehicle orders.
The United States shows how registration lags available supply capacity. Figures from the California Energy Commission show the state’s 2025 refueling network could serve roughly 34,300 fuel cell electric vehicles while only 14,128 were registered. This gap means infrastructure sits underused and ready for growth. Therefore, fleet operators entering now face less refueling risk than early adopters did.
Adoption remains concentrated but is building a base. Data from the Hydrogen Fuel Cell Partnership shows 18,633 fuel cell electric vehicles sold or leased in the United States as of April 23, 2025. This installed base creates service demand and resale reference points. Consequently, dealers and workshops gain a reason to invest in hydrogen-ready capabilities.
Vehicle Analysis
Passenger Cars dominate with 56.3% due to established retail sales and consumer models.
In 2025, Passenger Cars held a dominant market position in the By Vehicle segment of Fuel Cell Electric Vehicle Market, with a 56.3% share. The Hydrogen Fuel Cell Partnership recorded 18,633 FCEVs sold or leased in the United States by April 2025, with passenger models like the Toyota Mirai and Hyundai Nexo leading retail volume. This retail base gives OEMs recurring consumer revenue. Therefore, automakers protect passenger platforms as their core hydrogen showcase.
Commercial Vehicles serve fleet operators that value fast refueling and long daily range for freight and transit duty. The California Energy Commission reported the NorCAL ZERO project deployed 30 fuel cell electric drayage trucks at the Port of Oakland with a 700 bar heavy-duty fueling station. This proves heavy trucks can run real port cycles today. As a result, logistics buyers gain a working reference before committing large fleets.
Two and Three Wheelers target dense urban mobility where compact hydrogen powertrains suit short trips and quick turnaround. UNIDO industrial data shows two and three wheelers form the largest share of motorized transport across South and Southeast Asian cities. This concentration gives fuel cell suppliers a high-volume entry point. Consequently, low-power stack designs could reach scale faster than heavy-duty variants in these regions.
Fuel Cell Analysis
Phosphoric acid fuel cell dominates with 81.1% due to proven stationary reliability and maturity.
In 2025, Phosphoric acid fuel cell held a dominant market position in the By Fuel Cell segment of Fuel Cell Electric Vehicle Market, with an 81.1% share. The U.S. Department of Energy reports phosphoric acid systems as among the longest-commercialized fuel cell types, with operating records exceeding 40,000 hours in stationary duty. This durability record reassures fleet buyers on lifespan. Therefore, established chemistry lowers perceived technology risk for cautious purchasers.
Proton exchange membrane cells suit vehicle duty through fast startup and high power density in a compact package. The U.S. Department of Energy reported DOE-supported programs advanced fuel cell durability beyond 8,000 operating hours for light-duty vehicle applications. This progress narrows the gap to engine-equivalent life. As a result, PEM becomes the preferred path for passenger and light commercial platforms.
Solid oxide fuel cells operate at high temperatures and fit range-extender and auxiliary power roles rather than primary traction. The IEA notes solid oxide systems reach electrical efficiency above 60%, the highest among fuel cell classes. This efficiency edge suits stationary and hybrid duty. Consequently, suppliers position SOFC for niche high-efficiency use rather than mass vehicle traction.
Range Analysis
Medium Range dominates with 48.2% due to balanced daily commuting and cost.
In 2025, Medium Range held a dominant market position in the By Range segment of Fuel Cell Electric Vehicle Market, with a 48.2% share. National statistical office travel surveys show most passenger trips fall below 500 miles per fill cycle, matching the 250 to 500 mile band. This alignment fits real driving patterns. Therefore, buyers pick medium range models that avoid paying for unused capacity.
Short Range vehicles serve fixed urban routes such as delivery loops and municipal duty under 250 miles. World Bank urban transport data shows city fleets average under 150 miles of daily service. This limited demand fits smaller hydrogen tanks. As a result, short range models cut vehicle cost and free capital for larger fleet counts.
Long Range vehicles above 500 miles target intercity freight where refueling stops directly reduce earning hours. The IEA notes long-haul trucks can log over 100,000 miles yearly, rewarding extended range between fills. This heavy utilization justifies larger storage. Consequently, freight operators accept higher upfront cost to protect route productivity.
Drive Analysis
All-Wheel Drive dominates with 40.7% due to traction demand in SUVs.
In 2025, All-Wheel Drive held a dominant market position in the By Drive segment of Fuel Cell Electric Vehicle Market, with a 40.7% share. World Bank vehicle registration data shows SUVs now exceed 45% of new passenger sales in major markets, a body style that favors all-wheel layouts. This buyer preference carries into hydrogen models. Therefore, OEMs prioritize AWD fuel cell platforms to match mainstream taste.
Front-Wheel Drive suits compact and cost-focused models where packaging and efficiency matter most. UNIDO manufacturing data shows front-wheel layouts remain the highest-volume automotive configuration worldwide. This scale keeps component costs low. As a result, entry-level fuel cell cars adopt FWD to defend affordability.
Rear-Wheel Drive fits performance sedans and heavier commercial platforms needing balanced load distribution. ITC Trade Map data shows steady global trade in rear-drive commercial chassis units across freight vehicle codes. This structural demand supports rear-drive supply chains. Consequently, commercial fuel cell builders retain RWD options for load-heavy duty.
Application Analysis
Personal use dominates with 30.2% due to consumer retail vehicle purchases.
In 2025, Personal use held a dominant market position in the By Application segment of Fuel Cell Electric Vehicle Market, with a 30.2% share. The Hydrogen Fuel Cell Partnership recorded 50 public hydrogen refueling stations in California by April 2025, enabling private owner refueling access. This access base supports personal ownership. Therefore, retail buyers in served regions treat FCEVs as daily-usable cars.
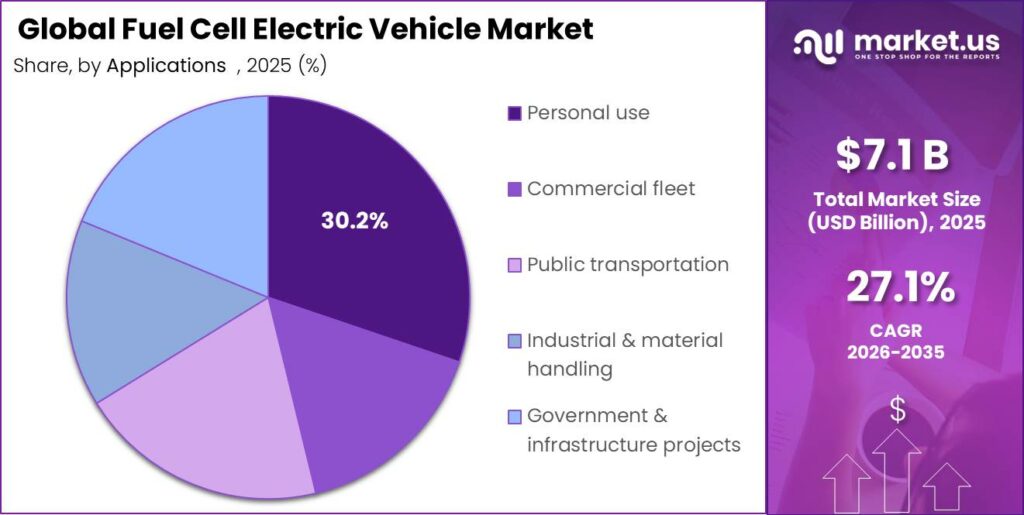
Commercial fleet buyers value predictable routes and central depot refueling that suit hydrogen supply planning. National statistical office fleet data shows commercial vehicles cover far higher annual mileage than private cars. This intensity rewards fast refueling. As a result, fleet operators recover hydrogen investment faster through high daily utilization.
Logistics and freight operators anchor heavy hydrogen demand along fixed corridors serving ports and warehouses. The NorCAL ZERO project deployed 30 drayage trucks at the Port of Oakland, proving corridor freight duty. This model concentrates demand where refueling exists. Public transportation, last-mile delivery, ride-hailing, industrial handling, and government projects hold the remaining share collectively across structured fleet channels.
Key Market Segments
By Vehicle
- Passenger Cars
- Sedans
- Hatchbacks
- SUVs
- Commercial Vehicles
- Light commercial vehicles (LCV)
- Medium commercial vehicles (MCV)
- Heavy commercial vehicles (HCV)
- Two & Three Wheelers
By Fuel Cell
- Phosphoric acid fuel cell
- Proton exchange membrane
- Solid oxide fuel cell
By Range
- Short Range (Below 250 Miles)
- Medium Range (250 – 500 Miles)
- Long Range (Above 500 Miles)
By Drive
- Front-Wheel Drive (FWD)
- Rear-Wheel Drive (RWD)
- All-Wheel Drive (AWD)
By Application
- Personal use
- Commercial fleet
- Last-mile delivery
- Logistics & freight
- Ride-hailing & shared mobility
- Public transportation
- Industrial & material handling
- Government & infrastructure projects
Regional Analysis
Asia-Pacific Dominates the Fuel Cell Electric Vehicle Market with a Market Share of 48.1%, Valued at USD 3.4 Billion
Asia-Pacific leads the Fuel Cell Electric Vehicle Market with a 48.1% share, valued at USD 3.4 Billion in 2025. Strong national hydrogen roadmaps in South Korea, Japan, and China convert policy targets into fleet orders. This state-backed demand gives suppliers forward revenue visibility. As a result, regional manufacturers commit to stack capacity that lowers cost across the Automotive Powertrain Market.
North America stands out as a fast-growing region led by heavy infrastructure spending. Figures from the California Energy Commission show California invested USD 174 million in light-duty hydrogen infrastructure and ran 50 public stations by September 2025. This funding lowers refueling risk for new buyers. Therefore, fleet operators gain confidence to place larger hydrogen vehicle orders.
Other regions build hydrogen capacity around freight and transit corridors. Data from the California Energy Commission shows nearly USD 120 million allocated for medium and heavy-duty stations, with 13 operating and 42 planned by July 2025. This pipeline signals a shift toward commercial refueling. Consequently, Europe and other markets can follow a corridor-first buildout model.
Key Regions and Countries
North America
- US
- Canada
Europe
- Germany
- France
- The UK
- Spain
- Italy
- Rest of Europe
Asia Pacific
- China
- Japan
- South Korea
- India
- Australia
- Rest of APAC
Latin America
- Brazil
- Mexico
- Rest of Latin America
Middle East and Africa
- GCC
- South Africa
- Rest of MEA
Market Dynamics
Market Opportunity Analysis - Underserved segments and lagging regions open entry points for new FCEV players
Commercial Vehicles remain underexploited against the 56.3% passenger lead in the By Vehicle segment. Fleet duty suits hydrogen’s fast refueling far better than private cars, yet volume trails. This gap leaves room for specialist truck and bus builders. Therefore, new entrants can target commercial platforms where incumbents concentrate on passenger models.
Solid oxide fuel cells sit well behind the phosphoric acid 81.1% share in the By Fuel Cell segment. Their high-efficiency profile fits range extender and auxiliary roles that mainstream suppliers overlook. This creates a defensible niche. By contrast, players entering here avoid direct competition with dominant chemistry and serve unmet high-efficiency demand.
Long Range vehicles trail the medium range 48.2% lead in the By Range segment. Intercity freight needs extended range, yet models remain scarce today. This mismatch signals white space for storage-focused builders. As a result, suppliers solving hydrogen storage for long hauls can claim an underserved freight niche.
Personal use dominates at 30.2% in the By Application segment, leaving structured fleet channels open. Logistics, last-mile, and public transit demand concentrated refueling that suits corridor buildout. This creates room for fleet-focused entrants. Instead of chasing retail buyers, new players can win contracted fleet volume with bundled service models.
Technology and Innovation Landscape - Megawatt systems, liquid storage, and digital monitoring reshape competitive edges
Megawatt-class fuel cell systems now enter commercial heavy-duty truck platforms. These high-power stacks let a single vehicle carry freight loads once limited to diesel. This raises hydrogen’s credibility for Class 8 duty. Therefore, OEMs that master megawatt integration gain first claim on the heavy freight segment where margins run highest.
Liquid hydrogen storage technologies are advancing to extend commercial vehicle range. Liquid storage packs more energy per volume than compressed gas, easing long-haul range limits. This helps trucks cover intercity routes with fewer stops. As a result, builders adopting liquid storage can offer range that compressed-gas rivals cannot match.
Digital fleet telematics now integrate hydrogen consumption and fuel cell health monitoring. Real-time stack data lets operators predict wear before failures halt vehicles. This cuts downtime and protects payback on costly stacks. Consequently, suppliers bundling telematics with vehicles create sticky service revenue and stronger customer retention.
Joint ventures between automakers, energy firms, and industrial gas suppliers now build hydrogen mobility ecosystems. These alliances link vehicle supply with refueling and hydrogen production in one package. This lowers adoption risk for fleet buyers. Therefore, players inside strong ventures gain a structural edge over standalone competitors lacking fuel supply reach.
Drivers
The strongest driver is the concentration of government money behind hydrogen mobility across the largest car markets at once. South Korea’s Hydrogen Economy Roadmap targets 200,000 FCEVs by 2025 and 620,000 by 2030, backed by purchase subsidies up to KRW 100,000,000 for commercial trucks. This creates guaranteed near-term demand. Therefore, fuel cell makers gain the forward orders needed to justify large factory investment.
Public spending turns speculative technology work into contracted fleet supply. Japan’s Green Growth Strategy targets 800,000 units by 2030 with roughly USD 14 billion in innovation funding, while Germany allocated EUR 900,000,000 to hydrogen mobility. This anchor demand supports the Alternative Fuel Vehicles Market expansion. As a result, suppliers scale stack production and drive per-unit costs down the learning curve.
| Driver | (~) % Impact on CAGR Forecast | Geographic Relevance | Impact Timeline |
|---|---|---|---|
| National Hydrogen Economy Roadmaps & Government FCEV Deployment Subsidies Anchoring Commercial Fleet Demand | +8.50% | South Korea, Japan, China, Germany, United States, France, Netherlands, Australia | Short term (≤ 2 years) |
| Heavy-Duty & Long-Haul Commercial Vehicle Decarbonisation Mandates Creating Structural FCEV Demand Beyond Passenger Cars | +6.20% | European Union, United States, China, Japan, South Korea, Canada, Australia | Medium term (2–4 years) |
| Green Hydrogen Production Cost Reduction Improving FCEV Total Cost of Ownership Versus Diesel | +4.80% | Global — electrolyser cost reductions most advanced in Europe, Australia, Chile, Saudi Arabia | Medium term (2–4 years) |
| PEM Fuel Cell Stack Manufacturing Scale-Up Driving System Cost Reduction Toward Commercial Parity | +3.50% | Japan, South Korea, Germany, United States, China | Short term (≤ 2 years) |
| Public Transit & Municipal Bus Fleet FCEV Procurement Programmes Creating Anchor Volume for Refuelling Infrastructure | +2.40% | China, South Korea, Germany, United Kingdom, France, United States, Japan | Short term (≤ 2 years) |
| Corporate Fleet Net-Zero Commitments & Science Based Targets Initiative (SBTi) Pledges Accelerating FCEV Adoption in Commercial Fleets | +1.70% | Europe, United States, Japan, South Korea, Australia, Canada | Short term (≤ 2 years) |
Restraints
The main restraint is the refueling station deficit that traps FCEV adoption in a chicken-and-egg deadlock. By end 2024, the world held roughly 1,000 to 1,100 hydrogen stations, with about 330 in Japan, 310 in South Korea, and fewer than 60 in the United States. This narrow coverage blocks buyers elsewhere. Therefore, most potential adopters cannot refuel within practical range.
Station economics make private buildout hard without public grants. A 700 bar station costs USD 1,000,000 to 2,500,000 and needs 15 to 20 fills daily to break even, a level unreachable below 500 vehicles nearby. This gap deters fleet commitments. As a result, deployment stays locked to a few corridors and delays broad market growth.
| Restraint | (~) % Impact on CAGR Forecast | Geographic Relevance | Impact Timeline |
|---|---|---|---|
| Hydrogen Refuelling Station (HRS) Infrastructure Deficit Creating Range & Refuel Anxiety Blocking FCEV Consumer & Fleet Adoption | -7.20% | Global — most acute outside South Korea, Japan & Germany HRS networks | Short term (≤ 2 years) |
| Grey Hydrogen Dominance in Current Supply Mix Undermining FCEV Well-to-Wheel Carbon Advantage Claims | -4.10% | Global — most acute in markets where green hydrogen supply infrastructure is nascent | Short term (≤ 2 years) |
| FCEV Vehicle Purchase Price Premium Over BEV & Diesel Equivalents Suppressing Private Market Demand Without Subsidy | -3.20% | United States, Europe, Australia, India — markets with limited per-vehicle purchase subsidies | Short term (≤ 2 years) |
| Platinum Group Metal (PGM) Supply Concentration & Price Risk for PEM Fuel Cell Catalyst Layers | -2.10% | Global — platinum supply concentrated in South Africa & Russia (~80% combined) | Medium term (2–4 years) |
Challenges
The core challenge is the gap between lab durability and real heavy-duty performance. Leading PEM stacks reach 5,000 to 8,000 hours in controlled tests, yet dynamic truck duty degrades them at 5 to 12 mV per 1,000 hours. This cuts real stack life to 15,000 to 25,000 hours. Therefore, fleets face costly mid-life replacements that weaken hydrogen cost parity with diesel.
This durability gap opens a clear service revenue stream. A stack replacement at 18,000 to 20,000 hours costs USD 60,000 to 120,000, adding USD 0.04 to 0.08 per kilometre. This creates demand for predictive stack health monitoring. As a result, OEMs offering AI-based maintenance can capture recurring aftermarket income while extending vehicle uptime.
| Challenge | (~) % CAGR Friction Drag | Geographic Relevance | Mitigation Horizon |
|---|---|---|---|
| Fuel Cell Stack Durability & Degradation in Heavy-Duty Duty Cycles | -4.20% | Global — most acute for Class 8 truck, bus & rail FCEV applications | Long term (≥ 4 years) |
| Green Hydrogen Production & Compression Cost Competitiveness | -3.10% | Global — electrolyser cost reduction required in United States, Europe, Asia, Australia | Long term (≥ 4 years) |
| Onboard Hydrogen Storage System Weight & Volume Penalties | -2.20% | Global — most acute in passenger car & light commercial vehicle FCEV platforms | Long term (≥ 4 years) |
| FCEV-Qualified Technician & Service Network Talent Deficit | -1.50% | United States, Europe, India, Southeast Asia, Latin America — low FCEV service infrastructure markets | Long term (≥ 4 years) |
| Cross-Border Hydrogen Safety & Type Approval Regulatory Fragmentation | -0.85% | Global — UN GTR 13 adoption gaps in India, Southeast Asia, Latin America, Middle East | Long term (≥ 4 years) |
Opportunities
The biggest opening is heavy-duty truck corridor deployment, still near untapped today. Only 3,000 to 5,000 FCEV heavy trucks run worldwide against a diesel Class 8 fleet of 6 to 7 million units in the US and EU. This means penetration sits below 0.1%. Therefore, early movers who secure corridor refueling can capture a vast untouched fleet segment.
Corridor economics unlock a rich service model for OEMs. Fleets buying 50 to 500 trucks suit bundled lease, hydrogen, and maintenance contracts worth USD 45,000 to 90,000 per vehicle yearly, versus USD 15,000 to 25,000 for diesel aftermarket. This expands revenue per vehicle up to fourfold. As a result, builders gain strong incentive to invest ahead of demand.
| Opportunity | (~) % Potential CAGR Upside | Geographic Relevance | Execution Window |
|---|---|---|---|
| Heavy-Duty FCEV Truck Corridor Deployment Unlocking Logistics & Mining Fleet Segment at Scale | +5.80% | United States, Germany, Japan, South Korea, China, Australia, Norway, Netherlands | Medium term (2–4 years) |
| Hydrogen-as-a-Service (HaaS) Bundled Fuelling & Fleet Management Monetisation Model for FCEV Fleets | +3.40% | South Korea, Japan, Germany, United States, United Kingdom, France, Netherlands | Medium term (2–4 years) |
| Maritime & Port Equipment FCEV Conversion Unlocking Adjacent Heavy-Industry Zero-Emission Segment | +2.20% | Netherlands, South Korea, Japan, Norway, Singapore, Germany, United States | Long term (≥ 4 years) |
| Solid Oxide Fuel Cell (SOFC) Integration for FCEV Range Extender & Stationary Auxiliary Power Units | +1.60% | United States, Germany, Japan, South Korea, Australia | Long term (≥ 4 years) |
| FCEV Deployment in Emerging Markets via Hydrogen Industrial Zone Cluster Models (India, Brazil, Middle East) | +1.10% | India, Saudi Arabia, UAE, Brazil, Chile, Egypt | Long term (≥ 4 years) |
Key Company Insights
Ashok Leyland holds a strong position in commercial vehicle manufacturing across South Asian markets. Its focus on buses and heavy trucks aligns with hydrogen’s best-fit segment of high-mileage fleet duty. This gives the company a natural path into FCEV commercial platforms. However, thin regional hydrogen refueling coverage limits near-term deployment, creating execution risk until corridor infrastructure matures across its home markets.
Audi AG brings premium passenger engineering and strong brand pull to fuel cell development. Its access to group-wide platform sharing lowers the cost of adding hydrogen models. This creates an advantage in reaching affluent early adopters willing to pay a technology premium. However, its passenger focus leaves it exposed if heavy-duty commercial duty becomes the market’s main growth engine over the forecast period.
Key Players
- Ashok Leyland
- Audi AG
- Ballard Power Systems Inc.
- Bayerische Motoren Werke AG
- Denso Global
- Dongfeng Motor Corporation
- FAW Group Ltd.
- General Motors
- Honda Motor Co. Ltd.
- Hyundai Motor Group
- Hyzon Motors
- Kenworth Truck Company
- Mercedes-Benz Group
- Mitsubishi Corporation
- Nikola Corporation
- Nissan Motor Co. Ltd.
- Renault Group
Recent Developments
- February 2025: Toyota Motor Corporation unveiled its third generation fuel cell system with higher durability, improved fuel efficiency, and lower production costs, targeting heavy-duty trucks, buses, rail, and stationary applications after 2026.
- March 2025: Toyota Motor Corporation presented its hydrogen technology roadmap at the 2025 Hydrogen and Fuel Cell Seminar, highlighting expanded commercial vehicle applications and new collaborations to accelerate hydrogen mobility.
- July 2025: Stellantis discontinued its hydrogen fuel cell van development program and canceled the planned launch of its hydrogen powered Pro One vehicle range, citing insufficient hydrogen infrastructure and limited commercial viability.
- January 2026: Honda Motor Co., Ltd. announced it would end production at its Fuel Cell System Manufacturing LLC joint venture with General Motors before the end of 2026 while shifting to an independently developed next generation fuel cell platform.
- March 2026: Toyota Motor Corporation agreed to join the Cellcentric hydrogen fuel cell joint venture established by Volvo Group and Daimler Truck to accelerate fuel cell development for heavy-duty trucks and reduce technology costs.
Geopolitical Impact Analysis
According to the World Bank, platinum group metal supply concentration exposes FCEV catalyst layers to geopolitical risk, with South Africa and Russia holding roughly 80% of global platinum output. Sanctions and export friction can lift catalyst input costs sharply. Data from the IEA shows platinum demand for fuel cells rising as stack production scales. This means supply shocks flow straight into stack pricing. Therefore, OEMs are securing multi-year metal contracts to shield margins.
The World Shipping Council reports that Red Sea rerouting has added 10 to 14 days to Asia-Europe transit, raising delivery risk for hydrogen components and stacks. As reported by UNCTAD, container freight rates spiked over 100% during peak disruption periods. This lengthens supply chains feeding European FCEV assembly lines. As a result, manufacturers are shifting toward regional sourcing to protect production schedules and control landed component costs.
Report Scope
| Report Features | Description |
|---|---|
| Market Value (2025) | USD 7.1 Billion |
| Forecast Revenue (2035) | USD 77.4 Billion |
| CAGR (2026-2035) | 27.1% |
| Base Year for Estimation | 2025 |
| Historic Period | 2020-2024 |
| Forecast Period | 2026-2035 |
| Report Coverage | Revenue Forecast, Market Dynamics, Market Opportunity Analysis, Technology and Innovation Landscape, Competitive Landscape, Recent Developments |
| Segments Covered | By Vehicle (Passenger Cars [Sedans, Hatchbacks, SUVs], Commercial Vehicles [LCV, MCV, HCV], Two & Three Wheelers), By Fuel Cell (Phosphoric acid fuel cell, Proton exchange membrane, Solid oxide fuel cell), By Range (Short Range, Medium Range, Long Range), By Drive (FWD, RWD, AWD), By Application (Personal use, Commercial fleet, Last-mile delivery, Logistics & freight, Ride-hailing & shared mobility, Public transportation, Industrial & material handling, Government & infrastructure projects) |
| Regional Analysis | North America (US and Canada), Europe (Germany, France, The UK, Spain, Italy, and Rest of Europe), Asia Pacific (China, Japan, South Korea, India, Australia, and Rest of APAC), Latin America (Brazil, Mexico, and Rest of Latin America), Middle East and Africa (GCC, South Africa, and Rest of MEA) |
| Competitive Landscape | Ashok Leyland, Audi AG, Ballard Power Systems Inc., Bayerische Motoren Werke AG, Denso Global, Dongfeng Motor Corporation, FAW Group Ltd., General Motors, Honda Motor Co. Ltd., Hyundai Motor Group, Hyzon Motors, Kenworth Truck Company, Mercedes-Benz Group, Mitsubishi Corporation, Nikola Corporation, Nissan Motor Co. Ltd., Renault Group |
| Customization Scope | Customization for segments, region / country-level will be provided. Additional customization can be done based on requirements. |
| Purchase Options | We have three licenses to opt for: Single User License | Multi-User License (Up to 5 Users) | Corporate Use License (Unlimited User and Printable PDF) |





































