Electric Scooter and Motorcycle Market Size, Share, Growth Analysis By Product Type (E-Motorcycle [Dirt Bikes, Sports Motorcycles, Standard Motorcycles], E-Scooter [Folding Scooters, Three-Wheeled Scooters, Standard Scooters, Mopeds]), By Power (Below 3 Kw, 3-10 Kw, Above 10 Kw), By Sales Channel (Online, Offline), By Region and Companies - Industry Segment Outlook, Market Assessment, Competition Scenario, Statistics, Trends and Forecast 2026-2035
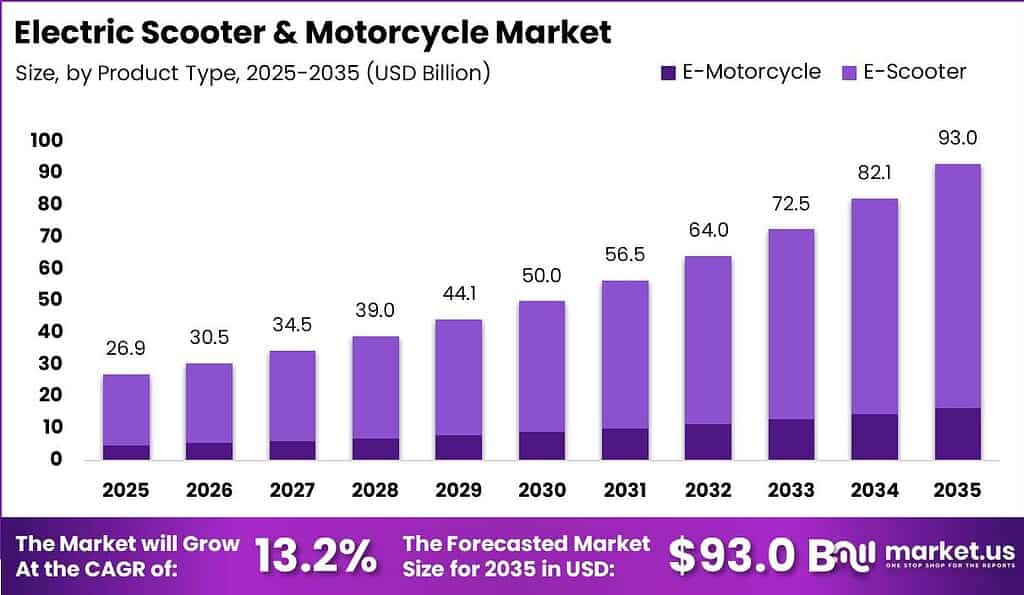
Global Electric Scooter and Motorcycle Market size is expected to be worth around USD 93.0 Billion by 2035 from USD 26.9 Billion in 2025, growing at a CAGR of 13.2% during the forecast period 2026 to 2035.
The Electric Scooter and Motorcycle Market covers battery electric two-wheelers sold for personal commuting, commercial delivery, and shared mobility. Product lines split into e-scooters and e-motorcycles, then by power band and sales channel. Therefore, buyers compare range, swap access, and total ownership cost before they commit capital.
Key Takeaways
The market reaches USD 26.9 Billion in 2025 and is projected to hit USD 93.0 Billion by 2035 at a 13.2% CAGR.
E-Scooter leads the product mix with an 82.34% share in 2025.
The 3-10 Kw power band holds a 46.78% share in 2025.
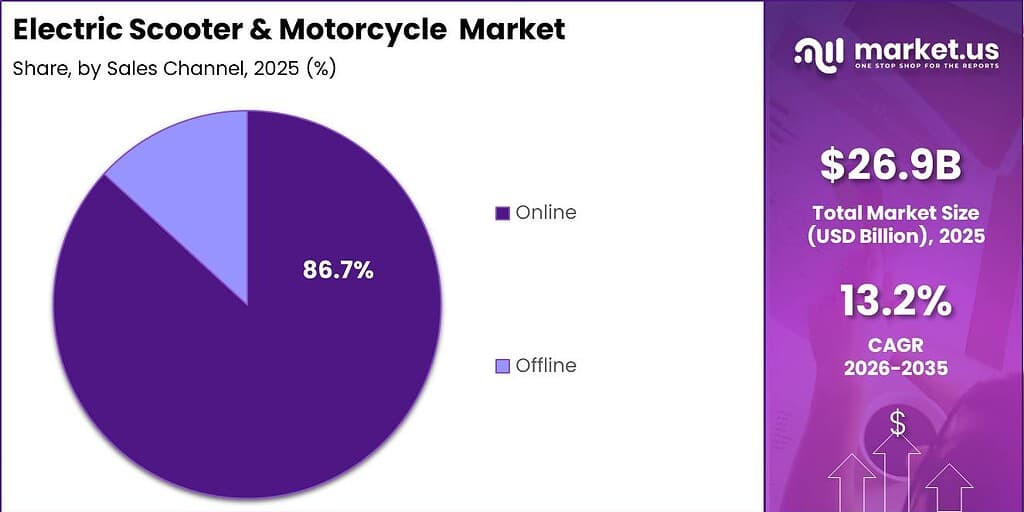
Online sales command an 86.7% channel share in 2025.
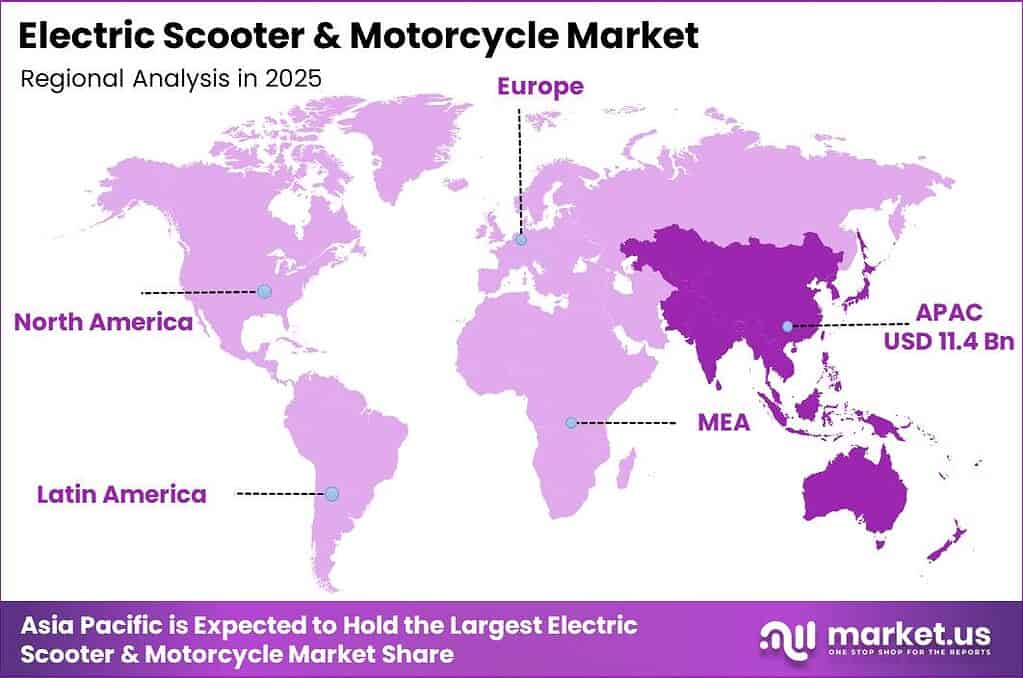
Asia-Pacific dominates with a 42.34% share valued at USD 11.40 Billion in 2025.
Government zero-emission rules and purchase incentives cut the cash gap versus petrol two-wheelers in dense Asian cities. Fleet operators respond by shifting last-mile routes onto electric scooters that lower fuel spend per drop. This creates steady volume for makers that pair vehicles with swappable packs and simple depot charging. In June 2026, Lime announced U.S. IPO plans targeting a valuation of up to USD 1.66 Billion to fund global scooter expansion.
According to the IEA, around 10% of the global two- and three-wheeler fleet was electric in 2025, the highest electrification rate among road modes. This stock base anchors replacement demand as cities tighten tailpipe rules. As a result, suppliers that lock multi-year fleet contracts gain predictable utilization for battery and motor lines.
As reported by the IEA, global electric two- and three-wheeler sales reached about 11 million units in 2025, or around 15% of worldwide two- and three-wheeler sales. Delivery and ride-hail fleets drive much of that unit flow because energy cost per kilometer favors electric drivetrains. Investors should track fleet tender wins as a leading signal of near-term volume.
Product Type Analysis
E-Scooter dominates with 82.34% due to urban commute price fit.
In 2025, E-Scooter held a dominant market position in the By Product Type segment of Electric Scooter and Motorcycle Market, with a 82.34% share. Chinese customs-linked trade tallies show electric two-wheeler exports of 9.58 million units from January to May 2025, worth USD 2.65 Billion. This volume confirms scooter formats move fastest through export and city retail pipelines. Brands that deepen mid-price standard scooter SKUs capture the densest daily-commute pool first.
E-Motorcycle lines target riders who need higher speed and longer range than scooter platforms deliver. ICCT tracking shows more than 55 million two-wheelers sold worldwide in the first ten months of 2025, leaving a large conversion runway above scooter duty cycles. In January 2025, Honda unveiled the production-ready Honda EV Fun Concept as its first full-size electric motorcycle for 2025 to 2026 markets. Makers that prove highway-stable packs will peel premium buyers from petrol sports and standard bikes.
Data from the IEA shows electric three-wheelers posted a global sales share above 25% in 2025, nearly double the electric two-wheeler sales share. Three-wheeled scooters serve cargo and passenger trips where stability and payload beat pure speed. This means commercial fleets will keep pulling three-wheel SKUs even when passenger scooter growth cools.
Folding scooters serve multimodal city users who store vehicles in apartments or trains. Standard scooters and mopeds remain the volume core for license-light commuting. Dirt bikes and sports motorcycles sit in niche performance demand. IEA figures show electric two-wheeler unit sales ran almost 8 times electric three-wheeler sales in 2025, so two-wheel formats still set scale economics while those niches hold the remaining product share collectively.
Power Analysis
3-10 Kw dominates with 46.78% due to balanced range and cost.
In 2025, 3-10 Kw held a dominant market position in the By Power segment of Electric Scooter and Motorcycle Market, with a 46.78% share. IEA battery work shows Chinese pack prices ran about 30% below North America and 35% below Europe in 2025, which supports mid-power builds that already sit near petrol price parity. This band fits most urban scooters and light motorcycles without forcing heavy pack cost. OEMs that standardize motors in this window cut SKU complexity and protect margins.
Below 3 Kw products focus on short urban hops, campus use, and entry price points. SIAM-linked India data place electric two-wheelers above 6% of domestic two-wheeler sales in FY25, and low-power models carry much of that first-time buyer wave. Light licensing rules keep this tier accessible. Sellers who bundle home charging and simple finance will convert petrol moped owners fastest here.
Above 10 Kw is the fastest-growing power class because sports and adventure riders demand highway pace and reserve range. Honda’s public electrification plan cited by ICCT scales investment from about USD 640 million in the 2021 to 2025 window toward USD 2.6 billion for 2026 to 2030. This signals serious OEM capital behind higher-output platforms. Suppliers of high-discharge cells and thermal systems gain a premium attachment opportunity as this tier scales.
Sales Channel Analysis
Online dominates with 86.7% due to direct configure-to-order buying.
In 2025, Online held a dominant market position in the By Sales Channel segment of Electric Scooter and Motorcycle Market, with a 86.7% share. Platform retail momentum is visible in India, where Amazon reported two-wheeler sales doubling with electric models as a core driver. Digital catalogs let buyers compare range, warranty, and swap plans without dealer pressure. Brands that own the post-click delivery and service handoff will defend this channel share against pure marketplace discounters.
Offline remains the fastest-growing channel because many buyers still want test rides, finance desks, and same-day service bays. ICCT notes that more than 50% of Indian households and more than 85% of households in Vietnam, Thailand, and Indonesia already own a two-wheeler, so replacement purchases often start in familiar dealerships. This reflects trust in physical inspection before a multi-year asset buy. Dealers that add battery health checks on site will slow pure online leakage.
Fleet and shared-mobility buyers mix both paths, booking online then taking bulk delivery through regional hubs. China alone posted a 54.8% electric two-wheeler sales share in the first ten months of 2025 per ICCT, feeding dense urban fleets that negotiate offline service contracts. This creates hybrid revenue where the click starts online and lifetime service stays local. Channel partners who integrate telematics tickets into workshop workflows lock recurring labor income.
Asia-Pacific Dominates the Electric Scooter and Motorcycle Market with a Market Share of 42.34%, Valued at USD 11.4 Billion
Asia-Pacific leads because dense cities already run on two-wheelers and policy support speeds electric substitution. Figures from the IEA show China, Türkiye, India, and Vietnam together held about 95% of global electric two- and three-wheeler sales in 2025. That concentration rewards localized cell supply and high-throughput assembly. Regional OEMs that control distribution in these four markets set global price benchmarks.
Growth outside the core cluster is rising from a small base and draws investor attention. The IEA reports Africa reached about 70,000 electric two-wheeler sales in 2025, more than 80 times the level at the start of the decade. IEA data also show Vietnam doubled electric two-wheeler sales in 2025 and became the main growth engine outside China. Early movers who finance swap networks in these corridors can shape brand preference before incumbents fully arrive.
Europe is shifting toward full-size electric motorcycles with fast-charge hardware. In January 2026, Honda began WN7 market rollout preparations with customer deliveries scheduled across Europe during 2026. In July 2026, Lime completed its Nasdaq debut and raised about USD 174 million to expand electric scooter and micromobility operations worldwide. This signals parallel premium motorcycle and shared-scooter capital flowing into Western cities.
Key Regions and Countries
North America
US
Canada
Europe
Germany
France
The UK
Spain
Italy
Rest of Europe
Asia Pacific
China
Japan
South Korea
India
Australia
Rest of APAC
Latin America
Brazil
Mexico
Rest of Latin America
Middle East and Africa
GCC
South Africa
Rest of MEA
Market Dynamics
Market Opportunity Analysis - High-power bikes, offline service, and Africa fleets still look underbought
Above 10 Kw electric motorcycles remain a thin slice beside scooter volume, yet they are the fastest-growing power class. Sports and adventure buyers still lack deep model choice versus petrol peers. Entrants that ship credible highway range can price above commodity scooters and avoid pure cost wars. This creates a brand ladder for OEMs stuck in low-margin commute hardware.
Offline retail is the fastest-growing channel even while online holds most sales today. Many replacement buyers still demand test rides and on-site finance before they switch powertrains. Dealers who package inspection, insurance, and first-year service can reclaim margin that pure marketplaces discard. Regional distributors should treat workshop capacity as a growth asset, not a cost center.
Africa’s electric two-wheeler base is rising quickly from a small start and still lacks dense brand coverage. Shared motorcycle taxis concentrate daily kilometers that favor battery swap economics. Investors who fund local assembly plus swap depots can shape standards before global majors fully commit. Early utilization data will decide which capital partners scale beyond pilot cities.
E-Motorcycle platforms overall trail E-Scooter share by a wide margin inside the product mix. That gap leaves room for dirt, sports, and standard electric bikes aimed at leisure and long-commute niches. Suppliers who share scooter cell lines with motorcycle frames can reuse pack cost advantages. This means capital efficiency improves when one battery architecture serves both product families.
Technology and Innovation Landscape - Cheaper cells, smarter packs, and OTA features rewrite margins
LFP and sodium-ion chemistries are moving into affordable scooter packs and cutting reliance on higher-cost nickel blends. Lower cell cost supports street prices that match petrol mopeds in more cities. Manufacturers that dual-source these chemistries reduce commodity risk on entry models. Buyers gain safer thermal profiles that ease urban parking rules.
AI-enabled battery health monitoring and predictive maintenance are becoming standard connected features on premium electric two-wheelers. Fleets use state-of-health scores to time pack swaps before roadside failures. This reflects a shift from pure hardware sales toward uptime guarantees. Software vendors attached to OEM telematics stacks can bill per vehicle month.
Subscription battery ownership and battery-as-a-service models separate pack cost from the vehicle invoice. Riders pay for energy access while operators retain residual value on cells. This creates sticky recurring revenue and lowers the cash hurdle for first-time electric buyers. Networks that hit high station utilization will outcompete fixed-battery rivals on total cost.
OEM over-the-air software updates now tune performance, range estimates, and feature unlocks after delivery. UNECE has collected public EV charging infrastructure data from national statistical offices since 2023, improving how planners site charge and swap assets. Better public data plus OTA control lets brands fix firmware issues without workshop visits. Investors should value update cadence as a retention metric beside unit share.
Drivers
Battery pack deflation is the strongest near-term growth engine for electric scooters and motorcycles. Market.us benchmark tracking placed the volume-weighted pack average near USD 108 per kWh by end-2025, while IEA data show Chinese cell prices fell nearly 30% in 2024 versus only 10-15% in Europe. Because the pack is 35-45% of an e-scooter bill of materials, each USD 10 per kWh cut trims roughly 2-3% off landed unit cost and pushes more models to petrol price parity.
IEA and ICCT registration evidence link that cost curve to a global e2W sales share near 15% over the first ten months of 2025. OEMs can redirect saved cell cost into 4-6 points of gross-margin recovery or into sharper street pricing. This means the category is moving from subsidy dependence toward self-sustaining hardware economics, with room to layer battery subscriptions on top.
Driver
(~) % Impact on CAGR Forecast
Geographic Relevance
Impact Timeline
Battery pack cost decline & price parity
+3.4%
China, India, Southeast Asia
Short term (2 years or less)
Demand-side purchase subsidies & GST relief
+2.6%
India, ASEAN, Europe
Short term (2 years or less)
Urban fuel-cost arbitrage vs. ICE
+1.9%
India, Vietnam, Indonesia
Medium term (2 to 4 years)
Last-mile delivery & gig-fleet electrification
+1.5%
India, China, Brazil
Medium term (2 to 4 years)
Domestic manufacturing localization incentives
+1.2%
India, China
Medium term (2 to 4 years)
Expanding public & swappable charging density
+0.9%
China, India, Europe
Medium term (2 to 4 years)
Restraints
Subsidy tapering is the sharpest brake on near-term conversions. IEA Global EV Policy Explorer data show incentives once covered up to 40% of eligible vehicle cost in supported markets. Each cut reopens an effective petrol-to-electric price gap of about 8-12% for the most price-sensitive commuter tier. First-time buyers who already face double-digit lending rates then delay purchase decisions.
OEMs often absorb part of the lost support to defend monthly registrations. That choice compresses contribution margins by roughly 3-5 points and pushes some assembly CapEx flagged for 2025 to 2026 into later periods. Consequently, volume plans tied to scheme calendars carry higher forecast risk until unsubsidized price parity is fully secure across entry trims.
Restraint
(~) % Impact on CAGR Forecast
Geographic Relevance
Impact Timeline
Subsidy tapering & abrupt scheme expiry
-2.4%
India, Europe
Short term (2 years or less)
Elevated financing & retail lending rates
-1.8%
India, Brazil, ASEAN
Short term (2 years or less)
Upfront price gap in low-income segments
-1.5%
India, Africa, Pakistan
Short term (2 years or less)
Fire-safety recalls & certification halts
-1.1%
India, Southeast Asia
Short term (2 years or less)
Import tariffs on cells & components
-0.9%
India, United States
Medium term (2 to 4 years)
Challenges
Cell supply remains heavily concentrated, with China holding well over 70% of global lithium-ion output per IEA supply-chain assessments. Importers outside China face delivery windows of 8-14 weeks and landed-cost premiums near 15-20% versus domestic Chinese OEMs. Defensive inventory then inflates per-unit cost by an estimated 4-7% and ties up working capital that smaller brands need for marketing and service.
Domestic gigafactory programs such as India’s PLI pathway only mature beyond 2028 on current ministry targets. Until alternate Korean and Japanese cell streams scale, price shocks and quota risk stay embedded in non-China bills of materials. This creates a strategic fork: fund vertical integration now or accept structurally thinner margins through the decade.
Challenge
(~) % CAGR Friction Drag
Geographic Relevance
Mitigation Horizon
Cell supply-chain concentration risk
-1.7%
Global, China-dependent
Long term (4 years or more)
Critical-mineral price volatility
-1.3%
Global
Medium term (2 to 4 years)
Skilled EV powertrain talent deficit
-1.0%
India, ASEAN
Medium term (2 to 4 years)
Battery-recycling & end-of-life gaps
-0.8%
India, Europe
Long term (4 years or more)
Grid strain & uneven charging uptime
-0.7%
India, Indonesia, Africa
Long term (4 years or more)
Opportunities
Battery-swapping subscriptions open a revenue path that pure hardware sales do not capture. Removing the pack can cut the vehicle sticker by 30-40%, which lowers the finance barrier World Bank lending patterns flag across South Asia. Swap operators target steady-state energy margins near 25-35% once station utilization clears roughly the 60% breakeven threshold. Early standard-setters can lock fleet corridors before proprietary networks close the window.
ICCT registration patterns show the densest delivery and commuter fleets still cluster where most global e2W volume already sits. Players that pair low upfront scooters with per-kilometre energy contracts convert one-time buyers into recurring accounts. This creates a second profit pool that cushions hardware price wars and rewards balance-sheet strength for station rollouts.
Opportunity
(~) % Potential CAGR Upside
Geographic Relevance
Execution Window
Battery-swapping subscription monetization
+2.2%
India, Indonesia, Vietnam
Medium term (2 to 4 years)
ICE-registration bans forcing conversion
+1.8%
India, Europe
Medium term (2 to 4 years)
Untapped African & Latin American white space
+1.6%
Africa, Latin America
Long term (4 years or more)
Second-life battery & recycling revenue
+1.1%
Global
Long term (4 years or more)
Connected-vehicle software & data ARPU
+0.9%
Global
Medium term (2 to 4 years)
Fragmented-OEM M&A roll-up consolidation
+0.7%
India, Europe
Long term (4 years or more)
Key Company Insights
Aima Electric sits among the named lead suppliers competing across high-volume electric scooter platforms in Asia-centered channels. Scale manufacturing discipline matters because UNEP counts about 270 million motorcycles already on global roads and roughly 52 million units sold each year. Firms that convert even a thin slice of that installed base win durable parts and battery follow-on revenue.
Niu Technologies competes in the same key-player set with connected electric two-wheeler offerings aimed at style-led urban buyers. UNEP projects the global motorcycle fleet will exceed 400 million vehicles by 2050, a rise of nearly 50% from today’s stock. This long runway favors brands that build software stickiness early, yet it also raises the cost of lagging on range and service density.
Key Players
Aima Electric
Niu Technologies
Ola Electric
Tailg Group
Yadea Group
Hero Motocorp
Luyuan Electric
Gogoro
Other Key Players
Recent Developments
March 2025: Verge Motorcycles launched the Verge Next expansion strategy to accelerate global sales of its hubless electric motorcycles across Europe and North America.
July 2025: Donut Lab, a spin-off from Verge Motorcycles, raised €25 million in seed funding to expand its modular in-wheel electric motor technology for motorcycles and scooters.
September 2025: Honda officially announced the Honda WN7, its first production full-size electric motorcycle for the European market featuring CCS2 DC fast charging.
November 2025: Honda showcased the WN7 at EICMA 2025, marking the global debut of its new WN-series electric motorcycle platform.
Geopolitical Impact Analysis
According to UNCTAD’s Review of Maritime Transport 2025, global maritime trade growth is set to slow to just 0.5% in 2025 after 2.2% growth in 2024. The Shanghai Containerized Freight Index averaged 2,496 points in 2024, up 149% from 2023, which raises landed cost for exported scooters, motors, and cells. This means importers in Africa and Latin America face wider retail prices precisely where electric two-wheelers need affordability to displace petrol fleets.
IEA battery assessments show pack prices in China were 30% lower than in North America and 35% lower than in Europe in 2025. WTO-linked tariff escalation and EU countervailing duties in the 17.4% to 37.6% range on Chinese-built EVs, stacked on a standard 10% vehicle tariff, widen that regional cost gap for finished electric two-wheelers. As a result, non-China assemblers must localize packs or accept thinner margins when shipping complete vehicles across contested trade lanes.
By Product Type (E-Motorcycle [Dirt Bikes, Sports Motorcycles, Standard Motorcycles], E-Scooter [Folding Scooters, Three-Wheeled Scooters, Standard Scooters, Mopeds]), By Power (Below 3 Kw, 3-10 Kw, Above 10 Kw), By Sales Channel (Online, Offline)
Regional Analysis
North America (US and Canada), Europe (Germany, France, The UK, Spain, Italy, and Rest of Europe), Asia Pacific (China, Japan, South Korea, India, Australia, and Rest of APAC), Latin America (Brazil, Mexico, and Rest of Latin America), Middle East and Africa (GCC, South Africa, and Rest of MEA)
Competitive Landscape
Aima Electric, Niu Technologies, Ola Electric, Tailg Group, Yadea Group, Hero Motocorp, Luyuan Electric, Gogoro, Other Key Players
Customization Scope
Customization for segments, region / country-level will be provided. Additional customization can be done based on requirements.
Purchase Options
We have three licenses to opt for: Single User License | Multi-User License (Up to 5 Users) | Corporate Use License (Unlimited User and Printable PDF)