
Quick Navigation
- Report Overview
- Key Takeaways
- Charger Analysis
- Charging Type Analysis
- Connector Type Analysis
- By Charging Level Analysis
- By Application Analysis
- Key Market Segments
- Driving Factor
- Restraining Factor
- Geopolitical Impact Analysis
- Growth Opportunity
- Latest Trends
- Regional Analysis
- Key Player Analysis
- Recent Developments
- Report Scope
Report Overview
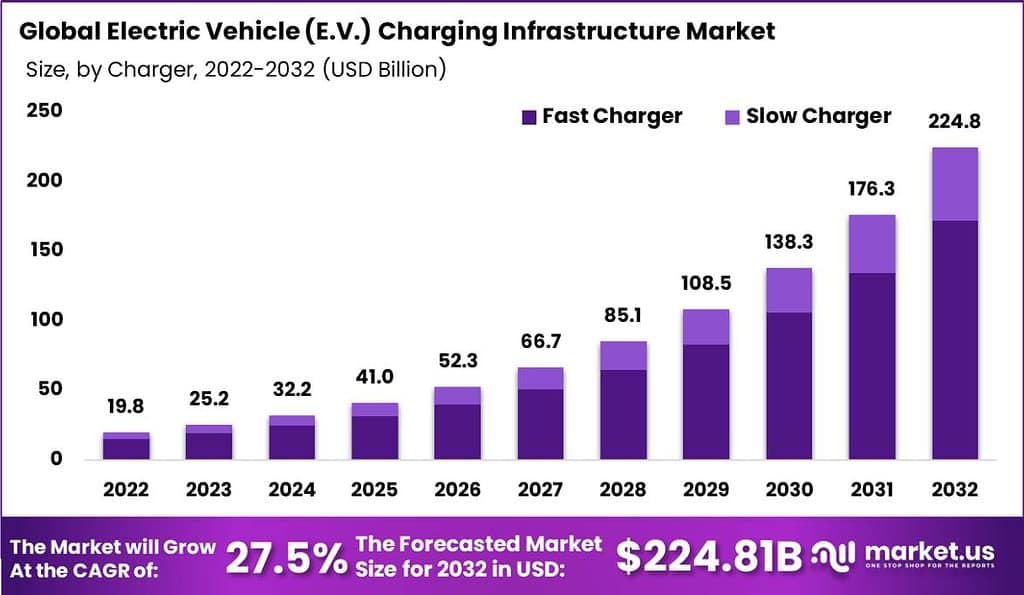
The Global Electric Vehicle (EV) Charging Infrastructure Market size is expected to be worth around USD 224.8 Billion by 2032, from USD 25.2 Billion in 2023, growing at a CAGR of 27.5% during the forecast period from 2023 to 2032.
The development of an extensive and robust electric vehicle (EV) charging infrastructure is crucial for the widespread adoption of electric vehicles and the transition to a sustainable transportation system. EV charging infrastructure refers to the network of charging stations and associated technologies that enable EV owners to recharge their vehicles conveniently and efficiently. This infrastructure plays a vital role in addressing the range anxiety concerns of EV users and promoting the overall growth and acceptance of electric vehicles.
The Electric Vehicle (EV) Charging Infrastructure market is witnessing rapid growth driven by several key factors. Firstly, supportive government policies and initiatives aimed at promoting electric mobility, coupled with stringent emissions regulations, are incentivizing investments in charging infrastructure development. Additionally, advancements in battery technology and the proliferation of electric vehicle models are bolstering consumer confidence in EV adoption, thereby fueling the demand for charging infrastructure.
The global landscape of electric vehicle (EV) charging infrastructure has shown remarkable growth, with approximately 2.7 million public charging points available worldwide. A significant surge was observed in 2022, with over 900,000 new charging points installed, reflecting a 55% increase compared to the previous year. This expansion pace aligns with the pre-pandemic growth rate of 50% during 2015-2019, indicating a robust recovery and continued interest in EV adoption.
By 2024, it is anticipated that 55% of new installations will be strategically located in multi-unit residential buildings and workplaces. This shift underscores the growing recognition of the need for accessible charging solutions where people live and work, facilitating a more seamless integration of EVs into daily routines.
Simultaneously, the adoption of bi-directional charging technology, which empowers vehicles with vehicle-to-grid (V2G) capabilities, is forecasted to witness a 45% increase among charging station providers from 2022 to 2024. This technology not only enhances the utility of EVs as mobile energy storage units but also contributes to the stabilization of the electrical grid by allowing energy flow back from the vehicle to the grid during peak demand times.
The integration of renewable energy sources into public charging stations is another notable trend, with over 60% of such facilities expected to utilize solar panels or wind turbines by 2024. This approach significantly amplifies the environmental benefits of EVs, further reducing the carbon footprint associated with electric mobility.
Commercial and fleet vehicle charging infrastructure is also set to expand, with approximately 50% of new installations in 2024 being dedicated to this segment. This development is indicative of the increasing electrification of commercial transport and the strategic focus on supporting fleet operators in their transition to electric vehicles.
Moreover, over 65% of public charging stations are projected to offer real-time availability and status updates via digital platforms by 2024. This technological enhancement is critical for improving user experience, enabling EV drivers to efficiently plan their charging sessions and mitigate concerns over station occupancy or operational status.
Key Takeaways
- In 2023, the Global Electric Vehicle (EV) Charging Infrastructure Market was valued at USD 25.2 Billion and it is estimated to register the highest CAGR of 27.5% between 2023 and 2032.
- Based on Charger, fast charger dominates the market with major revenue share of 70.8%.
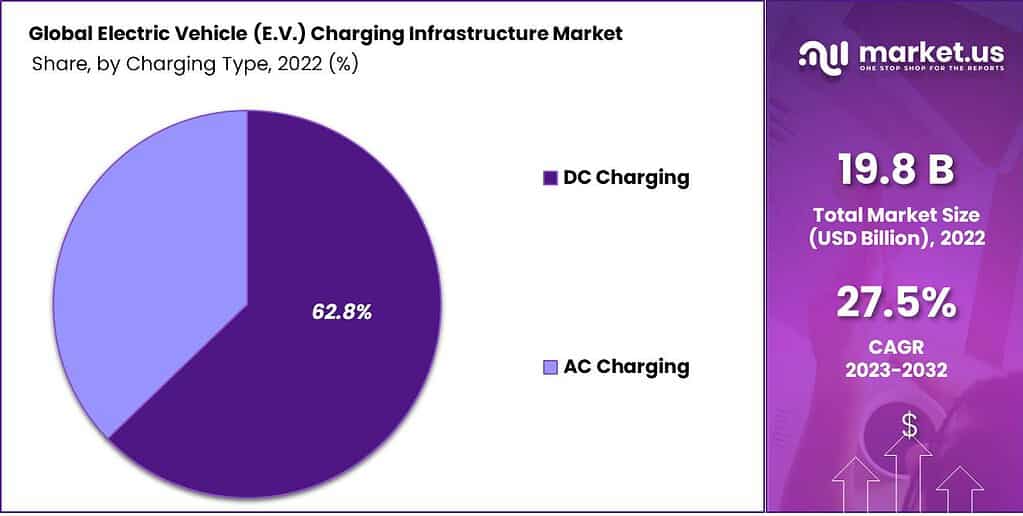
- Based on Charging Type, DC charging dominates the segment with major revenue share of 58.6%.
- Based on Connector Type, CCS leads the market with major revenue share of 39.8%.
- Based on Charging Level, level 2 holds the major revenue share of 51.6% to dominate the market.
- Based on Application, commercial application leads the segment with major revenue share of 63.4%.
- Integration of advance technology to monitor the charging in real time is trending in the market.
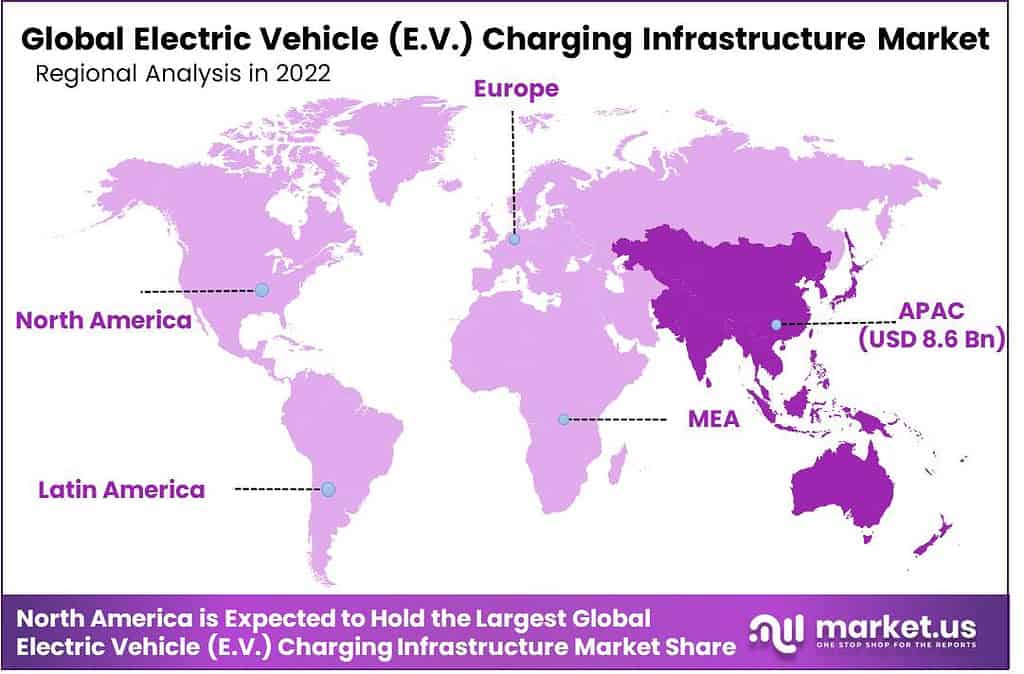
- Based on Region, Asia-Pacific leads the market with a major revenue share of 43.7%.
- Some of the key layers in the market are Schneider Electric, Siemens, Tesla, Inc., AeroVironment Inc., ABB and others
Charger Analysis
Fast Charger Dominates the Market with Major Revenue Share of 70.8%
Based on charger, market is divided into fast charger and slow charger. Among these charger, fast charger leads the market with major revenue share of 70.8%. Fast chargers provide an unrivalled advantage in terms of convenience and time efficiency, making the EV more appealing in our fast-paced world due to fast fueling stops. Fast chargers also enable consumers to more readily adapt EVs as an investment with higher gas savings potential than their gasoline-fueled alternatives.
The rising popularity of electric vehicles for long-distance travel and ridesharing platforms has fueled an increasing need for fast charging solutions to enable longer journeys with minimal downtime. Government and private firms alike have made substantial investments in fast charger technology and infrastructure development, leading to wider availability of fast chargers that make them more accessible to consumers, further cementing their dominance. Fast chargers’ charging capabilities and growing EV market make them the go-to choice for both individuals and businesses, cementing their position within the EV Charging Infrastructure market.
Charging Type Analysis
DC Charging Dominates the Segment with Major Revenue Share of 58.6%
On the basis of charging type, market is divided into AC charging and DC charging. From these charging types, DC charging holds the major revenue share of 58.6% to dominate the market. DC chargers offer significantly faster charging speeds compared to AC chargers. EV users increasingly prioritize rapid charging to minimize downtime, especially during long journeys, making DC chargers the preferred choice.
The automakers are increasingly designing their vehicles with DC-compatible charging ports, further boosting the demand for DC infrastructure. Compatibility drives consumer adoption and incentivizes the development of more DC charging stations. Moreover, public charging networks and commercial charging stations are inclined towards deploying DC chargers to cater to a wider range of EVs efficiently. This strategic approach enhances the prominence of DC charging in the market.
Connector Type Analysis
CCS Leads the Market with Major Revenue Share of 39.8%.
Based on connector type, market is classified into CHAdeMO, CCS, and other connector types. Out of these connector types, CCS dominates the market with major revenue share of 39.8%. CCS has gained widespread support from major automakers in Europe and North America.
This unified backing has led to a consistent and widely adopted standard, simplifying manufacturing and infrastructure development, which, in turn, lowers costs and fosters market expansion. CCS connectors offer versatility by accommodating both DC and AC charging, making them suitable for a broad range of EVs. This flexibility appeals to consumers who seek compatibility and future-proofing as the EV landscape evolves.
Furthermore, government regulations in various regions have endorsed CCS as the standard, reinforcing its market dominance. With a well-established network of charging stations and broad vehicle support, CCS has become the preferred choice for both automakers and consumers.
By Charging Level Analysis
Level 2 Holds the Major Revenue Share of 51.6% to Dominate the Market.
On the basis of charging level, market is classified into level 1, level 2, and level 3. Out of these charging levels, level 2 dominated the market with major revenue share of 51.6%. level 2 chargers strike a balance between charging speed and infrastructure cost. They offer faster charging compared to level 1 (standard household outlets) while remaining more cost-effective to install and operate than level 3 (DC fast chargers).
This cost-efficiency encourages both public and private sector investment in level 2 charging stations, expanding their availability. level 2 chargers are versatile and compatible with a wide range of EVs, making them an attractive option for consumers who own different EV models. This compatibility simplifies infrastructure planning for charging networks and appeals to a broader consumer base.
By Application Analysis
Commercial Application Leads the Segment with Major Revenue Share of 63.4%.
Based on application, market is divided into commercial and residential. Among these applications, commercial application leads the segment with major revenue share of 63.4%. This dominance can be attributed to the robust growth of commercial fleets transitioning to electric vehicles. Businesses are increasingly recognizing the cost-efficiency and sustainability benefits of EVs for their fleets.
Moreover, commercial charging infrastructure is essential for logistics, ride-sharing services, and public transportation, further boosting demand. Government incentives and regulations that encourage businesses to adopt EVs also contribute to the commercial segment’s prominence. As the world moves towards a greener and more sustainable future, the commercial application of EV charging infrastructure is expected to continue its strong growth trajectory.
Key Market Segments
Charger
- Fast Charger
- Slow Charger
Charging Type
- AC Charging
- DC Charging
Connector Type
- CHAdeMO
- CCS
- Other Connector Types
Charging Level
- Level 1
- Level 2
- Level 3
Application
- Residential
- Commercial
Driving Factor
Increasing adoption of electrical vehicles owing to government initiatives
The Market’s growth can be the pressing necessity to fight climate change and cut carbon dioxide emissions. Electric vehicles that have no tailpipe emissions are thought to be an essential element in reaching the goal of reducing emissions. The development of EV charging infrastructure is essential to reduce anxiety over range and provide easy access to charging stations, thus facilitating the adoption of electric vehicles.
Restraining Factor
Installation Costs and Range Anxiety
Installing charging infrastructure can be expensive, especially fast-charging stations, which may prevent businesses and governments from investing in widespread infrastructure solutions. While advancements have made charging times faster for EVs than fueling up conventional cars, range anxiety remains an obstacle for prospective EV buyers.
Geopolitical Impact Analysis
International Conflicts Affect Negatively on the Market.
As countries aim for leadership in the EV industry, geopolitical tensions arise over access to key materials like lithium and rare earth elements – leading to supply chain disruptions. Trade policies and international emissions standards agreements also can have an effect on market dynamics; as major powers vie to gain dominance over EV technology and infrastructure such as US, China, EU etc; investment patterns and regulations may change as major powers vie with each other for dominance over investment patterns and regulations affecting them all. Geopolitical instability or disputes over energy resources could further disrupt this growth so it’s imperative that industry players carefully navigate these complex geopolitical factors for optimal success.
Growth Opportunity
Market Expansion and Innovative Business Models are Expected to Create Many Opportunities in the Market Over the Forecast Period.
Emerging markets such as Asia-Pacific and Latin America present significant expansion potential as they adopt electric vehicles (EVs) and build out charging infrastructure. Governments across these regions are realizing the potential of electric mobility and are taking steps to encourage its adoption by creating supportive policies and offering incentives to promote it.
Businesses are exploring innovative business models like battery swapping stations and charging-as-a-service to cover the high upfront costs associated with electric vehicle (EV) charging infrastructure. Battery swapping offers an alternative means for electric vehicle (EV) owners to replace depleted batteries with fully charged ones, significantly cutting charging time and infrastructure requirements.
Latest Trends
Integration of Advance Technology to Monitor the Charging in Real time is Trending in the Market.
Intelligent EV charging is supported through intelligent technology that provides owners of charging stations with real-time information about linked chargers and events. Since stations are connected to the internet, their data can be controlled based on several signals, such as the fluctuating output of energy, local electricity consumption, the number of vehicles that are charged, and the usage of electrical devices on the same site. The charging of electric vehicles must be judicious to create an environmentally sustainable energy system based on renewable resources.
Smart charging requires the identification of the electric vehicle’s driver when charging at a station. The identification establishes a connection with the EV driver as well as the charging station and the event of charging. The correct fee can be charged to the right client, and the money is redirected to the proper charging station’s owner. All of this happens automatically due to the fact that it’s smart.
Regional Analysis
The Asia Pacific region dominates the market with major revenue share of 43.7%. This massive growth of Asia Pacific region is due to the Asia Pacific region is home to some of the world’s largest and most rapidly growing economies, including China, South Korea and India. These countries have made substantial investments in EV adoption and infrastructure development, fostering a robust market.
Asia Pacific benefits from strong government support and policies aimed at promoting electric mobility and reducing carbon emissions. These initiatives include incentives, subsidies, and regulations that encourage both consumers and businesses to embrace EVs and invest in charging infrastructure. Furthermore, the dense urban populations in many Asia Pacific cities drive demand for convenient and accessible charging options, further fueling market growth.
After Asia Pacific, Europe region is expected to grow at a significant CAGR throughout the forecast period. Stringent regulations from EU commission regarding the carbon emission are expected to drive the growth of Europe region during the forecast period.
Key Regions and Countries Covered in this Report
- North America
- The US
- Canada
- Europe
- Germany
- France
- The UK
- Spain
- Italy
- Russia
- Netherland
- Rest of Europe
- APAC
- China
- Japan
- South Korea
- India
- Australia
- New Zealand
- Singapore
- Thailand
- Vietnam
- Rest of APAC
- Latin America
- Brazil
- Mexico
- Rest of Latin America
- Middle East & Africa
- South Africa
- Saudi Arabia
- UAE
- Rest of MEA
Key Player Analysis
Market players are constantly seeking new and improved products for the marketplace. To expand their business further, many opt to collaborate with other market participants or EV manufacturers. Some prominent players in the Electric Vehicle (EV) charging infrastructure market include AeroVironment Inc., ABB, BP Chargemaster, ChargePoint, Inc., ClipperCreek, Eaton, GENERAL ELECTRIC, Leviton Manufacturing Co., Inc., SemaConnect, Inc., Schneider Electric, Siemens, Tesla, Inc., Webasto, and Other Key Players.
These companies are engaging in strategic partnerships and new product developments to expand their market shares. These insights reflect the dynamic growth and advancements in the electric vehicle(EV) charging infrastructure market, driven by the increasing adoption of electric vehicles and the supportive regulatory environment globally.
Top Market Leaders
- AeroVironment Inc.
- ABB
- BP Chargemaster
- ChargePoint, Inc.
- ClipperCreek
- Eaton
- GENERAL ELECTRIC
- Leviton Manufacturing Co., Inc.
- SemaConnect, Inc.
- Schneider Electric
- Siemens
- Tesla, Inc.
- Webasto
- Other Key Players
Recent Developments
1. AeroVironment Inc.:
- February 2023: Launched the “SkyCharger,” a portable and foldable solar EV charger for outdoor adventures and emergency purposes.
- August 2023: Partnered with “Duke Energy” to deploy solar-powered EV charging stations in North Carolina, expanding access to renewable energy charging options.
- October 2023: Announced the development of a new high-power EV charging solution targeting fleet applications.
2. ABB:
- March 2023: Launched the “Terra 360,” an ultra-fast charging station capable of delivering up to 360 kW, significantly reducing charging times.
- June 2023: Signed a contract with “Ionity” to supply fast chargers for a major European highway network, boosting charging infrastructure across the continent.
- November 2023: Partnered with “Enel X” to develop and deploy smart charging solutions for commercial and industrial applications.
Report Scope
| Report Features | Description |
|---|---|
| Market Value (2023) | USD 25.2 Bn |
| Forecast Revenue (2032) | USD 224.8 Bn |
| CAGR (2023-2032) | 27.5% |
| Base Year for Estimation | 2023 |
| Historic Period | 2018-2022 |
| Forecast Period | 2023-2032 |
| Report Coverage | Revenue Forecast, Market Dynamics, COVID-19 Impact, Competitive Landscape, Recent Developments |
| Segments Covered | By Charger (Fast Charger and Slow Charger), By Charging Type (AC Charging and DC Charging), Connector Type (CHAdeMO, CCS, Other Connector Types), Charging Level (Level 1, Level 2 and Level 3), Application (Residential, Commercial) |
| Regional Analysis | North America – The US & Canada; Europe – Germany, France, The UK, Spain, Italy, Russia, Netherlands, and Rest of Europe; APAC- China, Japan, South Korea, India, Australia, New Zealand, Singapore, Thailand, Vietnam, and Rest of APAC; Latin America- Brazil, Mexico & Rest of Latin America; Middle East & Africa- South Africa, Saudi Arabia, UAE & Rest of MEA |
| Competitive Landscape | AeroVironment Inc., ABB, BP Chargemaster, ChargePoint, Inc., ClipperCreek, Eaton, GENERAL ELECTRIC, Leviton Manufacturing Co., Inc., SemaConnect, Inc., Schneider Electric, Siemens, Tesla, Inc., Webasto, and Other Key Players |
| Customization Scope | Customization for segments, region/country-level will be provided. Moreover, additional customization can be done based on the requirements. |
| Purchase Options | We have three licenses to opt for Single User License, Multi-User License (Up to 5 Users), Corporate Use License (Unlimited User and Printable PDF) |
Frequently Asked Questions (FAQ)
EV charging infrastructure markets are expanding quickly, yet still present some significant obstacles to their rapid development. While more public charging stations are opening, rural and underserved areas still need additional chargers as well as increased standardization of charging connectors and protocols for optimal functioning of charging infrastructure systems.
In 2022, the Global Electric Vehicle (EV) Charging Infrastructure Market was valued at USD 19.8 Billion and it is projected to expand to USD 224.8 Billion by 2032; rising at a CAGR of 27.5% from 2023 to 2032.
China was home to over 1.8 million publicly accessible electric vehicle chargers by 2022 - representing the world's most expansive public charging infrastructure. The United States followed closely behind with 100,000 slow chargers installed nationwide and an additional 28,000 fast chargers across its states and regions.
Cost of installing an electric vehicle (EV) charger varies significantly based on its type and installation needs, with Level 1 chargers typically being the least costly to set up while DC fast chargers often costing significantly more.
The top 5 EV charging infrastructure companies in India are:
- Tata Power
- ABB
- EVRE
- Fortum Charge & Drive
- Magenta Power
Future prospects of electric vehicle (EV) charging infrastructure look bright. Market growth has been rapid and innovative new technologies such as wireless and smart charging networks are being created that could make charging even simpler and cheaper for drivers.
 Charging Infrastructure Market")


