


Market Overview
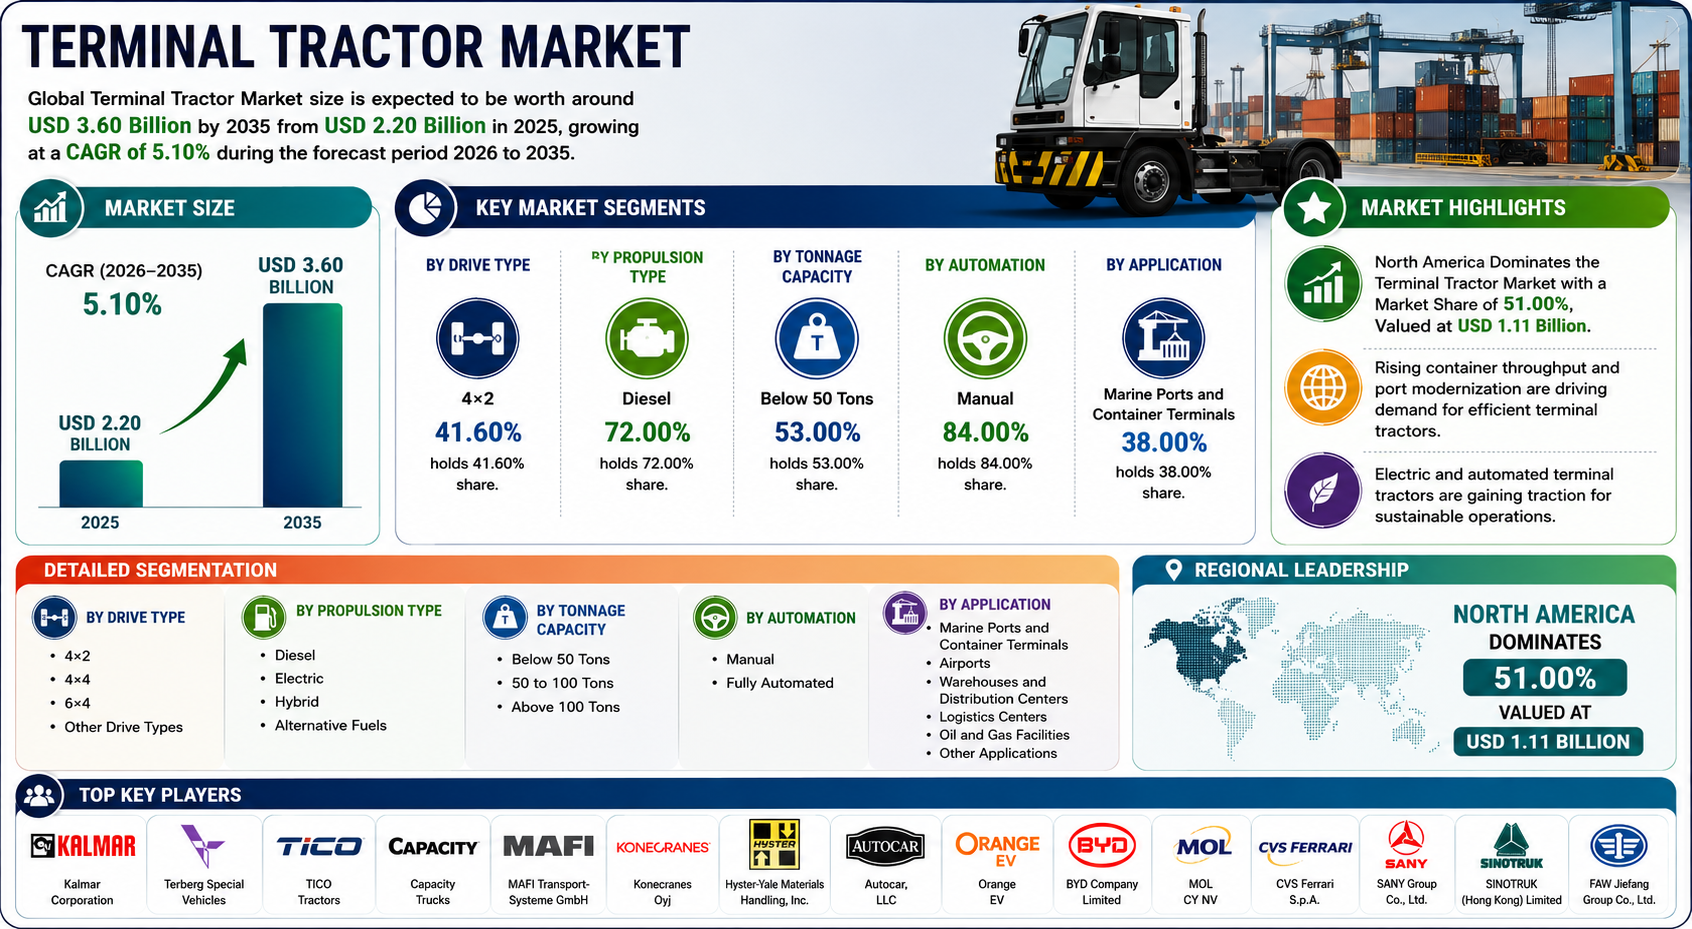
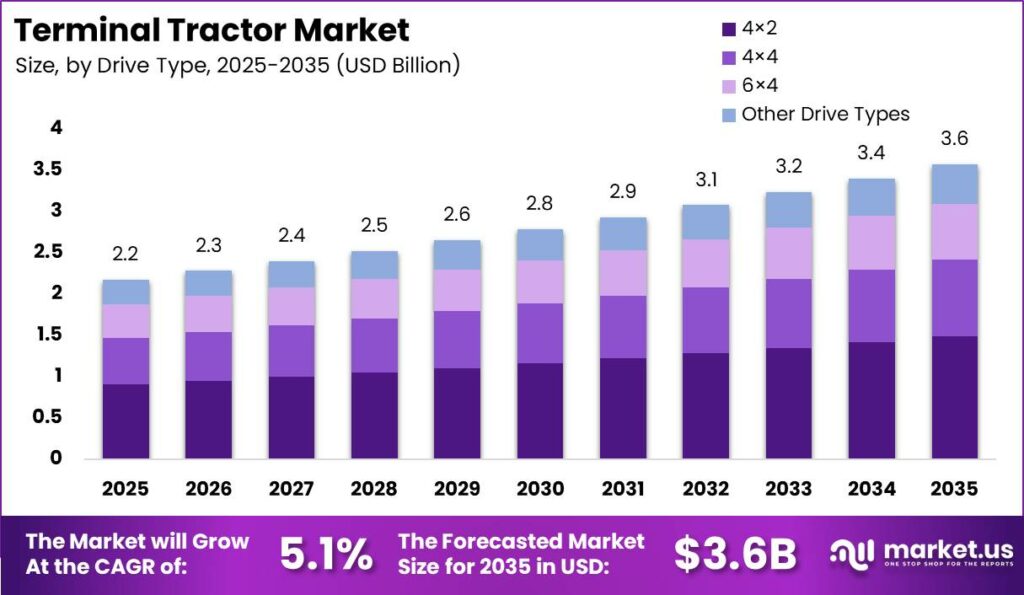
The Terminal Tractor Market is valued at USD 2.20 Billion in 2025 and is projected to reach USD 3.60 Billion by 2035, growing at a CAGR of 5.10% over the forecast period 2026 to 2035. Rising container throughput, fleet electrification mandates, and e-commerce-driven distribution activity underpin this sustained expansion across global port and yard markets.
Terminal tractors are purpose-built vehicles that move trailers and containers inside ports, rail yards, and distribution facilities. Operators deploy them as core yard assets that directly set turnaround speed and labor cost per move. Unlike highway trucks, these machines are optimized for confined-yard duty cycles with short, repetitive routes and high daily starts.
Marine ports, container terminals, warehouses, distribution centers, and airports are the primary end-use sectors driving terminal tractor demand. Container gateways in North America and Asia Pacific generate the highest annual cycle counts. E-commerce fulfillment operators add year-round demand as around-the-clock door activity keeps trailer spotting continuous across large distribution campuses.
Get further insight into the global trends shaping the future of the terminal tractor industry. Request Sample
Battery-electric drivetrains, regenerative braking systems, and telematics-enabled fleet monitoring are reshaping yard equipment economics. Orange EV reported its electric terminal-truck fleet surpassed 10 million cumulative operating hours across more than 340 fleets, with average uptime exceeding 98% versus roughly 75% for comparable diesel units. These operational proof points accelerate electric adoption among fleet managers focused on total cost of ownership.
California Advanced Clean Fleets rules and EU port-access emissions zoning compress the viable window for new diesel spotter orders from 2026 onward. Operators must disclose fleet mix under CARB-style reporting frameworks, accelerating replacement timelines. Sellers who bundle charging infrastructure with electric units win multi-year contracts earlier than pure hardware vendors competing on sticker price alone.
UNCTAD data show ports handled 920 million TEUs worldwide in 2024, a 6.9% year-over-year rise that directly multiplies spotter cycles at every container stack. CALSTART estimates the total U.S. yard tractor stock at roughly 62,000 units, with zero-emission models representing approximately 2.8% of that base. The wide gap between installed diesel stock and zero-emission targets signals a decade-long replacement runway for OEMs and fleet operators.
Key Takeaways
- The Terminal Tractor Market is valued at USD 2.20 Billion in 2025 and is projected to reach USD 3.60 Billion by 2035, growing at a CAGR of 5.10%.
- North America leads with a 51.00% regional share, valued at USD 1.11 Billion in 2025.
- By Drive Type, 4×2 holds a 41.60% share, preferred for paved yard moves at lower unit cost.
- By Propulsion Type, Diesel holds a 72.00% share, reflecting proven duty-cycle reliability and rapid refueling.
- By Tonnage Capacity, Below 50 Tons holds a 53.00% share, covering the majority of standard trailer hostling loads.
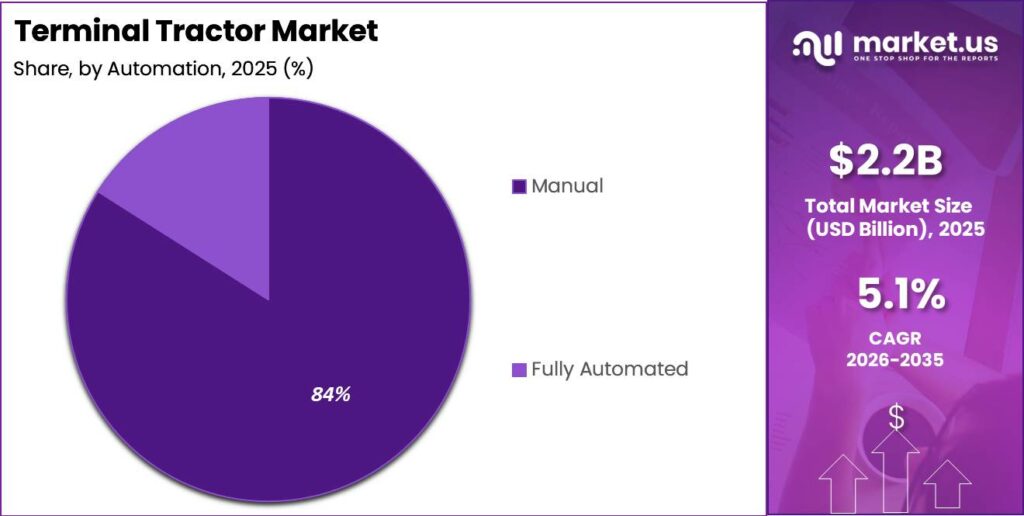
- By Automation, Manual holds an 84.00% share, driven by flexible labor requirements and lower systems cost.
- By Application, Marine Ports and Container Terminals hold a 38.00% share, anchored by high TEU handling intensity.
- UNCTAD reports global ports handled 920 million TEUs in 2024, up 6.9% year over year, directly lifting spotter cycle demand.
- Orange EV’s fleet logged over 10 million cumulative operating hours across 340+ fleets, with uptime above 98%.
- Electric terminal tractor deployments rose roughly 30% between 2023 and 2024 per heavy-duty ZEV tracking data.
- NACFE benchmarking places total cost of ownership parity for electric yard tractors within a 4 to 6 year horizon for suitable duty cycles.
Market Segmentation Overview
The 4×2 drive configuration commands the largest drive-type share at 41.60% in 2025. Two driven wheels deliver sufficient traction on the flat paved surfaces that characterize most container yard operations. Lower unit cost and simpler drivetrain maintenance make this layout the default for high-volume port and distribution center fleets standardizing on a single chassis class.
The 4×4 configuration serves uneven ground, wet dock aprons, and mixed-surface terminals where slip risk is elevated. CALSTART estimates the U.S. yard tractor stock at approximately 62,000 units, with buyers paying a premium for four-wheel drive where grade or weather would stall a standard unit. The 6×4 layout supports heavier container pulls and multi-trailer strings at mega terminals where load charts exceed two-axle limits.
Diesel retains a commanding 72.00% propulsion share due to refueling speed, residual value, and an established aftermarket parts base. Electric terminal tractors fit geofenced yards with predictable short-loop routes and overnight charge windows, currently representing roughly 2.8% of U.S. yard stock per CALSTART data. Early electric adopters inside high-cycle yards report fuel and maintenance cost savings of approximately 15% to 20% per unit annually despite upfront premiums of 40% to 60% above diesel equivalents.
Hybrid systems bridge sites that lack full charging capacity, cutting idle fuel burn without requiring complete grid upgrades. Alternative fuels serve sites where renewable diesel or gas infrastructure already exists. Below 50 Tons leads the tonnage segment at 53.00%, covering the standard single-trailer hostling loads that dominate port and distribution yard moves globally.
Manual operation holds an 84.00% automation share, reflecting the flexible exception-handling that human drivers provide during peak shifts and irregular trailer configurations. Fully automated terminal tractors target controlled low-speed yards with mapped routes and safety fencing. Westwell reported 100 battery-electric autonomous Q-Trucks contracted for the Port of Felixstowe at TOC Europe in June 2026, signaling commercial-scale deployment intent in regulated confined zones.
Marine Ports and Container Terminals lead the application segment at 38.00%, driven by the 920 million TEU throughput recorded globally in 2024. Warehouses and distribution centers rank as the next major demand source, where electric units operating on short door-to-lot loops have eliminated tens of thousands of gallons of diesel per vehicle over operational lifespans. Airports, logistics centers, oil and gas facilities, and intermodal ramps each add specialized duty-cycle demand across the remaining application segments.
Drivers
Near-port emissions mandates including California Advanced Clean Fleets rules and EU port-access emissions zones compress the viable window for new diesel terminal tractor orders from 2026 onward. Electric terminal tractor deployments rose roughly 30% year over year between 2023 and 2024 per heavy-duty ZEV tracking. Confined yard routes of approximately 150 to 200 miles per charge fit current battery pack capacities and push buyers toward electric orders ahead of mandate deadlines.
NACFE captive-fleet benchmarking places total cost of ownership parity within a 4 to 6 year horizon for suitable duty cycles. Early adopter fleets report operating cost reductions of approximately 15% to 20% per unit annually even when upfront electric unit cost runs 40% to 60% above diesel. This economic case shifts OEM revenue models toward financing packages, charging bundles, and telematics subscriptions that generate recurring margin beyond hardware-only transactions.
Use Cases
Marine port operators deploy terminal tractors continuously at container stacks to match crane discharge rates and maintain berth turnaround targets. UNCTAD’s recorded 920 million TEU throughput in 2024 means every extra crane move requires a hostler positioned and ready at the stack. Port-focused OEMs that align delivery slots with berth expansion projects secure multi-year replacement contracts at the highest volume sites in the market.
Moreover, warehouse and distribution center operators use electric yard trucks for trailer spotting between dock doors and holding lots across around-the-clock e-commerce fulfillment shifts. One DTI electric yard truck eliminated approximately 45,000 gallons of diesel and avoided more than 500 tons of CO₂ over its operational life per Orange EV case data from January 2026. Short-loop duty cycles with fence-line chargers allow full electrification without grid upgrades at distribution sites.
Major Challenges
Grid interconnection queues at ports and distribution yards stretch transformer upgrades to 18 to 24 months in dense clusters per Department of Energy grid assessments. Yards aiming to convert more than 30% of fleets hit charging bay capacity limits before the next planned replacement cycle. Peak-demand utility charges can add 10% to 15% to annual electricity cost, slowing multi-unit electric rollouts even where operators have already committed to conversion roadmaps.
However, a shortage of skilled EV drivetrain technicians in North America and Europe limits the speed at which fleets can commission and maintain electric terminal tractors at scale. OEMs, utilities, and terminal operators must co-invest in microgrid design and battery buffering to phase fleet conversions across a 3 to 5 year window. Suppliers that sell charging system design alongside tractors open a services revenue stream while competitors wait on utility interconnection queues.
Business Opportunities
Autonomous terminal tractor pilots remain confined to controlled low-speed trials under limited regulatory sandboxes, leaving large-scale multi-terminal commercial deployment as unexecuted white space. Full autonomy can unlock approximately 20% to 25% lower labor cost per move in yards where driver scarcity already pressures operations. OEM margin from autonomy software licenses can run 8 to 12 percentage points above hardware-only sales, creating a structurally higher-margin revenue layer.
Additionally, terminal tractor-as-a-service financing models reduce upfront capital barriers for smaller ports and capital-constrained distribution yards that cannot commit to bulk electric purchases. Retrofit and battery-swap conversion kits extend electrification to existing diesel fleets without full chassis replacement, adding a second addressable market alongside new unit sales. Early movers who certify platforms and build operator training programs lock preferred-vendor status before baseline volume growth catches up with regulatory timelines.
Regional Analysis
North America dominates the Terminal Tractor Market with a 51.00% share valued at USD 1.11 Billion in 2025. Dense container gateways, inland distribution hubs, and California-style clean fleet mandates concentrate both volume and conversion urgency in this region. Suppliers with local service networks defend share against import price swings driven by U.S. Section 232 steel and aluminum tariffs, which rose to 50% for many origins in 2025.
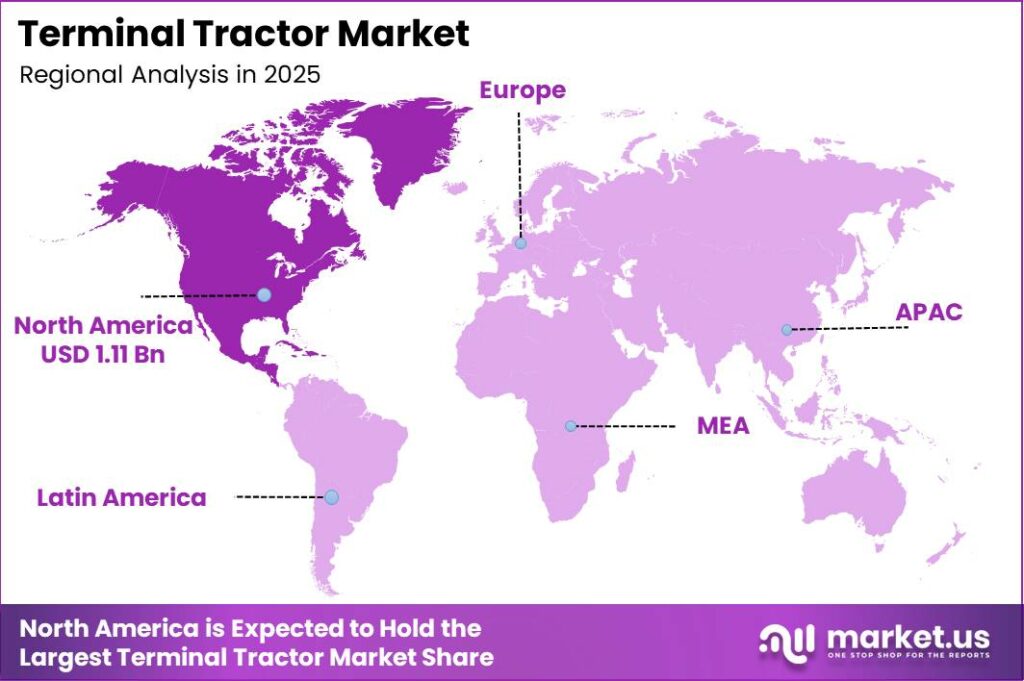
Consequently, Europe ranks among the fastest-moving regions for port emissions zoning and autonomous yard vehicle pilots. Westwell’s contract for 100 battery-electric autonomous Q-Trucks at the Port of Felixstowe, announced at TOC Europe in June 2026, demonstrates European terminals converting pilots into committed multi-unit buys. Asia Pacific, Latin America, and the Middle East and Africa add steady volume through port modernization programs and new logistics park development funded by infrastructure investment cycles.
Recent Developments
- March 2025 — Volvo Group expanded its electromobility solutions for heavy-duty applications, advancing electric driveline and charging technologies applicable to terminal and yard vehicle operations.
- April 2025 — Toyota Industries Corporation continued expansion of its industrial vehicle electrification portfolio, adding battery-electric solutions for logistics and material-handling applications that support terminal operations.
- June 2025 — Capacity Trucks continued development and deployment of electric terminal tractors, including the ZE electric terminal truck platform engineered for heavy-duty yard operations.
- October 2025 — Orange EV reported its electric terminal-truck fleet surpassed 10 million cumulative operating hours across more than 340 fleets, with average uptime exceeding 98%.
- June 2026 — Westwell reported 100 battery-electric autonomous Q-Trucks contracted for the Port of Felixstowe at TOC Europe, marking a commercial-scale autonomous yard vehicle deployment milestone.
Conclusion
The Terminal Tractor Market maintains a steady growth trajectory driven by rising global container throughput, accelerating fleet electrification mandates, and e-commerce distribution activity that keeps yard equipment in continuous high-cycle use. A CAGR of 5.10% through 2035 reflects durable structural demand from port modernization, replacement of aging diesel fleets, and emerging autonomous yard vehicle deployment programs across North America and Europe.
Diesel propulsion retains a 72.00% share while electric adoption climbs on the back of proven operational data and tightening emissions rules. North America’s 51.00% regional dominance reflects dense yard fleets and the most active regulatory environment for zero-emission equipment. Marine ports and container terminals anchor application demand at 38.00%, amplified by UNCTAD’s recorded 920 million TEU throughput in 2024.
Companies that bundle charging infrastructure with electric units, invest in autonomy-ready platforms, and develop service-based revenue models will capture the broadest share of a market growing to USD 3.60 Billion by 2035. Speed to emissions compliance certification and depth of fleet financing capabilities will separate market leaders from hardware-only competitors across the forecast window.
Looking for data tailored to your specific market, region, or business need? Request a custom report or consultation — write to us at [email protected]




















