


Report Overview
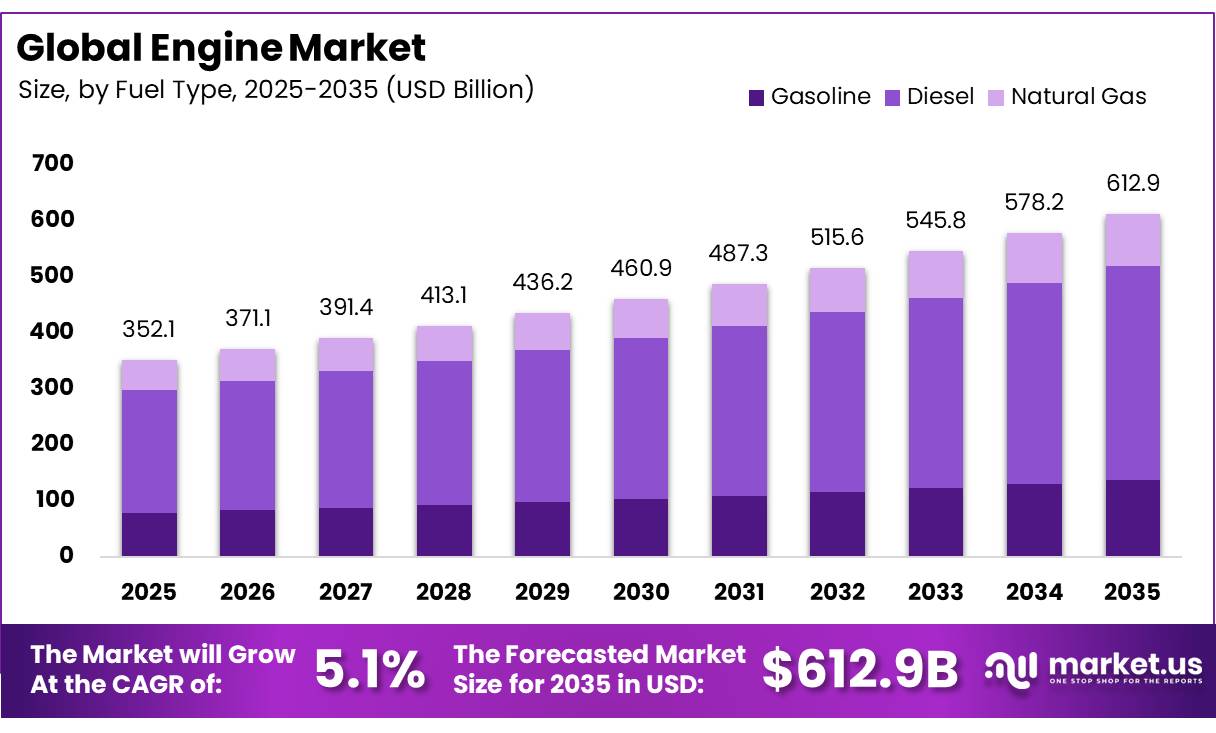
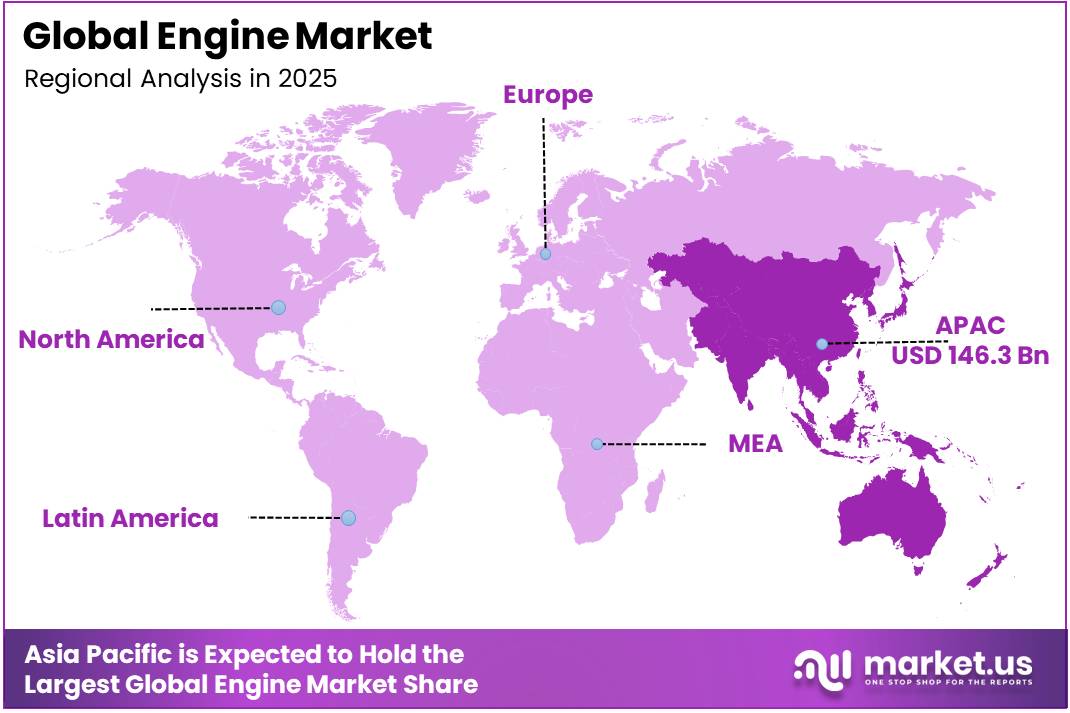
In 2025, the Global Engine Market was valued at USD 352.1 billion, and between 2026 and 2035, this market is estimated to register a CAGR of 5.1%, reaching about USD 612.9 billion by 2035. Asia Pacific held a dominant market position, capturing more than a 41.6% share, holding USD 146.3 billion in revenue.
The engine market covers gasoline, diesel, and natural gas power systems used across automotive, marine, locomotive, mining, oil and gas, and electricity generation applications. Manufacturers compete through fuel efficiency, durability, power density, emissions control, and digital diagnostics across high, medium, and low speed platforms.
- In April 2026, according to the International Organization of Motor Vehicle Manufacturers, vehicle production increased from 7 million units in 2024 to 96.4 million units in 2025, supporting demand for engines, components, servicing, and replacement parts.
Key Takeaways
- The global engine market was valued at USD 352.1 billion in 2025.
- The global engine market is projected to grow at a CAGR of 5.1% and is estimated to reach USD 612.9 billion by 2035.
- On the basis of fuel type, the diesel segment dominated the market, constituting 62.34% of the total market share.
- Based on the speed type, high-speed engines dominated the engine market, with a substantial market share of around 43.22%.
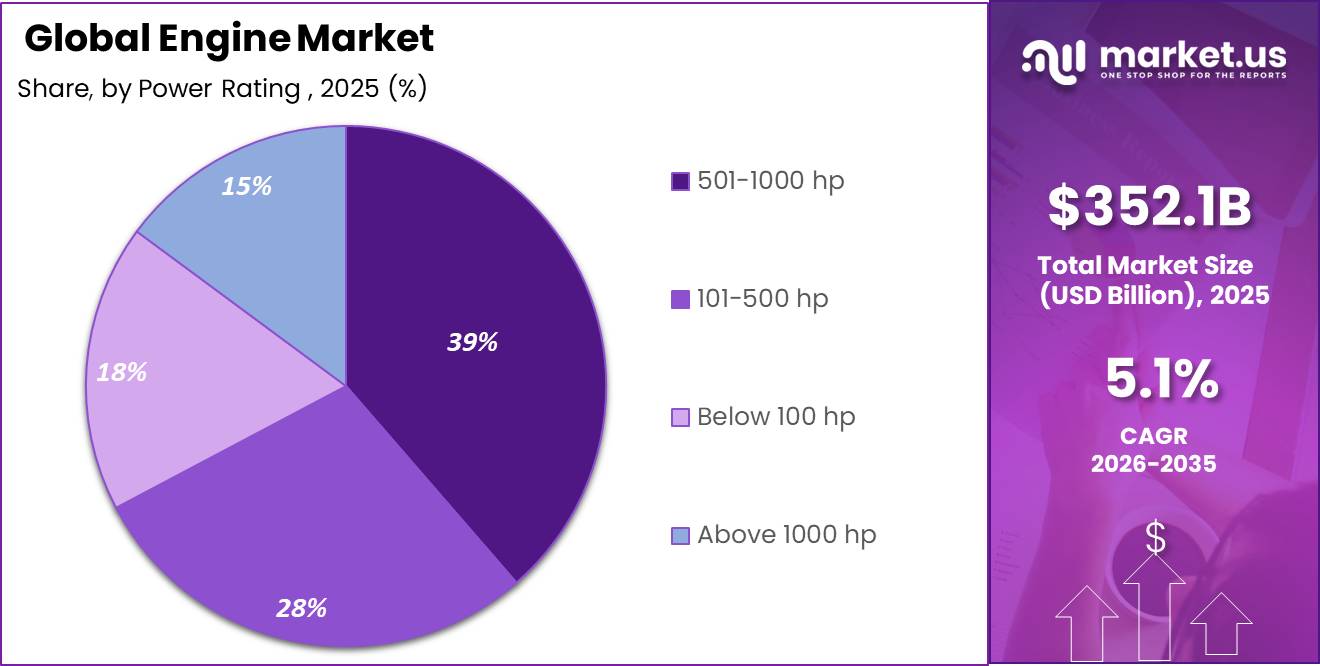
- Based on the power rating, the 501–1000 hp segment led the market, comprising 38.56% of the total market share.
- Among the end user industries, the automotive segment held a major share in the engine market, accounting for 41.23% of the market share.
- In 2025, Asia Pacific was the most dominant region in the engine market, accounting for 41.56% of the total global market share.
The industrial scenario remains broad because engines serve mobility and stationary power requirements.
- In 2025, according to the United States Energy Information Administration, utility-scale electricity generation reached about 43 trillion kilowatthours, while natural gas supplied 41% of output.
Natural gas is used in gas turbines, while diesel fuels internal-combustion generator sets, creating opportunities for manufacturers serving utilities, industrial sites, commercial facilities, backup power installations, and remote operations requiring dependable and quickly dispatchable electricity.
Growth is tied to cleaner combustion, alternative fuels, electronic controls, predictive maintenance, and hybrid integration. In April 2025, according to the International Maritime Organization, its Net-Zero Framework covered ocean-going ships above 5,000 gross tonnage, representing 85% of international shipping carbon dioxide emissions. The framework combines a marine fuel standard with emissions pricing, encouraging engine producers to develop dual-fuel systems, improve fuel flexibility, reduce consumption, and support methanol, ammonia, biofuel, and liquefied natural gas pathways.
Government regulation is reshaping product development. In March 2026, according to the Council of the European Union, heavy-duty vehicle rules require carbon dioxide reductions of 15% from 2025, 43% from 2030, and 90% by 2040. Although trucks, buses, and coaches represent about 2% of vehicles on European Union roads, they generate more than 25% of road transport greenhouse gas emissions. These targets support investment in advanced engines, aftertreatment, electrification, lightweighting, and efficiency-focused manufacturing.
Fuel Type Analysis
Diesel dominates with 62.34% because dependable torque and durability support demanding applications.
In 2025, Diesel held a dominant market position, capturing more than a 62.34% share. Its leadership was supported by extensive use across commercial vehicles, marine vessels, locomotives, mining equipment, oil and gas operations, and backup power systems. Operators continue to value diesel engines for strong load handling, long operating life, fuel availability, and reliable performance under intensive working conditions. Established maintenance networks, mature component supply chains, and suitability for high-power duties also help diesel remain the preferred fuel type across heavy industrial and transport applications.
- For instance, in May 2026, according to Volvo Trucks, the company introduced a new engine platform that included a diesel powertrain designed to improve efficiency and meet upcoming emissions requirements.
Gasoline is expected to be a growing segment. Its expansion is supported by continued demand from passenger vehicles, light commercial equipment, portable machinery, and smaller power systems. Manufacturers are refining combustion control, thermal management, and engine electronics to improve drivability, reduce fuel consumption, and support reliable performance across everyday mobility and light-duty applications.
Speed Type Analysis
High Speed dominates with 43.22% because compact design and rapid operation support broad equipment use.
In 2025, High Speed held a dominant market position, capturing more than a 43.22% share. Its leadership was supported by widespread use in automotive vehicles, portable generators, construction machinery, agricultural equipment, and smaller marine systems. These engines provide responsive acceleration, favourable power output relative to size, and easier installation where space and weight are limited. Established production methods, broad component availability, and familiar servicing requirements also help manufacturers supply high-speed platforms across consumer, commercial, and light industrial applications worldwide.
- For instance, in April 2026, according to Wärtsilä Corporation, the company released an increased-power version of its Wärtsilä 25 Ammonia engine, a medium-speed marine platform designed for efficient vessel operation.
Medium Speed is expected to be a growing segment. Its expansion is supported by marine propulsion, stationary generation, and industrial applications requiring a balance between operating efficiency, durability, and load response. Manufacturers are improving fuel flexibility, combustion control, maintenance intervals, and digital monitoring to strengthen performance in vessels, power plants, and heavy-duty installations more reliably worldwide.
Power Rating Analysis
501 to 1000 horsepower dominates with 38.56% because balanced output supports demanding industrial and transport operations.
In 2025, 501-1000 hp held a dominant market position, capturing more than a 38.56% share. Its leadership was supported by use in heavy commercial vehicles, marine equipment, mining machinery, oil and gas operations, and stationary power systems. Engines within this range provide output for intensive workloads while remaining easier to install and maintain than larger platforms. Their ability to handle continuous duty, variable loads, and harsh operating conditions makes them suitable for fleets and industrial users seeking dependable performance without excessive equipment size.
- For instance, in March 2025, according to Cummins Inc., the company unveiled its B7.2 diesel engine for medium-duty applications, strengthening its offering for customers requiring efficient and durable power solutions.
The 101-500 hp segment is expected to grow steadily. Demand is supported by light commercial vehicles, construction equipment, agricultural machinery, smaller vessels, and distributed power applications. Manufacturers are improving electronic controls, fuel economy, compactness, and serviceability to make these engines more attractive for operators requiring flexible power across varied working environments.
End User Analysis
Automotive dominates with 41.2% because high production volumes sustain engine demand.
In 2025, Automotive held a dominant market position, capturing more than a 41.2% share. Its leadership was supported by extensive engine use across passenger cars, commercial vehicles, and hybrid powertrains. Manufacturers benefit from established assembly plants, mature component networks, standardized servicing, and replacement demand. Continued improvements in fuel injection, turbocharging, thermal management, and electronic controls also help automotive engines meet changing efficiency and drivability requirements. Broad vehicle ownership and model upgrades keep this end-user industry central to engine production.
- For instance, in January 2026, according to Nissan Motor Co., Ltd., the company unveiled the Aura NISMO RS Concept with a 1.5-litre power-generation engine as part of its electrified performance system.
Marines is expected to be a growing segment. Expansion is supported by fleet renewal, offshore activity, cargo transport, and demand for engines capable of operating with conventional and alternative fuels. Shipowners increasingly favour propulsion systems offering lower fuel consumption, dependable long-duration operation, easier maintenance, and compatibility with future emissions requirements across commercial vessels, specialised ships, and maritime support fleets.
Key Market Segments
Fuel Type
- Gasoline
- Diesel
- Natural Gas
Speed Type
- High Speed
- Medium Speed
- Low Speed
Power Rating
- Below 100 hp
- 101-500 hp
- 501-1000 hp
- Above 1000 hp
End User Industry
- Automotive
- Marines
- Locomotives
- Mining
- Oil & Gas
- Power Generation
- Others
Driver Analysis
AI-Driven Data Center Backup Power Demand
The hyperscale AI buildout has turned diesel and gas reciprocating engines into critical infrastructure components rather than peripheral backup assets, fundamentally reordering engine OEM order books toward the data center vertical. U.S. data center diesel generator capacity nearly tripled from an estimated 20 GW in 2018 to roughly 55 GW in 2024, with Virginia alone permitting over 10,500 generator units totaling 27 GW of capacity by end-2025. Because operators typically overbuild generator capacity to 120-200% of peak campus load to guarantee 99.995% uptime SLAs, a single 100 MW data center campus can trigger orders for 120-200 MW of installed engine capacity, creating a multiplier effect on unit economics far beyond the underlying power draw.
This dynamic was directly visible in engine manufacturer earnings: Cummins reported record Q2 2026 revenue of 9.5 billion dollars, up roughly 9% year-over-year, explicitly citing data center demand as a raised full-year guidance driver. Strategically, this shifts engine OEM go-to-market from cyclical, price-competitive industrial channels toward long-lead, negotiated hyperscaler supply agreements with multi-year backlog visibility, pushing average selling prices and gross margins higher while straining large-bore engine and generator-set production capacity, with reported unit price points around 370,000 dollars per backup unit and gross margins near 31% in adjacent generator segments.
Drivers Impact Analysis
| Driver | (~) % Impact on CAGR | Geographic Relevance | Impact Timeline |
|---|---|---|---|
| AI-driven data center backup power demand pulling engine order books into industrial gensets | +1.6% | North America core (Virginia, Oregon, Texas), EU (Ireland, Germany), APAC (Singapore, India) | Short term (≤ 2 years) |
| IMO Tier III / North-East Atlantic ECA expansion forcing marine engine retrofits and NOx-compliant newbuilds | +1.1% | EU/North Atlantic corridors, North America (Canadian Arctic), APAC shipbuilding hubs (China, South Korea, Japan) | Medium term (2-4 years) |
| Hydrogen internal combustion engine (H2-ICE) commercialization as a fuel-cell alternative | +0.9% | EU (Germany, UK), Japan, South Korea, North America pilot corridors | Long term (≥ 4 years) |
| EPA/CARB Tier 4 and Stage V off-road emission enforcement accelerating aftertreatment retrofits | +0.7% | North America core, EU, spill-over into South America mining fleets | Short term (≤ 2 years) |
| Asia-Pacific infrastructure and construction mechanization expanding industrial engine base demand | +1.4% | APAC core (China, India, Southeast Asia), spill-over into Middle East construction | Medium term (2-4 years) |
| Electrification and hybridization substitution risk compressing traditional ICE unit volumes | -0.8% | North America, EU core; APAC lagging substitution | Long term (≥ 4 years) |
Restraint Analysis
Emission Compliance Capex and OPEX Burden
Regulatory tightening across engine classes is a structural restraint because incremental compliance capex and OPEX directly compress margins and slow fleet replacement cycles, particularly where Tier 4, Stage V, and emerging IMO greenhouse-gas measures mandate aftertreatment and monitoring systems that did not exist in legacy designs; EPA Tier 4 off‑road standards reduced PM and NOx emissions by roughly 90–99% compared with 1990s baselines, but required widespread adoption of SCR and DPF hardware, urea dosing systems, and higher‑precision electronic controls, pushing per‑unit production costs for compliant engines 15–25% above legacy equivalents for mid‑to‑high horsepower ranges and forcing users to carry ongoing DEF and filter maintenance costs into OPEX budgets.
On the marine side, IMO Annex VI ECAs and draft net‑zero proposals introduce NOx Tier III and sulphur limits of 0.10% m/m in ECAs plus prospective greenhouse‑gas intensity charges, with scenario analyses for shipping fuel transitions indicating that compliant fuels or abatement technologies could add tens of dollars per tonne of marine fuel or hundreds of dollars per tonne of CO2e under proposed RU structures, effectively raising operating costs per kWh of shaft power and eroding the economic headroom for investing in new engines versus sweating older assets.
For industrial engine OEMs, increasing regulatory pressure on emissions and compliance translates into elevated R&D intensity, more complex testing and certification workflows, and a need for region‑specific variants, impairing manufacturing scale benefits and depressing EBIT margins by several hundred basis points compared with a lighter‑regulation baseline, while end‑users in construction, mining, and agriculture defer capex or opt for refurbished Tier 3 units where enforcement is weaker, reducing near‑term unit volumes despite underlying demand for reliable power and mechanization.
Restraint Impact Analysis
| Restraint | (~) % Impact on CAGR Forecast | Geographic Relevance | Impact Timeline |
|---|---|---|---|
| Emission compliance capex and OPEX burden | -1.5% | North America core, EU, selective APAC | Medium term (2-4 years) |
| Powertrain supply chain disruptions and input inflation | -1.2% | Global (NA, EU, APAC corridors) | Short term (≤ 2 years) |
| High upfront cost of advanced engines for SMEs | -1.0% | Emerging markets (APAC, LatAm), price-sensitive EU segments | Medium term (2-4 years) |
| Electrification transition cannibalizing ICE volumes | -1.8% | North America, EU, China | Long term (≥ 4 years) |
| Geopolitical tariffs and trade barriers on components | -0.9% | NA–China, EU–China, APAC export routes | Medium term (2-4 years) |
| Skilled labor and maintenance capability constraints | -0.7% | Global, stronger in APAC/LatAm corridors | Long term (≥ 4 years) |
Opportunity Analysis
Outcome-Based Engine Service Monetization
This opportunity is distinct from current drivers because most engine OEMs still monetize services on a traditional break-fix and scheduled-maintenance basis, leaving a large pool of uncaptured value from uptime guarantees, fuel-efficiency optimization, and performance-based contracts that are already common in turbines and some industrial machinery but not yet mainstream in the broader engine market.
For engine manufacturers with millions of units in the field, even converting 15–20% of the installed base to outcome-based contracts with incremental service revenue of, say, 5–10% of initial engine ASP per year can flip services from 15–20% of revenue to 25–30%, lifting consolidated EBIT margins by several hundred basis points and supporting a 1–2 percentage point CAGR uplift versus hardware-only trajectory.
The opportunity window is near term because telematics penetration, edge connectivity, and vertical AI analytics for predictive maintenance are already available, but most OEMs have not fully packaged them into formal, value-based service products; early movers in North America and Europe can lock in long-term contracts with large fleets in construction, mining, and power generation before competitors converge on similar models, structurally rebalancing their P&L toward high-margin recurring revenue and reducing sensitivity to cyclical new-engine sales.
Opportunity Impact Analysis
| Opportunity | (~) % Potential CAGR | Geographic Relevance | Execution Window |
|---|---|---|---|
| Outcome-based engine service monetization (uptime, efficiency) | +1.4% | North America core, EU industrial, APAC tier-1 | Short term (≤ 2 years) |
| Integrated energy infrastructure (VPP, data center power, H2 hubs) | +1.6% | NA/EU data center clusters, APAC metros | Medium term (2-4 years) |
| Hybrid and multi-fuel engine platforms for transition fuels | +1.2% | EU, North America, APAC industrial corridors | Medium term (2-4 years) |
| Vertical integration into critical components and software stacks | +1.0% | Global OEM hubs (NA, EU, China) | Long term (≥ 4 years) |
| Engine-powered robotics and physical automation adjacency | +0.9% | APAC manufacturing, EU/NA logistics | Long term (≥ 4 years) |
| M&A roll-up of fragmented regional service and rental fleets | +1.1% | APAC, LatAm, Middle East industrial clusters | Medium term (2-4 years) |
Challenges Analysis
Volatile Multi-Node Supply Chains
Engines sit at the intersection of forged and machined metals, precision castings, electronics, and aftertreatment modules; each of these layers can be hit by port congestion at nodes like Chennai, Mundra, or European gateways, with reports noting that regional freight volatility now affects even short supply lines via local congestion, labor issues, and regulatory changes, often adding 5–15 days to transit times compared with pre‑2020 baselines.
Freightfox and BSI commentary indicates that geopolitical conflict in the Red Sea and Eastern Europe, monsoon and cyclone-related climate events, and regulatory transitions such as GST 2.0 can trigger capacity shortages, shipping delays, and rerouting, increasing landed cost volatility and forcing continuous re-optimization of sourcing footprints.
For engine OEMs, this friction manifests quantitatively as longer order-to-delivery cycles, higher safety stock thresholds, and increased exposure to spot freight rate spikes with standard deviations in logistics cost widening significantly, all of which compress margins by 100–200 basis points and cap how fast revenue can scale even when orders are strong.
Challenges Impact Analysis
| Challenge | (~) % CAGR Friction | Geographic Relevance | Mitigation Horizon |
|---|---|---|---|
| Volatile multi-node supply chains | -1.3% | NA core, EU hubs, APAC logistics corridors | Medium term (2-4 years) |
| Chronic skilled maintenance talent gap | -1.1% | NA/EU industrial belts, India, China | Long term (≥ 4 years) |
| Technology complexity and software-defined powertrains | -0.9% | Global OEM centers, EU regulatory hubs | Long term (≥ 4 years) |
| Geopolitical trade and critical material risk | -1.0% | NA–EU–APAC trade lanes | Medium term (2-4 years) |
| Cyber, data integrity, and OT/IT security exposure | -0.7% | Global, higher in digitized fleets | Long term (≥ 4 years) |
| Demand-cycle and affordability volatility in end-use sectors | -0.8% | Global automotive, construction, and industrial demand centers | Medium term (2-4 years) |
Geopolitical Impact Analysis
Tariffs, Export Controls, and Supply-Route Disruptions Reshaping Global Engine Manufacturing.
Geopolitical tensions are reshaping the engine market through tariffs, localization policies, and changing automotive trade relationships. In October 2025, the United States imposed a 25% tariff on imported medium and heavy-duty trucks and key parts, including engines, transmissions, tyres, and chassis. A 10% tariff was also applied to imported buses, encouraging manufacturers to increase domestic assembly and reconsider international sourcing strategies.
- In April 2025, China introduced export controls covering 7 of the 17 rare-earth elements and permanent magnets used across automotive, energy, and defence applications. These materials support engine sensors, electronic controls, generators, actuators, and hybrid power systems. Licensing requirements can extend procurement timelines and encourage manufacturers to qualify alternative suppliers or redesign components.
Sanctions and technology controls are also limiting access to selected engine products. United States export regulations covering Russia and Belarus include restrictions affecting piston diesel and semi-diesel engines used for vehicle propulsion. Such measures can reduce equipment availability, complicate aftermarket servicing, and redirect engine exports toward markets with fewer trade restrictions.
Shipping instability further affects engines, castings, turbochargers, fuel systems, and replacement components. In September 2025, United Nations Trade and Development reported that maritime trade growth was expected to slow to 0.5%, while vessel rerouting increased ton-miles by 6% during 2024. These pressures are encouraging regional production, safety stocks, supplier diversification, and localized component manufacturing, although higher freight costs and longer delivery times remain major operational risks.
Regional Analysis
Asia-Pacific Maintains Leadership Through Strong Manufacturing Base
Asia-Pacific dominated the global engine market, accounting for approximately 41.6% of total market revenue, valued at USD 146.33 billion. The region’s leadership is supported by its extensive automotive, agricultural machinery, construction equipment, marine, and industrial manufacturing sectors. Countries such as China, India, Japan, and South Korea continue to serve as major production hubs for engines and engine-powered equipment, benefiting from large domestic demand as well as export-oriented manufacturing activities.
- According to the International Organization of Motor Vehicle Manufacturers, China produced more than 31 million motor vehicles in 2024, representing a significant share of global vehicle production. India also plays a crucial role in the regional market, supported by strong demand for passenger vehicles, commercial vehicles, tractors, and construction machinery. Data from the Society of Indian Automobile Manufacturers indicates that India’s automobile production exceeded 28 million units during FY 2024-25, highlighting the country’s growing manufacturing capacity.
The region further benefits from government initiatives aimed at strengthening industrial output and advanced manufacturing capabilities. Programs such as India’s Production Linked Incentive (PLI) Scheme for the automobile sector, China’s industrial modernization policies, and Japan’s support for next-generation mobility technologies continue to encourage investment across the engine value chain. Additionally, rising infrastructure development projects, increasing mechanization in agriculture, and expanding logistics networks are generating sustained demand for engines across multiple end-use industries.
Key Regions and Countries Covered
- North America
- The US
- Canada
- Europe
- Germany
- France
- The UK
- Spain
- Italy
- Russia & CIS
- Rest of Europe
- APAC
- China
- Japan
- South Korea
- India
- ASEAN
- Rest of APAC
- Latin America
- Brazil
- Mexico
- Rest of Latin America
- Middle East & Africa
- GCC
- South Africa
- Rest of MEA
Key Players Analysis
The global engine market has a competitive structure shaped by established manufacturers offering gasoline, diesel, and natural gas engines across automotive, marine, locomotive, mining, oil and gas, and power-generation applications. Major players such as Cummins Inc., Caterpillar Inc., AB Volvo, Rolls-Royce plc, Honda Motor Co., Ltd., Mitsubishi Heavy Industries, Ltd., and Wärtsilä compete through engine efficiency, durability, power density, emissions performance, and fuel flexibility. Strong manufacturing capabilities, established distribution channels, and extensive servicing networks provide leading companies with an advantage across regional and international markets.
Companies are strengthening their market position by developing advanced combustion systems, electronic engine controls, turbocharging technologies, digital monitoring tools, and alternative-fuel platforms. Cummins Inc. and Caterpillar Inc. maintain broad portfolios across industrial and power-generation applications, while AB Volvo, Scania CV AB, Honda Motor Co., Ltd., and Nissan Motor Co., Ltd. focus strongly on transportation engines. Rolls-Royce plc, Mitsubishi Heavy Industries, Ltd., and Wärtsilä compete across marine and large-scale power systems, while Safran, General Electric Company, and Honeywell International, Inc. maintain strong positions in aerospace propulsion technologies.
Competitive strategies include new product development, manufacturing expansion, strategic partnerships, long-term service agreements, and investment in lower-emission engines. Companies are also improving fuel economy, predictive maintenance, hybrid compatibility, and support for alternative fuels to address evolving regulatory and customer requirements.
Market Key Players
- Cummins Inc.
- Caterpiller
- AB Volvo
- Rolls-Royce plc
- Scania CV AB
- Safran
- Honda Motor Co., Ltd
- General Electric Company
- Honeywell International, Inc.
- Nissan Motor Co., Ltd.
- Mitsubishi Heavy Industries, Ltd
- Wartsila
- Other Key Players
Key Development
- In June 2026, Cummins Inc. signed an agreement with Circe Energy to supply HSK78 and QSK60 natural gas generator sets for a large artificial intelligence data centre campus in West Texas, with deliveries scheduled between 2026 and 2030.
- In May 2026, AB Volvo introduced its next-generation D13 engine, delivering up to 540 horsepower and reducing nitrogen oxide emissions by more than 80% compared with current standards.
- In May 2026, Wärtsilä signed two equipment supply contracts with Origem Energia for 36 Wärtsilä 34SG gas engines supporting 371 megawatts of balancing power projects in Brazil.
Report Scope
| Report Features | Description |
|---|---|
| Market Value (2025) | USD 352.1 Bn |
| Forecast Revenue (2035) | USD 612.9 Bn |
| CAGR (2026-2035) | 5.1% |
| Base Year for Estimation | 2025 |
| Historic Period | 2020-2024 |
| Forecast Period | 2026-2035 |
| Report Coverage | Revenue Forecast, Market Dynamics, Competitive Landscape, Recent Developments |
| Segments Covered | By Fuel Type (Gasoline, Diesel, and Natural Gas), By Speed Type (High Speed, Medium Speed, and Low Speed), By Power Rating (Below 100 hp, 101–500 hp, 501–1000 hp, and Above 1000 hp), By End User Industry (Automotive, Marines, Locomotives, Mining, Oil & Gas, Power Generation, and Others) |
| Regional Analysis | North America – The US & Canada; Europe – Germany, France, The UK, Spain, Italy, Russia & CIS, Rest of Europe; APAC– China, Japan, South Korea, India, ASEAN & Rest of APAC; Latin America– Brazil, Mexico & Rest of Latin America; Middle East & Africa– GCC, South Africa, & Rest of MEA |
| Competitive Landscape | Cummins Inc., Caterpillar, AB Volvo, Rolls-Royce plc, Scania CV AB, Safran, Honda Motor Co., Ltd, General Electric Company, Honeywell International, Inc., Nissan Motor Co., Ltd., Mitsubishi Heavy Industries, Ltd, Wartsila and Other Key Players. |
| Customization Scope | Customization for segments, region/country-level will be provided. Moreover, additional customization can be done based on the requirements. |
| Purchase Options | We have three licenses to opt for: Single User License, Multi-User License (Up to 5 Users), Corporate Use License (Unlimited Users and Printable PDF) |





































