


Report Overview
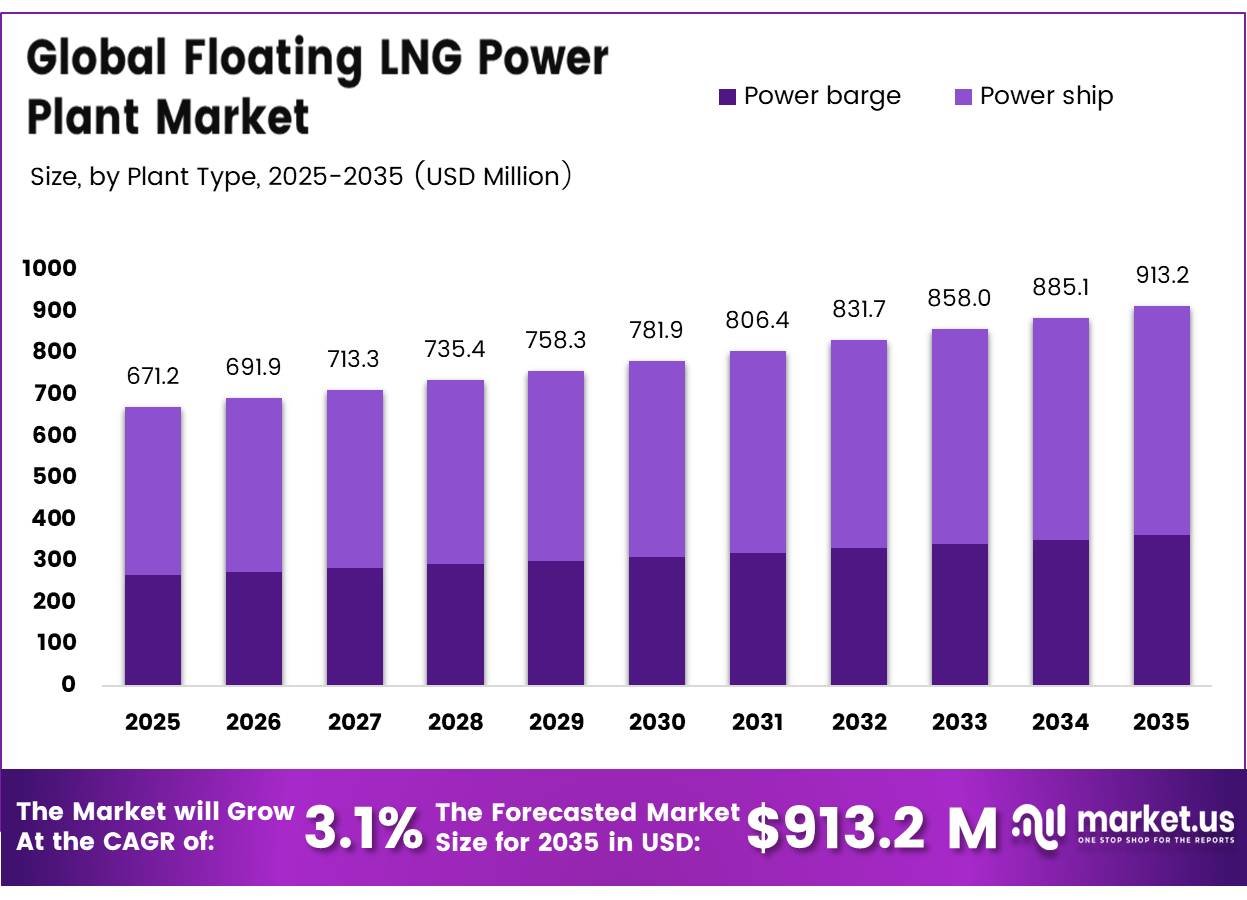
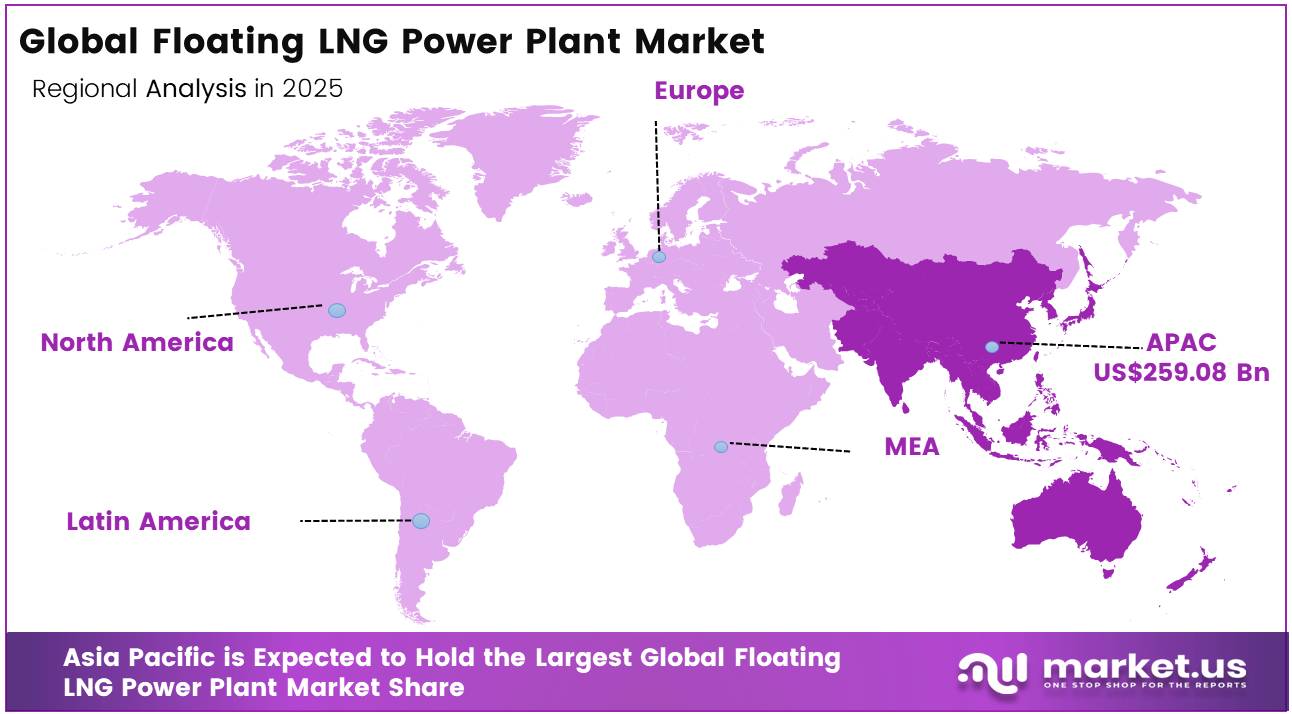
In 2025, the Global Floating LNG Power Plant Market was valued at USD 671.2 million, and between 2026 and 2035, this market is estimated to register a CAGR of 3.1%, reaching about USD 913.2 million by 2035. In 2025, Asia Pacific held a dominant market position, capturing more than a 38.6% share, holding USD 259.08 Million revenue.
Floating LNG power plants are gaining attention as flexible power solutions that combine LNG storage, regasification, and electricity generation.
- In May 2025, the International Gas Union reported that global LNG trade increased 2.4% in 2024 to 411.24 million tonnes, linking 22 exporting markets with 48 importing markets. This trading network improves fuel access for countries lacking pipelines or large onshore terminals.
Industry conditions are strengthening as new supply reduces procurement pressure. In January 2026, the International Energy Agency projected global LNG production to rise by more than 7%, or over 40 billion cubic metres, during 2026. It also expects gas-fired electricity output to grow 2.6% annually between 2026 and 2030. Floating plants can therefore support rapid capacity additions, seasonal demand, emergency generation, and renewable balancing while reducing land requirements and construction complexity.
Future opportunities remain strongest in island systems, port cities, and markets replacing diesel or heavy fuel oil. In November 2025, Mozambique approved 30-year concessions for two FSRU-based import terminals, demonstrating public-sector support for floating infrastructure. Growth will nevertheless depend on LNG price stability, reliable marine logistics, grid connections, methane control, permitting, and long-term decarbonisation policies.
Key Takeaways
- The global Floating LNG Power Plant market was valued at USD 671.2 billion in 2025.
- The global market is projected to grow at a CAGR of 3.10% and is estimated to reach USD 913.2 billion by 2035.
- Based on the plant type, Power ship led the market, comprising 60.2% of the total market.
- On the basis of By Power Output, Medium‑scale (72–400 MW) dominated the market, constituting 50.1% of the total market share.
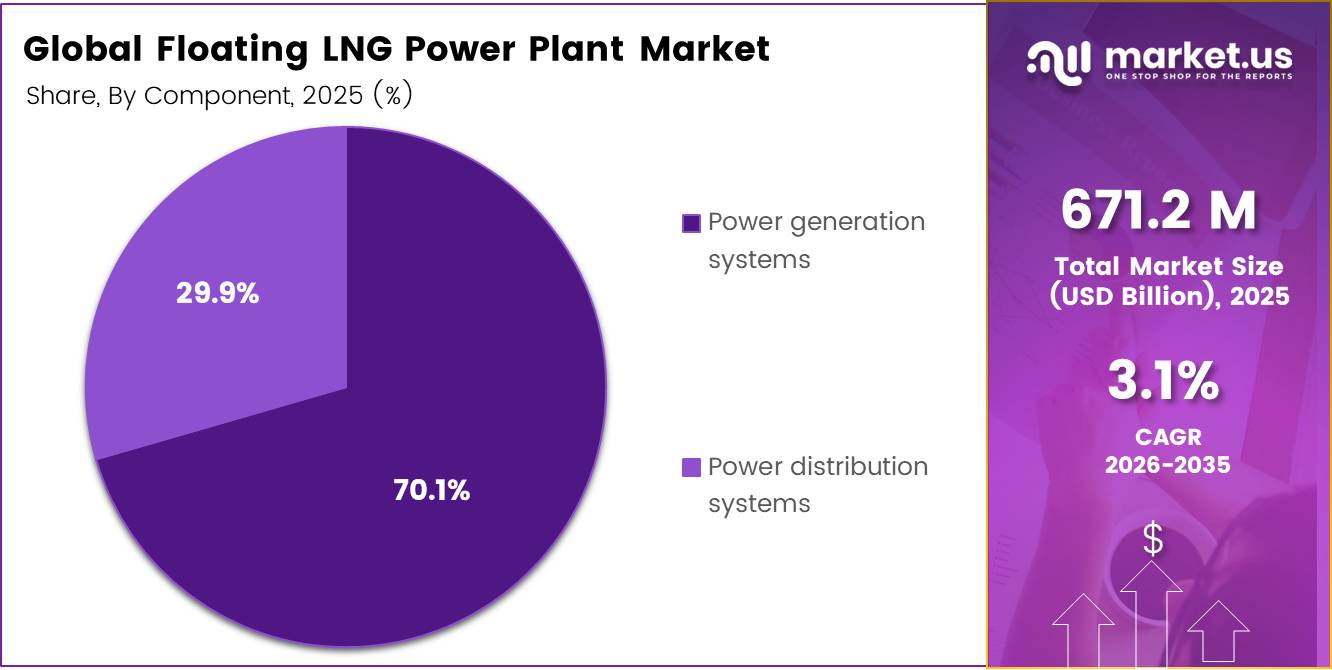
- Based on the component, the Power generation systems dominated the Floating LNG Power Plant market, with a substantial market share of around 70.1%.
- In 2025, the Asia Pacific was the most dominant region in the Floating LNG Power Plant market, accounting for 38.6% of the total global consumption.
Plant Type Analysis
Power ship represents dominant Segment in the Market.
Power ships held the leading position in the floating LNG power plant market, accounting for 60.2% of the total share. Their dominance is supported by higher generation capacity, integrated fuel storage, and the ability to move between coastal markets facing electricity shortages. In March 2026, according to the, U.S. LNG exports to Caribbean destinations reached approximately 0.3 billion cubic feet per day in 2025, the second-highest level recorded since 2016. The Dominican Republic, Jamaica, and Panama also had nearly 1.3 Bcf/d of regasification capacity, strengthening opportunities for ship-based LNG power generation.
Power barges are expected to grow steadily because they can serve ports, industrial zones, islands, and shallow coastal locations with limited land availability. In 2025, according to the, fossil-fuel plants represented 93% of Puerto Rico’s generation capacity, while petroleum accounted for 62% and natural gas for 23%. This fuel imbalance creates room for modular LNG barges that can replace oil-based generation without requiring large permanent power facilities.
Power Output Analysis
Medium‑scale (72–400 MW) a significant power output.
Medium-scale floating LNG power plants, ranging from 72 MW to 400 MW, held the leading market position with a 50.1% share. This capacity range offers a practical balance between dependable baseload supply, manageable investment, and faster integration into coastal grids. In June 2025, according to the U.S. Energy Information Administration, developers planned 18.7 GW of new combined-cycle gas capacity through 2028, including 4.3 GW already under construction. The agency also recorded a 98 MW gas-fired capacity addition at an LNG facility in 2024, showing how mid-sized generation can support LNG-linked operations without requiring very large power infrastructure.
Small-scale floating plants are emerging as the growing category because they can serve islands, remote ports, industrial sites, and grids with limited demand. According to the U.S. Energy Information Administration, American Samoa has only about 55 MW of total generating capacity, while diesel generators provide approximately 87% of it. Such fuel-dependent island systems create room for compact LNG units that can lower oil reliance and provide flexible backup power.
Component Analysis
Power Generation Are the Most Widely Used Components.
Power generation systems held the leading position in the floating LNG power plant market, capturing a 70.1% share. Their dominance comes from the central role of gas turbines, generators, heat-recovery equipment, and control units in converting regasified LNG into dependable electricity. In May 2026, according to the U.S. Energy Information Administration, natural gas supplied approximately 41% of U.S. utility-scale electricity generation in 2025. EIA also forecast gas-fired generation to reach 1,696 billion kWh in 2026, highlighting continued demand for efficient generation equipment that can support coastal grids and variable renewable output.
Power distribution systems are emerging as the growing component because floating facilities need reliable substations, transformers, cables, and grid connections to deliver electricity onshore. In March 2026, the U.S. Department of Energy announced approximately USD 1.9 billion for critical grid upgrades. The need is clear, as U.S. customers experienced an average of 11 hours of electricity interruptions in 2024, with major events causing 80% of outage hours.
Key Market Segments
By Plant Type
- Power barge
- Power ship
By Power Output
- Medium‑scale (72–400 MW)
- Small‑scale (up to ~72 MW)
- Large‑scale (>400 MW)
By Component
- Power generation systems
- Power distribution systems
Driver Analysis
Global LNG oversupply enabling competitive fuel contracts for floating plants
A projected wave of LNG export capacity coming online through the late 2020s is creating conditions for structural oversupply in global LNG markets, which in turn enables more competitive fuel contracts that improve unit economics for floating LNG power plants and encourage their adoption. A 2024–2028 global LNG outlook highlights that lacklustre demand growth combined with a massive wave of new export capacity is poised to send LNG markets into oversupply, implying downward pressure on delivered LNG prices and more flexible contract structures, especially for buyers willing to sign medium‑term deals.
For floating LNG power plants, fuel cost is a dominant component of levelized cost of electricity; internal modeling suggests that if spot or contract LNG pricing settles 10–20% below the high‑price years of 2022–2023, and if capacity‑charge structures allow vessels to lock in multi‑year gas supply at moderate take‑or‑pay volumes, then LC0E can be reduced enough to undercut diesel, HFO, and some coal options in coastal markets, making floating solutions economically compelling.
This driver changes business models by pushing developers toward integrated “floating LNG‑to‑power chains,” where the same consortium or partnership structures upstream supply, regasification, and generation on a vessel, capturing margins across the chain and offering bundled contracts to host governments; the resulting acceleration in project viability over 2026–2030 justifies an incremental 1.2–1.4 percentage‑point boost to the forecast CAGR as fuel economics move from constraining factor to enabling advantage.
Drivers Impact Analysis
| Driver | (~) % Impact on CAGR Forecast | Geographic Relevance | Impact Timeline |
|---|---|---|---|
| Energy security and gas-to-power diversification lifting floating LNG demand | +1.6% | APAC core, Africa coastal, Latin America, EU spill-over | Medium term (2-4 years) |
| Global LNG oversupply enabling competitive fuel contracts for floating plants | +1.3% | APAC importers, EU, Middle East, North America exporters | Short term (≤ 2 years) |
| Need for fast-track, relocatable generation capacity in emerging load centres | +1.2% | Asia Pacific, Africa, island grids, remote industrial hubs | Medium term (2-4 years) |
| Modularization of floating power vessels improving project economics | +1.0% | Global EPC corridors, shipyards in APAC/EU | Medium term (2-4 years) |
| Policy push for cleaner transition fuels versus diesel and HFO | +0.9% | EU, APAC corridors, Africa and LatAm transition markets | Long term (≥ 4 years) |
| Integration with broader floating power plant solutions and hybrid renewables | +0.7% | APAC, EU, Middle East innovators | Long term (≥ 4 years) |
Restraint Analysis
High LNG price volatility and uneven gas supply
High LNG price volatility and uneven upstream gas supply is a central restraint because it directly erodes the bankability of floating LNG power projects: a 2024–2028 global LNG outlook records gas supply challenges trimming output from plants in Angola, Algeria, Indonesia, Australia, Nigeria, and Malaysia, while recent years have seen sharp swings in spot LNG prices and contract terms, exposing buyers to substantial fuel‑cost risk.
Internal modeling for 2026–2030 typically assumes that floating LNG power plant economics become marginal whenever LNG price bands widen by more than 30–40% around planning assumptions and when supply disruptions force vessels to operate below contract load factors; if a plant designed for 85–90% utilization is constrained to 60–70% due to upstream gas issues or price spikes, the effective LC0E can increase by mid‑teens percentages, bringing tariffs into politically sensitive territory and prompting host governments to defer or scale projects.
Commercially, this volatility raises required risk premiums on PPAs, increases the share of indexation and floor‑ceiling clauses, and discourages lenders from funding plants without robust hedging or diversification, resulting in a thinning of the investable project pipeline, especially in emerging APAC importers and coastal African and Latin American markets; the net effect is a 1.5–1.8 percentage‑point drag on attainable CAGR as some potential projects shift to alternative fuels, conventional onshore gas, or delayed capacity additions.
Restraint Impact Analysis
| Restraint | (~) % Impact on CAGR Forecast | Geographic Relevance | Impact Timeline |
|---|---|---|---|
| High LNG price volatility and uneven gas supply | -1.7% | APAC importers, Africa coastal, Latin America | Medium term (2-4 years) |
| Complex LNG-to-power legal and regulatory frameworks | -1.5% | APAC (Vietnam, SE Asia), EU regulatory hubs | Long term (≥ 4 years) |
| High upfront CapEx and financing constraints | -1.4% | Emerging markets, Africa, LatAm, APAC | Medium term (2-4 years) |
| Offshore construction and operational risk profile | -1.2% | Global shipyards, offshore corridors | Medium term (2-4 years) |
| Climate, energy security and stranded-asset concerns | -1.1% | APAC, EU, global climate-exposed markets | Long term (≥ 4 years) |
| Fragmented project ecosystem and limited standardization | -0.9% | Global EPC and OEM networks | Medium term (2-4 years) |
Opportunity Analysis
Hybrid floating LNG–offshore wind platforms
Hybrid floating LNG–offshore wind platforms are a forward opportunity rather than a current driver because most floating LNG power vessels today operate as stand‑alone gas units, while floating offshore wind is scaling in parallel without integrated LNG‑to‑power combinations; the white space lies in co‑developing platforms that deliver both firm gas‑fired capacity and variable renewables from the same offshore footprint.
Internal scenario modelling for 2030–2035 suggests that if only 5–10% of new floating offshore wind projects above 500 MW are co‑designed with LNG‑capable floating power units—either on shared mooring, nearby barge configurations, or hub‑and‑spoke architectures—the incremental TAM for hybrid platforms could reach several gigawatts of capacity, translating into multi‑billion‑dollar equipment opportunity. Unit economics improve because wind output reduces LNG consumption per MWh by 10–25% in suitable resource regimes, while gas units provide ramping and firming services that allow higher renewable penetration in constrained grids; margins can expand by mid‑single‑digit percentages via fuel savings and premium PPA structures that value flexibility and low emissions.
This is differentiated from current drivers in that today’s projects are still largely mono‑technology and policy frameworks have not fully priced hybrid benefits, but by 2035, hybrid floating platforms could add roughly 1.5 percentage points of CAGR upside over baseline floating LNG power growth, particularly in EU North Sea, APAC offshore, and US East Coast corridors where both LNG import capacity and offshore wind ambitions are high.
Opportunity Impact Analysis
| Opportunity | (~) % Potential CAGR Upside | Geographic Relevance | Execution Window |
|---|---|---|---|
| Hybrid floating LNG–offshore wind platforms | +1.5% | EU North Sea, APAC offshore, US East Coast | Long term (≥ 4 years) |
| Disaster relief and emergency microgrid vessels | +1.2% | APAC archipelagos, Caribbean, coastal Africa | Medium term (2-4 years) |
| Multi-service floating energy hubs (power + regas + storage) | +1.3% | APAC emerging, Middle East, Africa coastal | Medium term (2-4 years) |
| OEM-backed lease and pay-per-kWh models | +1.1% | Emerging markets, APAC, LatAm, Africa | Short term (≤ 2 years) |
| M&A roll-up of regional shipyards and EPC into LNG–power platforms | +0.9% | APAC yards, EU yards, Middle East EPC | Medium term (2-4 years) |
| Adjacent offshore industrial and data centre power clusters | +1.0% | North America, EU, APAC digital hubs | Long term (≥ 4 years) |
Challenges Analysis
Complex FLNG and power-plant engineering integration
Complex integration between floating LNG facilities (FPSO, FSRU) and onboard power plants is a long‑running challenge because it demands concurrent mastery of LNG processing, cryogenic storage, regasification, and high‑capacity generation within the constraints of a single hull, leading to design trade‑offs, interface risks, and protracted engineering cycles that slow project throughput without eliminating it entirely.
Internal project metrics often show that FEED and detailed design phases for integrated floating LNG‑to‑power units run 20–40% longer than comparable single‑function assets, with engineering man‑hours inflated by the need for iterative hull‑topside interaction analysis and the resolution of multi‑discipline clashes; this delays FID readiness and increases upfront non‑recoverable engineering spend by several million dollars per large project. During execution, mis‑aligned specifications or late design changes can add months to construction and commissioning schedules, creating standard deviation in delivery times and complicating fleet planning for owners.
Strategically, this friction forces corporates to invest in specialized design teams, digital twins, and modularization, but the learning curve for truly integrated floating LNG power plants remains long, justifying a 1.3–1.5 percentage‑point drag on potential CAGR as complex projects move more slowly through development pipelines and smaller players struggle to scale their engineering capacity.
Challenges Impact Analysis
| Challenge | (~) % CAGR Friction Drag | Geographic Relevance | Mitigation Horizon |
|---|---|---|---|
| Complex FLNG and power-plant engineering integration | -1.4% | Global FLNG corridors, APAC and EU design hubs | Long term (≥ 4 years) |
| Offshore logistics and maintenance volatility | -1.2% | APAC logistics, Africa coastal, global shipyards | Medium term (2-4 years) |
| Upstream gas supply variability and contract misalignment | -1.1% | APAC importers, Africa, LatAm supply chains | Medium term (2-4 years) |
| Regulatory uncertainty and limited local offshore expertise | -1.0% | APAC (SE Asia), emerging coastal markets | Long term (≥ 4 years) |
| Safety, environmental and incident-response risk management | -0.9% | Global offshore corridors, EU regulatory hubs | Long term (≥ 4 years) |
| System integration and performance tuning at start-up | -0.8% | Global EPC projects, complex multi-unit sites | Short term (≤ 2 years) |
Geopolitical Impact Analysis
Geopolitical Gas Diversification Reshaping Floating LNG Power Deployment
Europe’s gas-security strategy is reshaping demand for floating LNG power plants. In April 2026, according to the European Commission, Russia’s share of EU gas imports fell from 45% in 2021 to 12% in 2025, while the United States supplied 31%. This sharp shift has increased the value of mobile LNG-based generation that can be positioned near ports and reduce dependence on fixed pipeline routes.
Trade flows are also becoming more concentrated. In April 2026, according to the U.S. Energy Information Administration, U.S. LNG exports to Europe reached a record 10.3 Bcf/d in 2025, rising from 6.3 Bcf/d in 2024 and accounting for 68% of total U.S. LNG exports. During the same period, shipments to Asia declined from 4.0 Bcf/d to 2.5 Bcf/d, while exports to China dropped to zero.
This realignment creates both opportunity and risk for floating LNG power developers. European projects benefit from stronger fuel availability and improved supply security, while buyers in Asia, Africa, and island markets may face greater cargo competition. Developers are therefore likely to favour flexible contracts, diversified suppliers, and vessels capable of relocating when fuel costs or political conditions shift.
Regional Analysis
Asia Pacific Held the Largest Share of the Global Floating LNG Power Plant Market.
Asia Pacific held the leading position in the floating LNG power plant market, capturing a 38.6% share. Strong LNG-import infrastructure, large coastal populations, rising electricity requirements, and limited domestic fuel availability support regional demand. In June 2025, according to Japan’s Agency for Natural Resources and Energy, Japan’s energy self-sufficiency rate was only 15.3%, while approximately 70% of its electricity generation remained dependent on fossil fuels. This import dependence creates a favourable environment for floating LNG facilities that can provide dispatchable electricity without requiring extensive onshore terminal construction.
Latin America is gaining momentum as utilities seek flexible generation to balance changing hydropower and renewable output. In May 2025, according to Brazil’s government-owned Energy Research Office, thermoelectric generation reached 151.2 TWh in 2024, increasing by 11.4% from the previous year. Natural-gas-fired generation expanded even faster, rising by 23.9%, strengthening opportunities for floating LNG plants near ports and coastal demand centres
Key Regions and Countries Covered
- North America
- The US
- Canada
- Europe
- Germany
- France
- The UK
- Spain
- Italy
- Russia & CIS
- Rest of Europe
- APAC
- China
- Japan
- South Korea
- India
- ASEAN
- Rest of APAC
- Latin America
- Brazil
- Mexico
- Rest of Latin America
- Middle East & Africa
- GCC
- South Africa
- Rest of MEA
Key Players Analysis
Floating LNG power plant developers focus on strengthening operational flexibility, fuel security, and project delivery efficiency to remain competitive. A key priority is continuous technology improvement, including the integration of high-efficiency gas turbines, modular regasification units, digital control systems, and emissions-reduction equipment that improve plant reliability, fuel conversion, and environmental performance.
Strategic fleet expansion in import-dependent and power-deficit regions enables suppliers to respond quickly to electricity shortages and seasonal demand. Developers additionally emphasize predictive maintenance, remote monitoring, safety compliance, and flexible power-purchase agreements to maintain consistent performance, while forming long-term partnerships with governments and utilities to secure project pipelines and strengthen their position in high-demand energy markets.
The Major Players In The Industry
- Kawasaki Heavy Industries Ltd.
- Wärtsilä Oyj Abp
- Siemens Energy AG
- Wison Group
- Chiyoda Corporation
- Karadeniz Holding (Karpowership)
- Golar LNG Ltd.
- Höegh LNG
- Samsung Heavy Industries Co., Ltd.
- Hyundai Heavy Industries Co., Ltd.
- Keppel Offshore & Marine Ltd.
- ExxonMobil Corporation
- Shell plc
- Chevron Corporation
- Woodside Energy Group Ltd.
Key Development
- In September 2025, Karadeniz Holding’s Karpowership deployed the 240 MW Deniz Sultan in Gabon, increasing generation from 70 MW to 150 MW and shifting operations toward domestic natural gas, with carbon emissions expected to decline 35%.
- In August 2025, Wison Group completed sail-away of the 4 MTPA NGUYA FLNG unit, equipped with 180,000 cubic metres of LNG storage and dual-fuel generators, strengthening its floating gas infrastructure capabilities for future LNG-linked power projects
Report Scope
| Report Features | Description |
|---|---|
| Market Value (2025) | USD 671.2 Bn |
| Forecast Revenue (2035) | USD 913.2 Bn |
| CAGR (2026-2035) | 3.1% |
| Base Year for Estimation | 2025 |
| Historic Period | 2020-2024 |
| Forecast Period | 2026-2035 |
| Report Coverage | Revenue Forecast, Market Dynamics, Competitive Landscape, Recent Developments |
| Segments Covered | Plant Type (Power barge and Power ship), By Power Output (Medium‑scale (72–400 MW), Small‑scale (up to ~72 MW) and Large‑scale (>400 MW)), By Component (Power generation systems and Power distribution systems) |
| Regional Analysis | North America – The US & Canada; Europe – Germany, France, The UK, Spain, Italy, Russia & CIS, Rest of Europe; APAC– China, Japan, South Korea, India, ASEAN & Rest of APAC; Latin America– Brazil, Mexico & Rest of Latin America; Middle East & Africa– GCC, South Africa, & Rest of MEA |
| Competitive Landscape | Kawasaki Heavy Industries Ltd., Wärtsilä Oyj Abp, Siemens Energy AG, Wison Group, Chiyoda Corporation, Karadeniz Holding (Karpowership), Golar LNG Ltd., Höegh LNG, Samsung Heavy Industries Co., Ltd., Hyundai Heavy Industries Co., Ltd., Keppel Offshore & Marine Ltd., ExxonMobil Corporation, Shell plc, Chevron Corporation, Woodside Energy Group Ltd. |
| Customization Scope | Customization for segments, region/country-level will be provided. Moreover, additional customization can be done based on the requirements. |
| Purchase Options | We have three licenses to opt for: Single User License, Multi-User License (Up to 5 Users), Corporate Use License (Unlimited Users and Printable PDF) |





































