


Report Overview
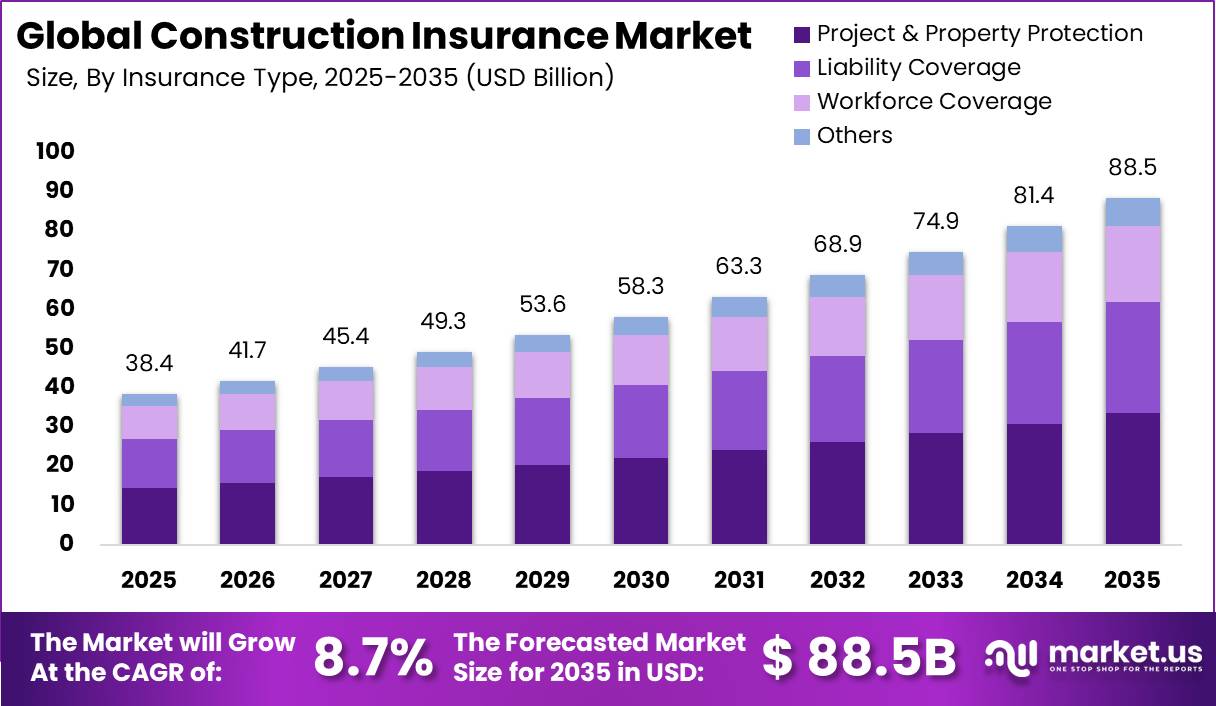
In 2025, the Global Construction Insurance Market was valued at USD 38.4 billion and is projected to expand at a CAGR of 8.7% during 2026–2035, reaching approximately USD 88.5 billion by 2035. North America led the market in 2025, accounting for more than 36.0% of the global market share and generating around USD 13.82 billion in revenue. This growth is closely linked to the expansion of the global construction industry, supported by rising investments in residential, commercial, industrial, and infrastructure projects.
According to the U.S. Census Bureau, total construction spending in the United States reached an annual rate of approximately USD 2.1–2.2 trillion during 2025–2026, covering private and public construction activities. Globally, construction output is estimated to be in the USD 10–13 trillion range, with further growth expected through the mid-2030s due to increasing housing demand, industrial expansion, transportation development, and energy infrastructure projects.
Growing infrastructure requirements, climate-resilient construction standards, and stricter project risk management practices are encouraging broader insurance coverage. As project values, insurance limits, and coverage requirements increase.
North America’s market dominance is supported by strong infrastructure investment, strict building regulations, and higher adoption of risk protection measures. U.S. public construction spending, including highways and educational facilities, exceeded an annual rate of USD 500 billion, while private residential and non-residential construction spending surpassed USD 1.6 trillion annually.
Key Takeaway
- The global Construction Insurance market was valued at USD 38.4 billion in 2025 and is projected to reach USD 88.5 billion by 2035, expanding at a CAGR of 8.7% during the forecast period (2026–2035).
- Project & Property Protection dominated the market by Insurance Type with a 38.0% share in 2025.
- Residential Construction led the market by Construction Type with a 31.0% share in 2025.
- Large Projects (USD 100 Million–USD 1 Billion) held the largest share by Project Size with 34.0% in 2025.
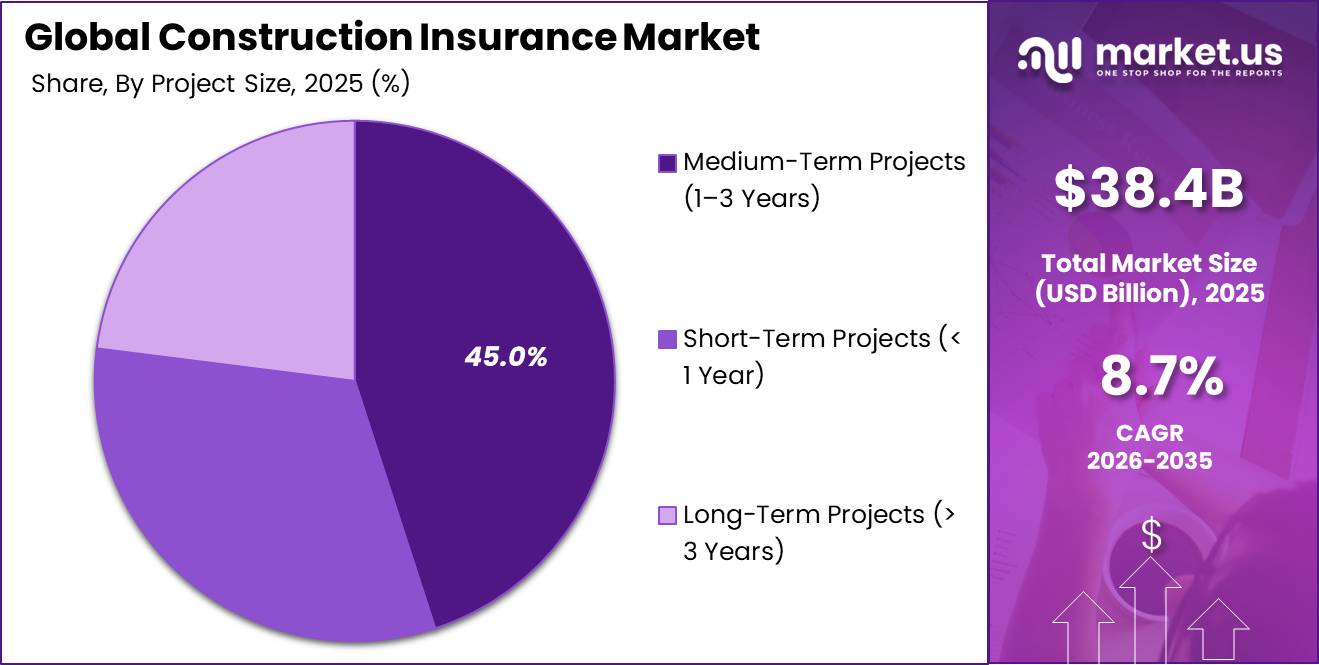
- Medium-Term Projects (1–3 Years) dominated the market by Project Duration with a 45.0% share in 2025.
- Contractors & Subcontractors accounted for the largest share by End User with 38.0% in 2025.
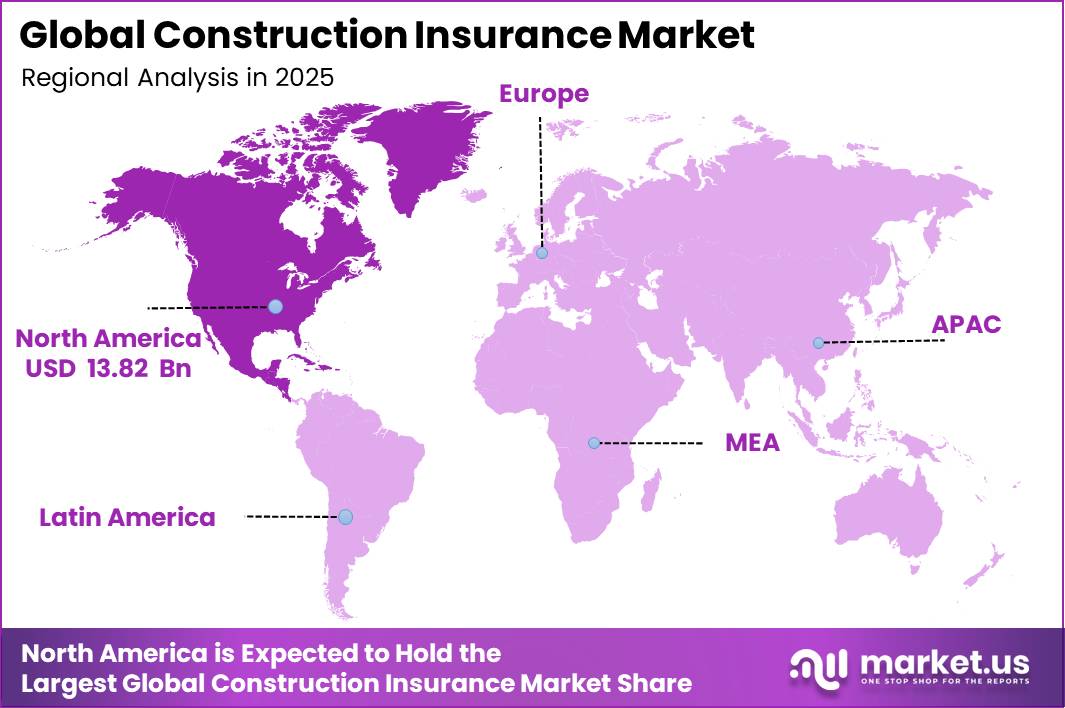
- North America dominated the global Construction Insurance market with a 36.0% share in 2025, valued at approximately USD 13.82 Billion.
By Insurance Type
Project and Property Protection accounts for 38.0% share because it directly insures the high-value physical assets that dominate construction balance sheets, including buildings under construction, structural components, construction materials, machinery, and heavy equipment deployed on project sites.
Global crude steel production reached approximately 1,850 million tonnes in 2025, illustrating the enormous volume of structural materials incorporated into construction projects and the significant asset values exposed to potential loss or damage.
At the same time, global construction output is estimated at approximately USD 9.4 trillion in 2025, meaning that even relatively small percentages of physical damage can generate multibillion-dollar insurance claims. Construction projects remain exposed throughout the construction cycle to risks including fire, structural collapse, theft, natural catastrophes, vandalism, and accidental damage, which primarily affect physical property rather than liability-related exposures.
By Construction Type
Residential Construction leads with a 31.0% share due to persistent global housing shortages, rising urbanization, and continuous demand for residential development projects. United Nations agencies estimate that approximately 300 million people are homeless, around 1.6 billion people face severe housing affordability challenges, and nearly 3 billion people will require adequate housing by 2030.
The UN also projects that the global urban population will rise from 55% today to 68% by 2050, increasing demand for apartments, affordable housing, and urban regeneration projects. Mandatory insurance requirements linked to construction financing and mortgage-backed developments further strengthen Residential Construction’s dominance in the global construction insurance market.
Infrastructure Construction is the fastest-growing segment as governments and private investors accelerate investments to overcome infrastructure gaps and develop large-scale projects. The World Bank estimates that emerging markets face an annual infrastructure investment gap of approximately USD 452 billion, while global private participation in infrastructure reached USD 100.7 billion in 2024, increasing 16% from 2023.
Additionally, long-term infrastructure development is expected to require approximately USD 151.1 trillion in investment over the coming decades. High-value projects such as highways, railways, airports, ports, and power plants involve significant engineering, delay, property, and liability risks, driving demand for specialized construction insurance coverage.
By Project Size
Large Projects between USD 100 million and 1 billion hold a 34.0% share because this project size represents the ideal balance between high asset values, significant risk exposure, and strong insurance requirements. The global expansion of infrastructure networks, urban development, and complex mixed-use projects has increased the concentration of construction activity within this investment range.
The World Bank’s Infrastructure Monitor and related analyses highlight that emerging markets require several hundred billion dollars annually in infrastructure investment, with many individual projects structured within the USD 100 million-plus category. Globally, the need to invest approximately 3.5% of GDP, equivalent to around USD 4.2 trillion annually over the next decade, to strengthen and future-proof infrastructure further supports the growth of high-value construction projects.
Projects within the USD 100 million–1 billion range, including urban metro systems, regional airports, logistics hubs, and large residential developments, require extensive insurance solutions covering builder’s risk, delay-in-startup, third-party liability, and professional indemnity. Unlike mega projects exceeding USD 1 billion, which are fewer in number, large projects occur more frequently while still requiring comprehensive coverage due to their financial scale and complexity.
Strong financing requirements from banks, investors, and multilateral institutions further mandate robust insurance programs to protect project investments, cash flows, and debt obligations, making USD 100 million–1 billion projects the largest contributor to construction insurance premiums.
By Project Duration
Medium-term projects of 1–3 years command a 45.0% share because this duration aligns with the construction timelines of many widely developed asset categories, including mid-rise residential buildings, commercial properties, transport facilities, and energy projects.
Global construction activity, valued at approximately USD 9.4 trillion in 2025, includes a significant volume of projects within this timeframe, creating a large base of insurable construction risks. Projects lasting 12–36 months typically cover critical construction stages such as foundations, structural development, building enclosure, and systems installation, where exposure to risks including structural failure, weather-related damage, delays, and construction defects is highest.
By End User
Contractors and subcontractors hold a 38.0% share because they are the primary participants exposed to on-site construction risks and therefore represent the largest buyers and beneficiaries of construction insurance. As construction is a project-based industry with global output reaching multi-trillion-dollar levels, contractors manage daily site operations, workforce activities, equipment, materials, and logistics.
In infrastructure development, emerging markets face an annual investment gap of approximately USD 452 billion, while increasing private participation continues to generate thousands of contractor-led projects that require insurance coverage as part of contractual and financing requirements. Construction contracts often transfer significant project risks to contractors, who may further allocate certain responsibilities to subcontractors.
Key Market Segments
By Insurance Type
- Project & Property Protection
- Builder’s Risk Insurance
- Installation Floater
- Equipment Floater
- Liability Coverage
- Commercial General Liability (CGL)
- Professional Liability
- Pollution Liability
- Workforce Coverage
- Workers’ Compensation
- Employer’s Liability
- Others
By Construction Type
- Residential Construction
- Commercial Construction
- Industrial Construction
- Infrastructure Construction
- Marine & Offshore Construction
- Others
By Project Size
- Small Projects (< USD 10 Million)
- Medium Projects (USD 10M–USD 100M)
- Large Projects (USD 100M–USD 1 Billion)
- Mega Projects (> USD 1 Billion)
By Project Duration
- Medium-Term Projects (1–3 Years)
- Short-Term Projects (< 1 Year)
- Long-Term Projects (> 3 Years)
By End User
- Contractors & Subcontractors
- Project Owners & Developers
- Government & Public Sector
- Real Estate Developers
- Engineering, Procurement & Construction (EPC) Firms
- Financial Institutions & Project Lenders
- Others
Market Dynamics
Drivers
| Driver | (~) % Impact on CAGR | Geographic Relevance | Impact Timeline |
|---|---|---|---|
| Accelerating Government Infrastructure Capex & Stimulus Pipelines | +2.1% | India, Southeast Asia, Middle East, North America | Short term (≤ 2 years) |
| Escalating Frequency & Severity of Natural Catastrophe Events | +1.6% | Global, highest in North America, Asia-Pacific, Europe | Short term (≤ 2 years) |
| Mandatory Builders Risk & Contractor Liability Regulatory Requirements | +0.9% | EU, United States, GCC, Australia | Medium term (2–4 years) |
| Rising Construction Material & Labour Cost Inflation Driving Up Insured Values | +0.8% | North America, Western Europe, India | Short term (≤ 2 years) |
| Digital Adoption & AI-Enabled Underwriting Efficiency Expanding Policy Reach | +0.7% | Global, led by North America, UK, Singapore | Medium term (2–4 years) |
| Green & Sustainable Construction Boom Creating New Insurable Asset Classes | +0.6% | EU, North America, East Asia | Medium term (2–4 years) |
The single most structurally powerful driver of construction insurance demand is the unprecedented wave of sovereign infrastructure capital expenditure that entered active deployment between 2024 and 2026. India’s Union Budget 2026–27 allocated a capital expenditure estimate of ₹12.2 lakh crore (approximately USD 146 billion), a 6x increase over the ₹2 lakh crore budgeted in FY2014–15, with the government simultaneously introducing an Infrastructure Risk Guarantee Fund to de-risk private lenders.
In Southeast Asia, infrastructure investment across Vietnam, Thailand, the Philippines, Malaysia, and Indonesia is driving an Asia-Pacific infrastructure construction market estimated at USD 1.42 trillion in 2025 and projected to reach USD 1.95 trillion by 2030 at a 6.59% CAGR. At the global level, the infrastructure construction sector was valued at approximately USD 2.89 trillion in 2025 and is forecast to reach USD 3.92 trillion by 2030, implying a USD 1.03 trillion incremental insurable asset base entering the market over the forecast horizon.
For insurers, each USD 1 billion of large infrastructure project value typically generates between USD 3 million and USD 8 million in annual premium across contract works, third-party liability, professional indemnity, and delay-in-start-up (DSU) lines, compressing combined ratios for specialty carriers writing well-managed government-backed risks while also attracting new capacity from reinsurers seeking diversification away from catastrophe-heavy books.
Restraints
| Restraint | (~) % Impact on CAGR | Geographic Relevance | Impact Timeline |
|---|---|---|---|
| Social Inflation & Nuclear Verdict Spiral Eroding Commercial Liability Profitability | -1.4% | United States, secondary spread to Canada, Australia, UK | Short term (≤ 2 years) |
| Reinsurance Capacity Constraints & Hardening Retrocession Pricing | -1.0% | Global, acute in North America, Caribbean, Australia | Short term (≤ 2 years) |
| Persistent Underinsurance & Low Insurance Penetration in Emerging Markets | -0.8% | Sub-Saharan Africa, South Asia, Southeast Asia, Latin America | Long term (≥ 4 years) |
| Elevated Interest Rate Environment Suppressing Project Finance & CapEx Decisions | -0.6% | North America, EU, UK, Emerging Markets | Short term (≤ 2 years) |
| Increasing Claims Frequency from Construction Site Safety Deficiencies | -0.5% | Global, most severe in India, Middle East, Southeast Asia | Medium term (2–4 years) |
Social inflation represents the most acute structural restraint actively compressing underwriting margins in construction commercial general liability (CGL) and umbrella lines today. In 2024, U.S. courts recorded 135 nuclear verdicts, jury awards exceeding USD 10 million, a 52% year-over-year surge, collectively generating USD 31.3 billion in total awards, an increase of 116% versus 2023, with a median per-verdict payout rising to USD 51 million, including five individual verdicts exceeding USD 1 billion each.
This systemic trend has driven a 57% cumulative increase in U.S. liability claims costs over the preceding decade, outpacing general economic inflation by nearly 2x on an annualised basis, directly forcing construction CGL carriers to implement premium surcharges of 1% to 9% for policy years 2024–2025, while simultaneously tightening coverage breadth, raising per-occurrence retentions, and exiting high-risk contractor segments (roofing, scaffolding, demolition) in states with the most plaintiff-friendly tort environments.
Third-party litigation funding (TPLF), estimated to have deployed over USD 15 billion in U.S. commercial litigation as of 2025, has systematically extended the tail on construction liability claims, inflating incurred but not reported (IBNR) reserves by an estimated 8–15% above actuary baseline projections and compressing the return on equity for construction liability books from a historical 12–14% range to sub-8% for carriers without robust claims triage and early settlement disciplines.
Challenges
| Challenge | (~) % CAGR | Geographic Relevance | Mitigation Horizon |
|---|---|---|---|
| Skilled Trades Workforce Deficit | -0.9% | North America, Western Europe, Australia | Long term (≥ 4 years) |
| Construction Cost & Supply Chain Volatility | -0.7% | Global | Medium term (2–4 years) |
| Natcat Modelling Accuracy Gaps | -0.6% | Global, acute in Southeast Asia, Caribbean, India | Long term (≥ 4 years) |
| ESG & Climate Disclosure Compliance Burden | -0.5% | EU, UK, United States, Australia | Medium term (2–4 years) |
| Cyber Risk Integration into Project Risk | -0.4% | Global, led by North America, EU, UK | Medium term (2–4 years) |
| Legacy Underwriting Data & Digitisation Lag | -0.3% | Global, most acute in South Asia, Africa, Latin America | Medium term (2–4 years) |
The chronic shortage of qualified skilled labour in the construction sector constitutes the most pervasive operational friction drag on construction insurance market performance because it compounds loss ratios across multiple lines simultaneously- workers’ compensation, contractor’s all-risk, builder’s risk, and general liability, rather than pressuring any single coverage class in isolation.
As of 2025–2026, the U.S. construction industry alone requires an estimated 300,000 to 546,000 net new workers annually above normal attrition replacement hiring to meet active project demand, while 66% of contractors report project schedule delays attributable directly to labour scarcity and 45% have declined revenue-generating project awards due to inability to staff them. The aggregate economic impact of extended construction timelines attributable to the skilled labour shortage has been estimated at USD 10.8 billion per year in the U.S. alone.
The premium rate environment has absorbed some of this pressure through construction labour rate escalation of approximately +4.2% year-on-year as of mid-2026, which raises declared contract values and insured sums, but the underlying frequency deterioration cannot be fully offset by premium adjustment alone.
Opportunities
| Opportunity | (~) % Potential CAGR | Geographic Relevance | Execution Window |
|---|---|---|---|
| Parametric Construction Insurance Product Scaling | +1.8% | Global, highest white space in Asia-Pacific, Latin America, Africa | Medium term (2–4 years) |
| Emerging Market Protection Gap Monetisation | +1.4% | India, Southeast Asia, Sub-Saharan Africa, MENA | Long term (≥ 4 years) |
| Specialty MGA & E&S Lines Roll-Up Consolidation | +1.0% | United States, UK, Bermuda | Short term (≤ 2 years) |
| Cyber-Physical Risk Bundled Coverage Products | +0.7% | North America, EU, UK, Australia | Medium term (2–4 years) |
| Green & Net-Zero Infrastructure Specialised Lines | +0.6% | EU, North America, East Asia | Medium term (2–4 years) |
| AI-Driven Usage-Based & Telematics Construction Insurance | +0.5% | North America, UK, Singapore, UAE | Long term (≥ 4 years) |
Parametric coverage for construction projects remains predominantly untapped white space; today’s deployment is concentrated in a narrow slice of large multinational contractors and public infrastructure procurers, while the vast majority of mid-market contractors globally have no access to trigger-based weather, seismic, or flood coverage that bypasses the slow indemnity loss-adjustment cycle.
The structural case for deliberate strategic action, rather than passive drift, is that parametric solutions eliminate the two primary friction points that suppress traditional construction insurance uptake in mid-market and emerging market project environments: lengthy loss-adjustment timelines (parametric payouts settle within 15–30 days versus 6–18 months for complex indemnity claims) and basis-risk opacity (objective third-party data triggers, wind speed, rainfall index, ground acceleration, replace the subjective on-site loss assessment process entirely).
For insurers willing to invest in trigger calibration data partnerships, satellite imagery integration, and standardised construction parametric policy wordings, the unit economics shift materially: claims handling costs can be reduced by an estimated 40–60% per policy versus traditional CAR lines, policy issuance can be automated at sub-USD 500 per-policy operational cost for standardised project types, and portfolio loss ratios become more predictable, supporting higher sustainable premium volume growth without proportional claims infrastructure scaling.
The USD 1.42 trillion Asia-Pacific infrastructure construction market, where 50–70% of total economic losses from natural catastrophes remain uninsured, represents the highest-density white space for first-mover parametric product deployment.
Geopolitical Impact Analysis
Geopolitical fragmentation is increasing risk across the global construction insurance market by raising the cost of key inputs such as steel, aluminum, energy, and logistics. These cost pressures are increasing insured project values, replacement costs, and claim severity.
In Europe, proposed steel safeguard measures would reduce tariff-free steel import quotas by 47% from 2024 levels to 18.3 million tons and increase out-of-quota duties from 25% to 50%, driving higher structural steel and rebar costs. In South Africa, steel tariff increases of 10–30% have contributed to contractor steel cost increases of 8–15% during 2025–2026, increasing exposure under builders’ risk and property insurance policies.
Supply chain disruptions are further affecting construction risks. UNCTAD’s Review of Maritime Transport 2024 reported that Red Sea and Suez Canal disruptions between October 2023 and June 2024 extended Asia–Europe shipping times by 7–10 days and increased freight rates by 200–300% on affected routes. These disruptions have raised costs for transporting machinery, construction materials, and project equipment, increasing delay-in-start-up and business interruption risks.
Energy volatility is also adding pressure on project costs. The IEA’s Oil 2024 outlook reported crude demand and refinery runs reaching 83.3 mb/d in 2024, with supply disruptions causing Brent price swings of more than 30% during the year. Combined supply chain and material cost increases have raised infrastructure project costs by an estimated 12–20%.
Regional Analysis
North America dominates the global construction insurance market, accounting for around 36.0% of total revenue, valued at approximately USD 13.82 billion in 2025. The region’s leadership is supported by a well-established construction sector, strict regulatory standards, high adoption of risk management practices, and strong demand for liability and project insurance coverage across commercial, residential, and industrial developments.
Asia Pacific is the fastest-growing region in the construction insurance market, driven by rapid urbanization, infrastructure expansion, industrial development, and large-scale projects across China, India, and Southeast Asia. Increasing investments in transportation, renewable energy, smart cities, and manufacturing facilities are boosting demand for construction-related insurance solutions, including contract works, liability, and project-specific coverage.
Key Regions and Countries
North America
- US
- Canada
Europe
- Germany
- France
- The UK
- Spain
- Italy
- Rest of Europe
Asia Pacific
- China
- Japan
- South Korea
- India
- Australia
- Rest of APAC
Latin America
- Brazil
- Mexico
- Rest of Latin America
Middle East & Africa
- GCC
- South Africa
- Rest of MEA
Key Players Analysis
Tier-1 construction insurance providers are dominated by large multiline insurers such as Allianz, AXA, Zurich, Chubb, and AIG, which hold a significant share of global construction-related property and casualty (P&C) premiums through construction all-risk (CAR), erection all-risk (EAR), contractor programs, and surety solutions. These insurers benefit from strong balance sheets, global networks, and the ability to underwrite large-scale infrastructure and commercial projects.
Allianz reported approximately EUR 82.3 billion in P&C premiums in 2023, while AXA generated EUR 53.0 billion from P&C and health insurance, including EUR 33.0 billion in commercial lines premiums, highlighting their strong presence in corporate and specialty risk segments. Zurich, Chubb, and AIG also maintain substantial commercial P&C operations, providing significant capacity for construction, engineering, and project-related risks.
Tier-2 insurers and specialty providers, including Beazley, Liberty Mutual, QBE, Munich Re, and Tokio Marine, compete through specialized underwriting, reinsurance capacity, and regional construction portfolios. These companies support complex construction risks through facultative and treaty reinsurance, technical risk assessments, and customized coverage solutions.
Top Key Players in the Market
- Zurich Insurance Group
- AIG (American International Group)
- Allianz SE
- AXA XL (AXA Group)
- Chubb Limited
- Munich Re Group
- Swiss Re Ltd.
- Liberty Mutual Insurance
- Tokio Marine HCC
- Travelers Companies Inc.
- QBE Insurance Group
- Berkshire Hathaway (General Re / GEICO / BH Specialty)
- Beazley PLC
- Mapfre S.A.
- Hannover Rück SE (Hannover Re)
Recent Developments
- In June 2026, AXA XL expanded its construction insurance offering for public infrastructure projects, providing up to EUR 750 million single-project capacity and over EUR 1.5 billion annual aggregate limits, with coverage for delay-in-start-up and loss-of-profit risks in projects exceeding EUR 1 billion.
- In June 2026, Zurich Insurance Group’s “Beyond 2030” report highlighted rising construction risks from labour shortages, cyber threats, and climate impacts, noting that over USD 10 trillion in global construction projects through 2030 may require new insurance and risk-transfer solutions.
Report Scope
| Report Features | Description |
|---|---|
| Market Value (2025) | USD 38.4 Billion |
| Forecast Revenue (2035) | USD 88.5 Billion |
| CAGR (2026-2035) | 8.7% |
| Base Year for Estimation | 2025 |
| Historic Period | 2020-2024 |
| Forecast Period | 2026-2035 |
| Report Coverage | Revenue Forecast, Market Dynamics, Competitive Landscape, Recent Developments |
| Segments Covered | By Insurance Type (Project & Property Protection, Liability Coverage, Workforce Coverage, Others), By Construction Type (Residential Construction, Commercial Construction, Industrial Construction, Infrastructure Construction, Marine & Offshore Construction, Others), By Project Size (Small Projects, Medium Projects, Large Projects, Mega Projects), By Project Duration (Short-Term Projects, Medium-Term Projects, Long-Term Projects), By End User (Contractors & Subcontractors, Project Owners & Developers, Government & Public Sector, Real Estate Developers, EPC Firms, Financial Institutions & Project Lenders, Others) |
| Regional Analysis | North America, US, Canada; Europe, Germany, France, The UK, Spain, Italy, Rest of Europe; Asia Pacific, China, Japan, South Korea, India, Australia, Singapore, Rest of APAC; Latin America, Brazil, Mexico, Rest of Latin America; Middle East & Africa, GCC, South Africa, Rest of MEA |
| Competitive Landscape | Zurich Insurance Group, AIG (American International Group), Allianz SE, AXA XL (AXA Group), Chubb Limited, Munich Re Group, Swiss Re Ltd., Liberty Mutual Insurance, Tokio Marine HCC, Travelers Companies Inc., QBE Insurance Group, Berkshire Hathaway (General Re / GEICO / BH Specialty), Beazley PLC, Mapfre S.A., Hannover Rück SE (Hannover Re) |
| Customization Scope | Customization for segments and region/country-level will be provided. Moreover, customization can be tailored to the requirements. |
| Purchase Options | We have three licenses to opt for: Single User License, Multi-User License (Up to 5 Users), Corporate Use License (Unlimited Users and Printable PDF) |





































