


Report Overview
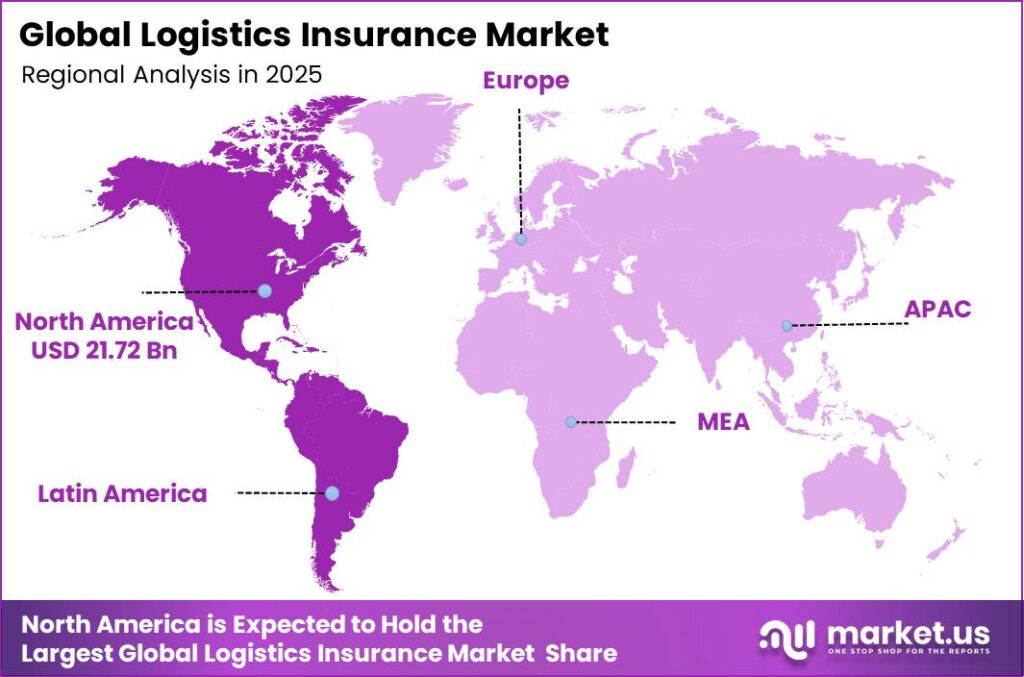
In 2025, the Global Logistics Insurance Market was valued at USD 63.5 billion. The market is projected to grow at a CAGR of 3.0% from 2026 to 2035, reaching approximately USD 84.9 billion by 2035. North America accounted for the largest market share of 34.21% in 2025 due to its large freight network and high-value cross-border trade.
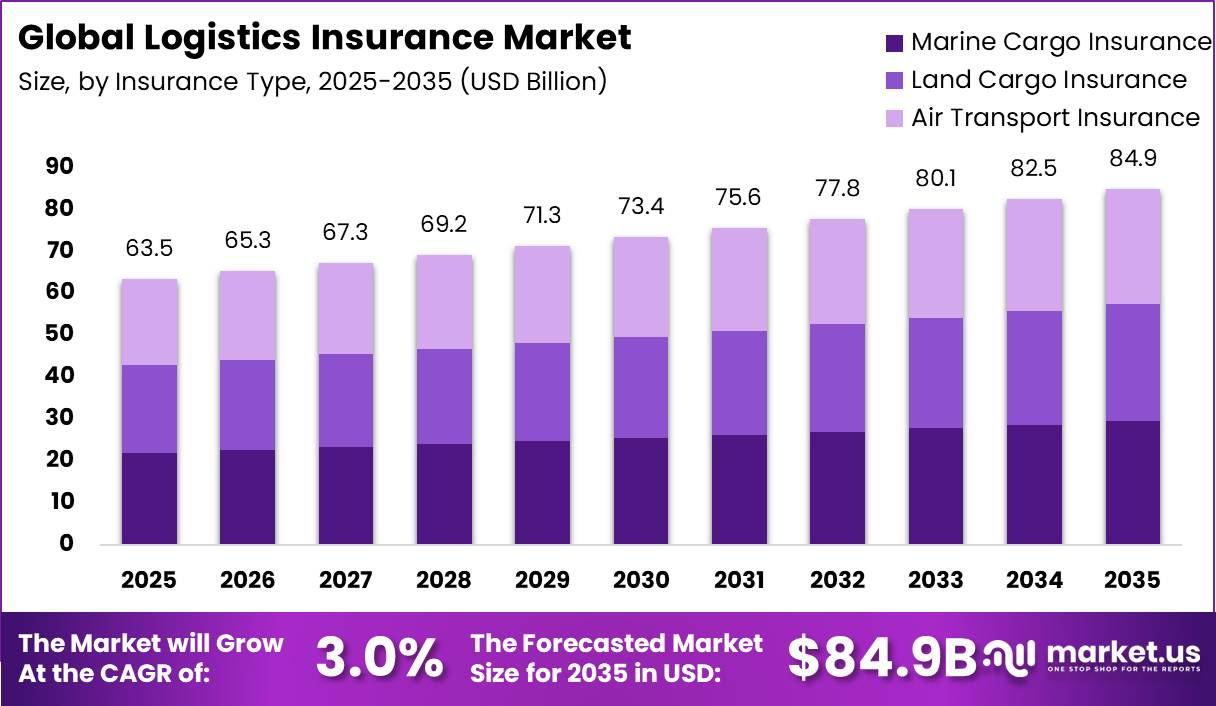
This market growth is mainly supported by the continuous expansion of global goods trade. According to the World Trade Organization (WTO), global trade in goods and commercial services reached a record USD 35 trillion in 2025, while goods trade increased by 6.5% during the year. The WTO’s Global Trade Outlook and Statistics 2026 also reported that world merchandise trade volume grew 4.6% in 2025, exceeding earlier forecasts.
In addition, UNCTAD’s Review of Maritime Transport 2025 stated that global seaborne trade reached 12.72 billion tonnes in 2024, with container trade projected to grow 2.7% annually through 2029. As more goods move through global supply chains, demand for cargo insurance and logistics insurance continues to increase, supporting steady premium growth.
According to the U.S. Bureau of Transportation Statistics (BTS), North American transborder freight reached USD 1.6 trillion in 2025, while cross-border truck freight hit a record USD 144.8 billion in March 2025, up 8.4% year over year. The U.S. Bureau of Economic Analysis (BEA) reported that U.S. real GDP grew at an annualized 4.3% in Q3 2025, supporting higher domestic demand and cargo movement.
Furthermore, the World Bank’s Global Economic Prospects estimated global GDP growth at 2.9% in 2025, helping maintain international supply chain activity. Rising cargo values, expanding e-commerce shipments, and increasing use of multimodal transport are driving higher insurance coverage needs, contributing to long-term market growth.
Key Takeaways
- In 2025, the Global Logistics Insurance Market was valued at USD 63.5 billion.
- The market is projected to grow at a CAGR of 3.0% during 2026 to 2035, reaching approximately USD 84.9 billion by 2035.
- By insurance type, Marine Cargo Insurance held the leading position in 2025, capturing 34.66% of the global market share due to its extensive use in international trade and cargo transportation.
- By coverage type, Cargo Insurance accounted for the largest market share of 46.78% in 2025, reflecting strong demand for financial protection against cargo loss and damage during transit.
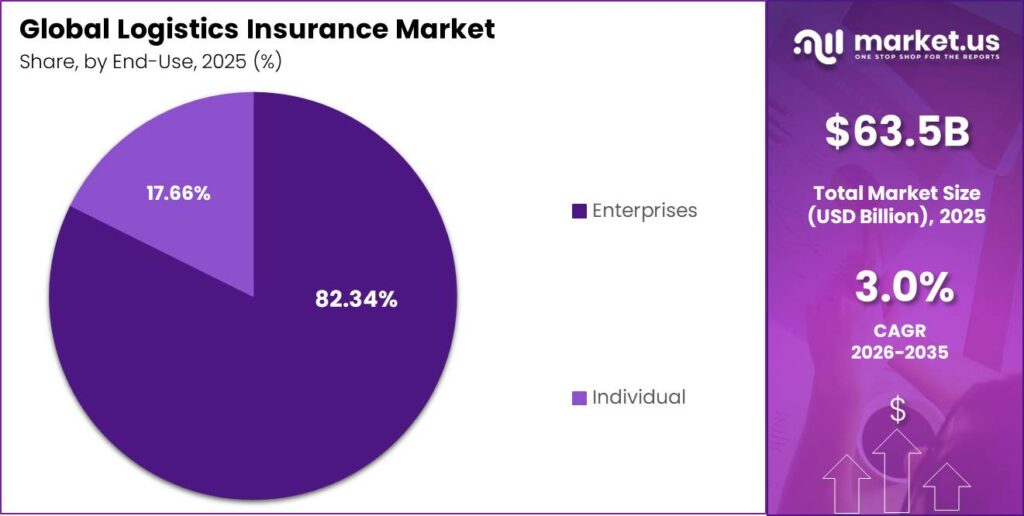
- By end user, Enterprises dominated the market with 82.34% of the total revenue share in 2025, driven by high shipment volumes and comprehensive risk management strategies.
- North America dominated the global market in 2025, accounting for more than 34.21% of the total market revenue, supported by its well-established logistics infrastructure and high insurance penetration.
By Insurance Type
Marine Cargo Insurance accounted for the largest 34.66% share of the global logistics insurance market in 2025, driven by the continued growth of international seaborne trade. According to the International Union of Marine Insurance (IUMI), transport/cargo insurance represented 56.7% of global marine insurance premiums in 2024, generating USD 22.64 billion in premiums, up 1.6% year over year.
This leadership is supported by the fact that more than 80% of global trade by volume is transported by sea, making cargo insurance essential for protecting goods throughout international supply chains. UNCTAD reported that global seaborne trade reached 12,720 million tonnes in 2024, increasing demand for marine cargo insurance across containerized goods, bulk commodities, and liquid cargo shipments.
Regional growth also remained strong, with Asia-Pacific cargo premiums rising 8.8% in 2024, while China accounted for 17.6% of global marine cargo premiums, reflecting its leading role in global manufacturing and exports. With global seaborne trade projected to grow by around 2% annually through 2030, marine cargo insurance is expected to maintain its leading position in the logistics insurance market.
By Coverage Type
Cargo Insurance dominated the logistics insurance market by coverage type, accounting for 46.78% of the global market in 2025. Its leadership is driven by the need to protect goods from loss, theft, damage, and accidents during transportation across sea, air, and road networks. Rising global trade volumes and increasing shipment values continue to make cargo insurance an essential risk management solution.
The World Shipping Council (WSC) reported that 1,478 containers were lost at sea in 2025 out of nearly 280 million containers transported worldwide, mainly due to severe weather and vessel fires. Beginning January 1, 2026, WSC member carriers are also required to report all container losses, improving claim transparency.
The International Air Transport Association (IATA) reported that global air cargo demand reached a record 69 million tonnes in 2025, up 3.4% year-over-year, increasing the need for cargo protection. In addition, the Allianz Safety and Shipping Review 2026 recorded more than 200 vessel fire incidents in 2025, the second-highest level in the past decade, highlighting the continued importance of cargo insurance across global supply chains.
The Carrier/Freight Liability Insurance segment is projected to register the fastest growth in the logistics insurance market due to the continuous increase in freight transportation across road, air, and rail networks. According to the American Trucking Associations (ATA), U.S. trucks transported 11.27 billion tonnes of freight in 2024, with freight volumes expected to grow by 1.6% in 2025 and reach nearly 14 billion tonnes by 2035. This steady increase is driving greater demand for carrier liability insurance.
International regulations further support market growth, as the CMR Convention (road), Montreal Convention (air), and CIM Convention (rail) require carriers to maintain financial liability coverage. In addition, IATA reported that global air cargo demand increased by 3.4% in 2025, reaching a record high, while Eurostat reported that EU road freight transport reached 1.91 trillion tonne-kilometres by Q3 2025.
By End User
Enterprises held the dominant position in the logistics insurance market, accounting for 82.34% of the market share in 2025. This leadership is driven by the high shipment volumes handled by large companies across global supply chains. According to Fortune, the Fortune Global 500 generated a record USD 41.7 trillion in revenue in 2025, up 1.8% from the previous year, reflecting extensive cross-border trade that requires comprehensive logistics insurance coverage.
Large enterprises play a central role in global trade networks. The OECD reported that global value chain (GVC)-related trade contributed around 17% of global GDP in 2024, with major manufacturers and retailers managing sourcing, production, and distribution across multiple countries.
UNCTAD stated that global merchandise exports reached USD 26.3 trillion in 2025, increasing 7.2% year-over-year, while developed economies accounted for 54% of total exports. Due to their larger shipment values and higher transit risks, enterprises invest more in comprehensive logistics insurance, whereas small businesses often depend on the limited liability coverage offered by carriers.
Key Market Segments
By Insurance Type
- Land Cargo Insurance
- Marine Cargo Insurance
- Air Transport Insurance
By Coverage Type
- Cargo Insurance
- Carrier/Freight Liability Insurance
- Warehouse/Storage Insurance
- Ancillary and Cyber Coverages
By End User
- Individual
- Enterprises
Market Dynamics
Drivers
| Driver | (~) % Impact on CAGR | Geographic Relevance | Impact Timeline |
|---|---|---|---|
| E-commerce parcel volume growth | +1.2% | Asia-Pacific, North America, Europe | Short term (≤ 2 years) |
| Expansion of multimodal logistics corridors | +0.8% | Europe, Asia-Pacific, Middle East | Medium term (2–4 years) |
| Increasing climate-related supply chain losses | +0.5% | Global | Short term (≤ 2 years) |
| Regulatory reinforcement of cargo insurance compliance | +0.4% | Africa, Asia, select emerging markets | Medium term (2–4 years) |
| Digitization of policy issuance & claims | +0.3% | Global | Short term (≤ 2 years) |
E-commerce parcel volume growth
The rapid expansion of online retail since 2024 has driven double-digit growth in parcel volumes, with many national postal and courier operators reporting shipment increases of 10–20% annually, which structurally raises exposure of goods in transit and pushes logistics operators to embed insurance into standard service packages rather than treating it as an optional add-on.
This volume surge shifts business models toward bundled, per-shipment micro-coverage with minimum premiums per parcel often in the 0.3–0.8% range of declared value, allowing insurers to scale underwriting across tens of millions of small tickets while logistics platforms automate certificate issuance and payment collection.
As claims frequency on last‑mile and cross‑border parcels typically runs 2–3 times higher than for traditional full-container loads due to handling density and theft risk, insurers adjust pricing algorithms and risk scoring, compressing underwriting margins by an estimated 1–2 percentage points but expanding gross written premiums through sheer shipment volume and cross-sell of add-on coverages such as delay and temperature deviation.
Restraints
| Restraint | (~) % Impact on CAGR | Geographic Relevance | Impact Timeline |
|---|---|---|---|
| High interest rate environment raising insurance cost sensitivity | –1.0% | North America, Europe, select emerging markets | Short term (≤ 2 years) |
| Underinsurance among SMEs in cross-border trade | –0.8% | Asia-Pacific, Africa, Latin America | Medium term (2–4 years) |
| Complex multi-jurisdiction compliance for marine & cargo cover | –0.6% | Global | Medium term (2–4 years) |
| Limited actuarial data for emerging logistics risks | –0.4% | Emerging markets | Long term (≥ 4 years) |
| Carrier liability limits reducing perceived need for separate cover | –0.2% | Global | Short term (≤ 2 years) |
High interest rate environment raising insurance cost sensitivity
Sustained policy rate tightening across major economies in 2023–2024 has pushed average borrowing costs for logistics operators and shippers up by 200–300 basis points, elevating debt service ratios and forcing procurement teams to scrutinize every non-core operating expense, including insurance premiums.
With many carriers operating on EBIT margins in the 5–8% range, a 5–10% annual increase in logistics insurance premiums driven by higher loss ratios and reinsurance costs translates into an incremental margin compression of roughly 0.5–1.0 percentage point, prompting some shippers, especially rate-sensitive SMEs, to lower insured values or reduce optional cover such as consequential loss and business interruption.
This restraint manifests quantitatively as lower policy penetration in segments with tight cash cycles, a shift towards higher deductibles, and increased shopping for cheaper, stripped-down products, which together shave close to 1.0% off the otherwise higher growth trajectory implied by risk exposure trends, and delays CapEx-driven expansions of integrated risk solutions by logistics providers as they prioritize core fleet and warehousing investments.
Challenges
| Challenge | (~) % CAGR | Geographic Relevance | Mitigation Horizon |
|---|---|---|---|
| Climate volatility catastrophe modelling gaps | –0.9% | Global | Long term (≥ 4 years) |
| Integration of logistics platforms with insurers | –0.7% | Global | Medium term (2–4 years) |
| Shortage of specialized marine risk underwriters | –0.5% | Global, more acute in emerging markets | Medium term (2–4 years) |
| Data quality issues in cargo tracking | –0.4% | Global | Short term (≤ 2 years) |
| Evolving cyber risk on logistics systems | –0.3% | Global | Long term (≥ 4 years) |
Climate volatility catastrophe modelling gaps
Global natural catastrophe losses linked to extreme weather events exceeded an estimated 300–350 billion in economic terms in 2024, with a substantial share tied to disrupted ports, damaged warehouses, and transport infrastructure, yet many logistics insurance portfolios still rely on historical loss curves that underestimate the frequency and severity of clustered events along key trade corridors.
This structural vulnerability forces insurers to apply broad portfolio-level loadings of 5–15% on catastrophe-exposed risks and maintain higher reinsurance cessions, which in turn raises treaty costs by several percentage points of gross premiums and reduces available capacity for high-aggregation locations such as major container hubs.
Quantitatively, the resulting friction drag shows up as conservative growth ceilings insurers cap exposure in certain coastal regions or critical logistics nodes, constrain coverage limits for high-value cargoes during peak seasons, and maintain average combined ratios hovering near or above 100% in some segments, pushing corporate strategies towards long-term investments in advanced climate models, granular geospatial risk scoring, and diversified routing solutions rather than aggressively growing top-line across all geographies.
Opportunities
| Opportunity | (~) % Potential CAGR | Geographic Relevance | Execution Window |
|---|---|---|---|
| Embedded logistics insurance in trade platforms | +1.1% | Global | Medium term (2–4 years) |
| Parametric cover for climate-linked logistics disruptions | +0.9% | Global | Long term (≥ 4 years) |
| Digital marine cargo compliance platforms in emerging markets | +0.7% | Africa, Asia, Latin America | Medium term (2–4 years) |
| Integrated cyber-physical cover for logistics operators | +0.5% | Global | Long term (≥ 4 years) |
| Usage-based micro policies for SMEs | +0.4% | Asia-Pacific, Africa, Latin America | Medium term (2–4 years) |
Embedded logistics insurance in trade platforms
This opportunity represents future white space because most global B2B trade, freight-forwarding, and marketplace platforms still treat insurance as an external process, requiring separate broker interaction and manual document exchange, leaving a sizable portion of logistics flows either uninsured or insured through fragmented, non-standard products with limited data linkage to underlying shipments.
By embedding logistics insurance directly into booking and payment workflows where coverage is auto-quoted using shipment characteristics such as route, mode, cargo type, and declared value, platforms can lower customer acquisition cost per policy by an estimated 30–50% compared with traditional agent-led distribution, while insurers improve loss ratios by 2–4 percentage points through better risk selection and real-time data on transit events.
Unit economics shift as insurers move from annual blanket policies to per-shipment pricing, enabling differentiated margins across cargo classes; logistics operators earn incremental fee income of perhaps 1–3% of freight charges for facilitating coverage, and end customers benefit from streamlined claims processes linked to platform tracking data, which together can justify an incremental CAGR uplift of around 1.1% above the baseline as embedded models scale from pilot programs to mainstream adoption over the next 2–4 years.
Geopolitical Impact Analysis
Geopolitical instability is significantly expanding the range and severity of risks covered by logistics insurance providers. Active military conflicts, protectionist trade policies, and disruptions across major maritime chokepoints are increasing freight costs, transit times, cargo exposure, and insurance premiums.
The Red Sea remains one of the most critical risk areas. According to UNCTAD’s Review of Maritime Transport 2025, global maritime trade growth slowed to only 0.5% in 2025, compared with 2.2% in 2024. Suez Canal container vessel transits declined by 16.7% year-on-year in January 2026, marking the weakest January traffic level in a decade.
Shipping companies have increasingly diverted vessels through the Cape of Good Hope to avoid conflict-related risks. These diversions can add approximately 10 to 18 sailing days and nearly 3,100 nautical miles to each voyage. As a result, per-container freight costs have increased by an estimated 30% to 50%.
The disruption has also created additional insurance charges, including war-risk premiums and Emergency Conflict Surcharges. These charges have reportedly ranged from USD 2,000 to USD 4,000 per container on affected shipping routes. In July 2025, Red Sea war-risk premiums increased from approximately 0.3% to 0.7% of vessel value within one week, while premiums for certain high-risk voyages reached nearly 1.0%. For large commercial vessels, these increases can add hundreds of thousands of dollars to the insured cost of a single journey.
Trade protectionism is creating further uncertainty across the logistics insurance market. During the escalation of US–China trade tensions, US tariffs on selected Chinese imports reached as high as 145%. Retaliatory measures introduced by China, Canada, and the European Union reportedly affected approximately USD 330 billion worth of US exports.
The World Trade Organization initially projected a 0.2% decline in global merchandise trade volumes for 2025. However, the forecast was later revised to 2.4% growth, supported by early shipment activity and increased trade in artificial intelligence-related goods. Despite this revision, continued tariff uncertainty is expected to affect long-term trade flows and import demand.
Cargo security risks have also increased as shipments are redirected through unfamiliar or less-secure routes. BSI’s Supply Chain Risk Insights Report recorded a 56% increase in global supply chain theft incidents during 2025. Higher theft activity, combined with longer routes and multiple cargo transfers, is expected to raise claims frequency and loss severity.
Regional Analysis
North America accounted for 34.21% of the global logistics insurance market in 2025, supported by its large freight transportation network and high insurance adoption. According to the U.S. Bureau of Transportation Statistics (BTS), total U.S. transborder freight with Canada and Mexico reached USD 1.6 trillion in 2025, while freight movement under the USMCA corridor increased 8.2% year-over-year in 2024.
The United States contributes 83.95% of North America’s freight and logistics revenue, creating strong demand for cargo, freight liability, and warehouse insurance. Strict liability regulations, high-value shipments such as electronics, pharmaceuticals, and automotive parts, and advanced risk management practices continue to support premium growth across the region.
Asia-Pacific is expected to record the fastest growth during the forecast period, driven by expanding manufacturing, exports, and e-commerce activities. According to China Customs, China’s exports increased 5.4% year-over-year through November 2025, while India’s Ministry of Commerce reported total goods and services exports of USD 860 billion in FY 2025 to 26, up from USD 825 billion a year earlier. IATA reported that Asia-Pacific airlines achieved 4.1% growth in air cargo demand and 5.1% growth in cargo capacity in October 2025.
In addition, the Asian Development Bank (ADB) projected that the region would account for 61% of global B2C e-commerce by 2025, while UNCTAD reported 9% export growth and 10% growth in intra-regional trade in East Asia over the past four quarters. Rising trade volumes and increasing shipment values are driving greater demand for logistics insurance across the region.
Key Regions and Countries Covered in this Report
North America
- The US
- Canada
Europe
- Germany
- France
- The UK
- Spain
- Italy
- Russia & CIS
- Rest of Europe
APAC
- China
- Japan
- South Korea
- India
- ASEAN
- Rest of APAC
Latin America
- Brazil
- Mexico
- Rest of Latin America
Middle East & Africa
- GCC
- South Africa
- Rest of MEA
Key Players Analysis
Tier-1 Market Leaders
Tier-1 companies maintain a leading position in the logistics insurance market due to their large underwriting capacity, diversified insurance portfolios, global distribution networks, and integrated reinsurance operations.
Allianz SE remains one of the leading companies in the market. In 2025, the group recorded a total business volume of €86.7 billion. Its Property-Casualty segment generated a record operating profit of €9.0 billion, representing an increase of 13.9% year-on-year. The segment also reported a combined ratio of 91.2%, reflecting disciplined risk selection and underwriting across marine, cargo, commercial transport, and logistics insurance operations.
Chubb Limited strengthened its position as one of the world’s largest publicly traded property and casualty insurers. The company generated full-year 2025 revenue of USD 59.4 billion, while net income increased by 11.2% to USD 10.3 billion. Core operating income reached nearly USD 10 billion, supported by strong underwriting performance across commercial property, marine cargo, transportation, and specialty insurance products.
Zurich Insurance Group reported record results in 2025, with Property and Casualty Business Operating Profit exceeding USD 5 billion for the first time. The group’s total operating profit increased by 22% year-on-year to USD 8.9 billion, while its P&C combined ratio stood at 93.1%. The company’s broad commercial insurance network supports logistics companies, freight operators, manufacturers, and international trading businesses.
Munich Re generated insurance revenue of €60.4 billion in 2025. Its property and casualty reinsurance net result increased to €3.3 billion, strengthening its capacity to provide cargo, marine, freight, and transportation reinsurance coverage. The company plays an important role in supporting the risk capacity of primary logistics insurers worldwide.
Tokio Marine Holdings increased net premiums written by 10% to approximately JPY 5.3 trillion, equivalent to nearly USD 36 billion. Its insurance subsidiaries operate across 46 countries, enabling the company to maintain a strong position in Asia-Pacific and provide cross-border marine, cargo, and logistics insurance solutions.
Tier-2 Market Challengers
Tier-2 companies are gaining market share through improved underwriting performance, commercial insurance expansion, specialized product development, and targeted investments in transportation and logistics-related coverage.
The Travelers Companies reported full-year 2025 revenue of USD 48.8 billion, representing growth of 5% year-on-year. The company generated an underwriting gain of USD 4.3 billion, while its combined ratio improved by 2.6 percentage points to 89.9%, one of the strongest ratios among major insurers. Travelers also recorded operating cash flow of USD 10.6 billion, supporting further expansion across commercial transportation and logistics-related insurance products.
AXA XL, the commercial and specialty insurance division of AXA Group, contributed to the group’s commercial lines gross written premiums of €35.8 billion in 2025, representing an increase of 4% year-on-year. AXA XL continued to maintain attractive underwriting margins while serving multinational companies across marine cargo, freight forwarding, supply chain, warehousing, and commercial transportation sectors.
American International Group, Inc. (AIG) recorded full-year 2025 underwriting income of USD 2.3 billion, increasing by 22% year-on-year. Its General Insurance combined ratio improved to 88.8%, while General Insurance pre-tax income increased by 44% year-on-year during the third quarter of 2025. The improvement was supported by stronger underwriting discipline across commercial property, marine, transportation, and cargo-related insurance operations.
The Major Players in the Industry
- Allianz SE
- AXA XL (AXA Group)
- Zurich Insurance Group
- AIG (American International Group)
- Chubb Ltd.
- Tokio Marine Holdings
- The Travelers Companies, Inc.
- Munich Re
- RSA Insurance Group
- Liberty Mutual Insurance
- Other Key Players
Key Development
- In October 2025, Tokio Marine Holdings continued its plan through 2026 to invest more than USD 10 billion in international acquisitions. The strategy is supported by the planned sale of cross-shareholdings valued at approximately USD 25 billion.
- In August 2025, Arthur J. Gallagher & Co. completed the acquisition of AssuredPartners for USD 13.45 billion, marking the largest acquisition of a U.S. insurance broker. AssuredPartners generated approximately USD 2.9 billion in annual revenue and strengthened Gallagher’s capabilities in commercial property, casualty, transportation, cargo, freight, and trucking insurance, expanding its presence in the U.S. middle-market logistics sector.
- In December 2025, Helvetia Holding Ltd and Baloise Holding Ltd completed their merger to establish Helvetia Baloise Holding Ltd. The combined company has a business volume of approximately CHF 20 billion across eight countries and was valued at around CHF 18.1 billion (USD 22.4 billion) at the time of announcement.
Report Scope
| Report Features | Description |
|---|---|
| Market Value (2025) | USD 63.5 Bn |
| Forecast Revenue (2035) | USD 84.9 Bn |
| CAGR (2026 to 2035) | 3.0% |
| Base Year for Estimation | 2025 |
| Historic Period | 2020 to 2024 |
| Forecast Period | 2026 to 2035 |
| Report Coverage | Revenue Forecast, Market Dynamics, Competitive Landscape, Recent Developments |
| Segments Covered | By Insurance Type (Land Cargo Insurance, Marine Cargo Insurance and Air Transport Insurance), By Coverage Type (Cargo Insurance, Carrier/Freight Liability Insurance, Warehouse/Storage Insurance and Ancillary and Cyber Coverages), By End User (Individual and Enterprises) |
| Regional Analysis | North America – The US & Canada; Europe – Germany, France, The UK, Spain, Italy, Russia & CIS, Rest of Europe; APAC- China, Japan, South Korea, India, ASEAN & Rest of APAC; Latin America- Brazil, Mexico & Rest of Latin America; Middle East & Africa- GCC, South Africa, & Rest of MEA |
| Competitive Landscape | Allianz SE, AXA XL (AXA Group), Zurich Insurance Group, AIG (American International Group), Chubb Ltd., Tokio Marine Holdings, The Travelers Companies, Inc., Munich Re, RSA Insurance Group, Liberty Mutual Insurance and Other Key Players |
| Customization Scope | Customization for segments and region/country-level will be provided. Moreover, customization can be tailored to the requirements. |
| Purchase Options | We have three licenses to opt for: Single User License, Multi-User License (Up to 5 Users), Corporate Use License (Unlimited Users and Printable PDF) |





































