


Report Overview
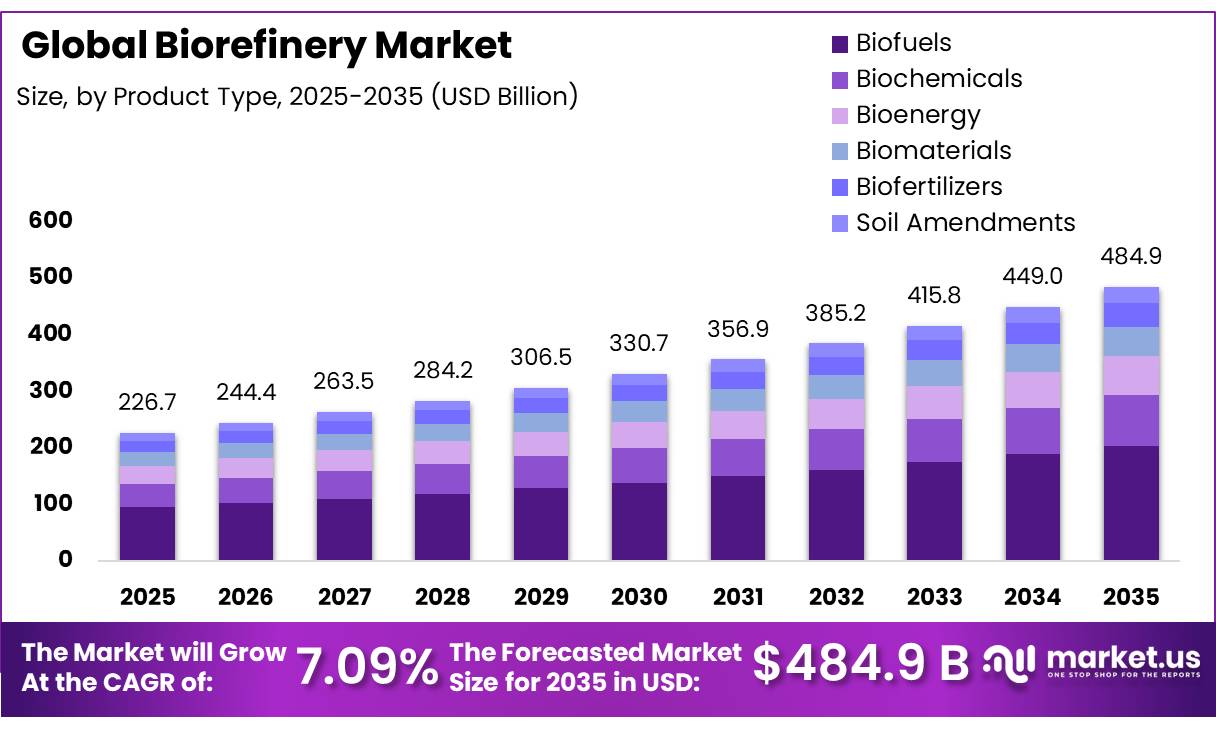
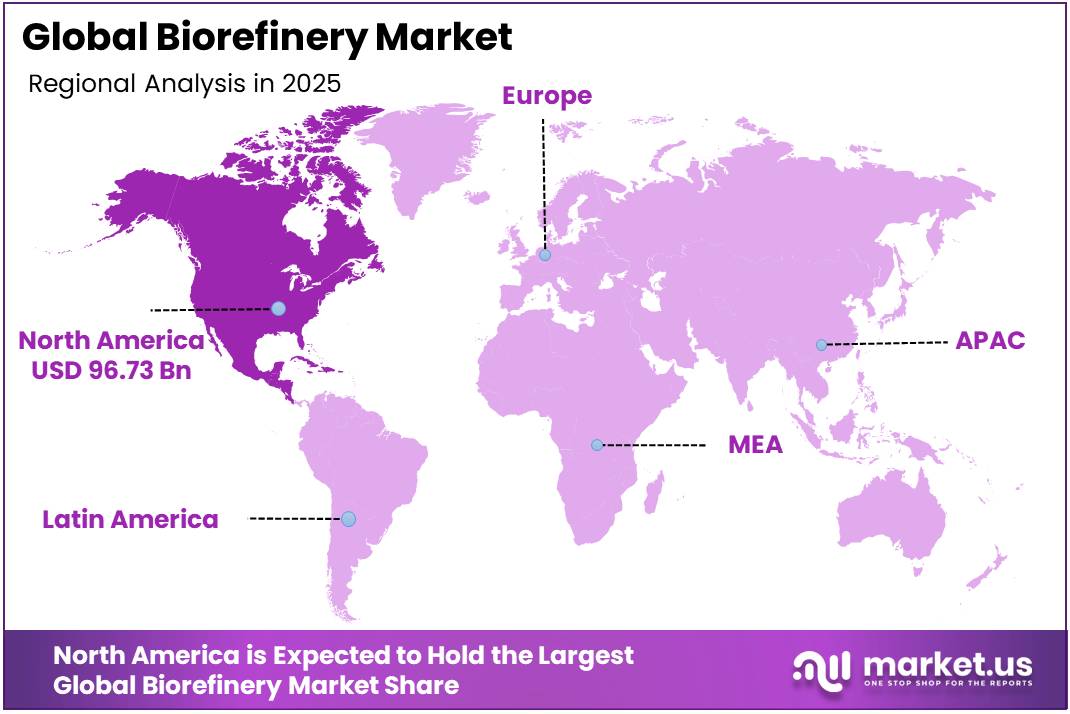
In 2025, the Global Biorefinery Market was valued at USD 226.7 billion, and between 2026 and 2035, this market is estimated to register a CAGR of 7.09%, reaching about USD 484.9 billion by 2035. North America held a dominant market position, capturing more than a 42.7% share, holding USD 96.73 billion in revenue.
The biorefinery market is developing as an integrated industrial platform that converts biomass, agricultural residues, organic waste, and renewable carbon into fuels, chemicals, energy, fertilizers, and materials.
- In September 2025, the United States Energy Information Administration recorded 19 renewable diesel and other biofuel plants with annual production capacity of 4,719 million gallons, equal to 308 thousand barrels per day. This installed base shows that commercial bio-processing infrastructure is moving beyond conventional ethanol facilities.
Key Takeaways
- The global biorefinery market was valued at USD 226.7 billion in 2025.
- The global biorefinery market is projected to grow at a CAGR of 7.09% and is estimated to reach USD 484.9 billion by 2035.
- On the basis of product, the biofuels segment dominated the market, constituting 42.1% of the total market share.
- Based on the application, energy production dominated the biorefinery market, with a substantial market share of around 64.34%.
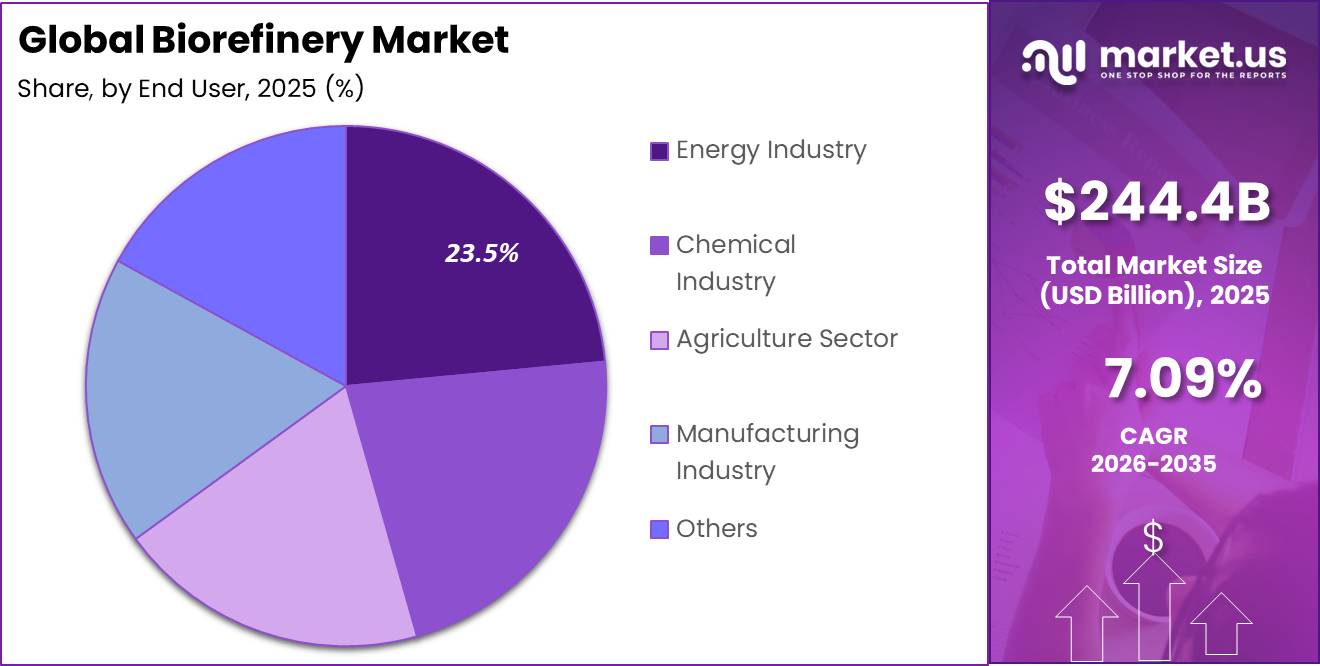
- Among the end users, the energy industry held a major share in the biorefinery market, accounting for 23.5% of the market share.
- In 2025, North America was the most dominant region in the biorefinery market, accounting for 42.67% of the total global market revenue.
Demand is being supported by aviation decarbonization, fuel security, waste utilization, and corporate interest in renewable feedstocks. In May 2025, the United States Energy Information Administration reported sustainable aviation fuel capacity of around 30,000 barrels per day. Other biofuels production reached 33,000 barrels per day in January 2025 and increased to 44,000 barrels per day in February. These gains encourage biorefineries to combine fuel output with higher-value chemical co-products and renewable intermediates.
Government support is reducing technical risk during scale-up. In January 2025, the United States Department of Energy announced 12 million dollars through its Bioenergy Technologies Office to advance integrated biorefineries producing low-carbon biofuels and biochemicals. The programme targets demonstration activities using biomass and waste resources, helping developers validate connected processing stages before commercial construction. Such funding addresses capital intensity, process integration, feedstock variability, and uncertainty surrounding consistent product quality at industrial volumes.
Europe also presents strong opportunities for multi-product facilities. In April 2026, the Circular Bio-based Europe Joint Undertaking opened a 170.7 million euro funding call. It allocated 20 million euros to biotechnology that improves biorefinery competitiveness, 14 million euros to chemicals and materials from woody residues, and 6.5 million euros to separation and purification challenges. These priorities create room for advanced fermentation, efficient recovery systems, plant retrofits, circular packaging inputs, agricultural products, and specialized biomaterials across established economies and emerging regional value chains worldwide.
Product Analysis
Biofuels leads with 42.1% while Biochemicals gains industrial use
In 2025, Biofuels held a dominant market position, capturing more than a 42.1% share. Their leadership was supported by established ethanol, renewable diesel, sustainable aviation fuel, and biogas routes. Biorefineries can process agricultural residues, used oils, forestry materials, and organic waste into fuels for transport, power generation, and industrial heating. Existing distribution systems, policy support, and demand for lower-carbon fuel alternatives also kept biofuels at the centre of commercial biorefinery investment.
- For instance, in March 2025, according to the Circular Bio-based Europe Joint Undertaking, construction began on the SUSTAINEXT biorefinery in Spain to convert medicinal plants and agricultural side streams into ingredients for chemicals, fertilizers, food, feed, and cosmetics.
Biochemicals represent the growing segment as manufacturers seek renewable substitutes for petroleum-based acids, solvents, polymers, resins, and functional ingredients. This segment benefits from higher-value applications and allows operators to use sugars, lignin, oils, and fermentation intermediates efficiently. Interest from packaging, personal care, agriculture, and specialty chemical producers is encouraging flexible facilities that manufacture several products from one biomass stream.
Application Analysis
Energy Production dominates with 64.34% as biorefineries prioritize renewable fuels and reliable power
In 2025, Energy Production held a dominant market position, capturing more than a 64.34% share. Its leadership was supported by the broad use of biomass, agricultural residues, organic waste, and renewable oils for producing transport fuels, electricity, heat, and biogas. Energy-focused biorefineries also benefit from established fuel distribution networks and growing demand for alternatives to fossil resources. Their ability to generate several energy products from one feedstock stream strengthens operating efficiency and supports commercial-scale investment.
- For instance, in August 2025, according to Avantium N.V., the company successfully started the sugar dehydration unit and supporting systems at its furan dicarboxylic acid flagship plant in Delfzijl, advancing renewable feedstock conversion for plant-based chemical production.
Chemical Production is the growing segment as manufacturers seek renewable inputs for polymers, solvents, resins, coatings, and specialty ingredients. Biorefineries can recover sugars, lignin, oils, and fermentation intermediates that would otherwise remain underused. This supports higher-value output, wider feedstock utilization, and closer integration between agriculture, waste processing, and chemical manufacturing.
End User Analysis
Energy Industry leads with 23.5% while Chemical Production gains wider adoption
In 2025, Energy Industry held a dominant market position, capturing more than a 23.5% share. The segment remained the largest end user because biorefineries supply ethanol, renewable diesel, biogas, sustainable aviation fuel, electricity, and process heat. Energy companies are integrating biomass and waste-based feedstocks to diversify fuel supplies, lower dependence on petroleum, and support cleaner transport and power systems. Established fuel infrastructure and long-term demand for renewable energy also strengthen commercial investment in large biorefinery facilities.
- For instance, in April 2025, according to Braskem, the company partnered with Fitesa to introduce bio-based polyethylene into nonwoven products, expanding the commercial use of renewable chemical materials.
Chemical Production is the growing segment as producers increasingly use biomass-derived sugars, oils, lignin, and fermentation outputs to manufacture polymers, solvents, resins, coatings, and specialty ingredients. Its growth is supported by demand for renewable feedstocks, improved processing technologies, and the ability of integrated biorefineries to produce higher-value chemicals alongside fuels.
Key Market Segments
Product
- Biofuels
- Biochemicals
- Bioenergy
- Biomaterials
- Biofertilizers
- Soil Amendments
Application
- Energy Production
- Chemical Production
- Agriculture
- Materials Manufacturing
- Others
End User
- Energy Industry
- Chemical Industry
- Agriculture Sector
- Manufacturing Industry
- Others
Driver Analysis
Tightening decarbonization and fuel blending mandates
From 2024–2026, regulatory tightening around renewable fuel quotas and blending mandates has moved from incremental to structural, directly lifting biorefinery throughput and revenue visibility; the U.S. EPA’s finalized Renewable Fuel Standard volumes for 2026–2027 raise required cellulosic and biomass-based diesel volumes into the 1.3–1.4 billion gallon equivalent range for cellulosic and over 9 billion gallon equivalent for biomass-based diesel, reallocating roughly 70% of small refinery exemptions from 2023–2025 back into the system, which materially expands obligated demand for advanced biorefineries.
In parallel, the EU’s Renewable Energy Directive III (RED III) targets a sizable increase in renewable transport energy share toward 2030 (e.g., member states like Finland moving biofuel shares from the high‑teens to roughly 30% of transport fuels), while India, the Philippines, Indonesia and Vietnam have locked in staged blending targets: India’s compressed biogas blending moves from 1% in 2025–26 to 5% by 2028–29, the Philippines raises biodiesel from 2% to 5% by October 2026, and Indonesia’s biodiesel mandate steps from B40 to B50 by late 2026.
These statutory volumetric ramps shift biorefinery business models from speculative commodity exposure to largely contracted or mandated off‑take, increasing capacity utilization, reducing revenue cyclicality, and supporting long‑dated project finance at lower cost of capital; in unit economic terms, producers can underwrite new plants assuming 80–90% utilization against policy‑driven demand instead of 50–60% utilization, which materially improves internal rates of return and justifies expansion capex cycles that add an estimated 2 percentage points to market CAGR over the forecast horizon.
Drivers Impact Analysis
| Driver | (~) % Impact on CAGR | Geographic Relevance | Impact Timeline |
|---|---|---|---|
| Tightening decarbonization and fuel blending mandates | +2.0% | North America core, EU, India, ASEAN | Medium term (2–4 years) |
| Feedstock sustainability, deforestation bans and ESG capital pressure | +1.5% | EU, Latin America, APAC corridors | Long term (≥ 4 years) |
| Cost-down from advanced conversion and process intensification | +1.3% | North America, EU, APAC industrial hubs | Medium term (2–4 years) |
| Expansion of biochemicals, biomaterials and bioplastics demand | +1.0% | EU, North America, East Asia | Long term (≥ 4 years) |
| Energy security and domestic biofuel independence strategies | +0.9% | India, Indonesia, Middle East, Brazil | Medium term (2–4 years) |
| Industrial decarbonization and hard-to-abate sectors (SAF, marine fuels) | +0.8% | OECD economies, global aviation and shipping corridors | Long term (≥ 4 years) |
Restraint Analysis
High capex and financing risk
Biorefineries remain structurally capital‑intensive assets, with early‑stage engineering literature indicating that full‑scale advanced biorefineries routinely require total installed capital in the mid‑hundreds of millions of USD often 30–60% higher per unit of nameplate output than comparable fossil fuel plants due to complex pretreatment, fermentation, separation and utilities blocks, large equipment footprints and extensive solvent handling systems, meaning first‑of‑a‑kind facilities can exceed 4,000–6,000 USD per annual ton of capacity and carry payback periods stretching beyond 10–12 years under conservative utilization assumptions.
In the post‑COVID and high‑rate environment of 2024–2026, real project finance costs have risen 150–250 basis points versus pre‑2020 levels, with lenders applying additional risk premia to novel biorefinery technologies; that pushes weighted average cost of capital for many projects into low‑double‑digit territory, compressing net present values and forcing developers to either seek higher offtake prices, longer contracts, or greater public support.
Strategically, the combination of high upfront capex, long construction schedules, and uncertain long‑term policy trajectories pushes sponsors to slow down deployment, prioritize brownfield conversions or modular expansions over greenfield mega‑plants, and defer investments until financing costs normalize or additional subsidies are secured; this financing friction effectively trims around 2 percentage points from the biorefinery market’s potential CAGR by constraining the pace at which new capacity comes online and by increasing hurdle rates for marginal projects, particularly in North America, Europe and emerging APAC markets.
Restraint Impact Analysis
| Restraint | (~) % Impact on CAGR | Geographic Relevance | Impact Timeline |
|---|---|---|---|
| High capex and financing risk | -2.0% | North America core, EU, emerging APAC | Long term (≥ 4 years) |
| Feedstock price volatility and competition | -1.5% | EU, APAC corridors, Latin America | Medium term (2–4 years) |
| Biomass logistics, seasonality and storage limits | -1.2% | EU rural, Brazil, India, ASEAN | Long term (≥ 4 years) |
| Policy uncertainty and uneven bioenergy targets | -0.9% | North America, parts of Asia, Africa | Medium term (2–4 years) |
| Fossil fuel price swings eroding competitiveness | -0.8% | Global OECD fuel markets | Short/medium term (≤ 4 years) |
| Technology scale-up, yield and reliability gaps | -0.7% | Global pilot and demo plants | Long term (≥ 4 years) |
Opportunity Analysis
Multiproduct microalgae and seaweed biorefineries
This opportunity goes beyond current biofuel‑centric drivers by building industrial microalgae and seaweed biorefineries that fully valorize biomass into food, feed, cosmetics and specialty chemicals rather than low‑value energy alone, addressing a white space where today up to 70–95% of algal or seaweed biomass is still discarded or downgraded into low‑margin uses.
Modeling based on published value‑chain design work shows that carefully engineered multiproduct chains can lift biomass utilization from sub‑30% levels to over 90%, converting a 10 kton/year algae plant from relying on bulk fuel revenues in the 400–800 USD/ton range to a portfolio where 20–30% of output sells into high‑value markets at 5,000–10,000 USD/ton, another 20–30% into mid‑value feed and food at 1,500–3,000 USD/ton, and the remainder into energy and materials.
This creates an untapped TAM in coastal EU, North American and East Asian regions where existing aquaculture and wastewater facilities produce large algal streams that are not yet integrated with advanced biorefinery platforms; if even 5–10% of current algae and seaweed flows were captured into such integrated plants by 2030, we estimate incremental segment revenues in the tens of billions of USD globally and EBITDA margin uplift from low‑teens to mid‑twenties percent, adding roughly 2 percentage points to overall biorefinery CAGR as new entrants and incumbents pivot into these premium chains, which are currently underrepresented in baseline driver models.
Opportunity Impact Analysis
| Opportunity | (~) % Potential CAGR Upside | Geographic Relevance | Execution Window |
|---|---|---|---|
| Multiproduct microalgae and seaweed biorefineries | +2.0% | EU coastal, North America, East Asia | Medium term (2–4 years) |
| Urban waste-to-bioproduct and circular city models | +1.8% | North America core, EU metros, APAC mega-cities | Medium term (2–4 years) |
| High-value, low-volume biochemicals and ingredients | +1.5% | EU, North America, Japan, South Korea | Long term (≥ 4 years) |
| Modular decentralized biorefinery units for emerging markets | +1.3% | APAC emerging, Africa, Latin America | Medium/long term (2–6 years) |
| Integrated carbon services and value-chain platforms | +1.2% | EU, North America, global multinationals | Medium term (2–4 years) |
| Consumer-facing bioproduct brands and D2C channels | +1.0% | EU, North America, China | Long term (≥ 4 years) |
Challenges Analysis
Margin volatility and feedstock cost swings
Margin volatility rooted in feedstock cost swings and product price pressure is an ongoing friction rather than a hard restraint, because plants continue to operate but with compressed profitability and heightened risk; recent company results underscore this pattern, with one Indian biorefinery reporting revenue growth from roughly 5.23 billion to 5.6 billion rupees year‑on‑year while EBITDA collapsed from about 47 million to 5 million rupees and EBITDA margins narrowed from 0.9% to 0.1%, illustrating how adverse feedstock and product spreads can erase nearly all operating margin despite top‑line expansion.
In Europe, biofuel commentary in 2026 points to tight margins following several years of high feedstock costs and to shifting capacity from SAF to HVO as imported SAF particularly from China compresses price spreads, forcing producers to continuously rebalance product mix to avoid sub‑economic segments. Operationally, UCO, waste fats and residues can move 20–30% in price within a year, and product benchmarks can be undercut by imported volumes or fossil fuel price dips, leaving plants with quarterly EBITDA swings of several percentage points and making it difficult to sustain investment plans.
Quantitatively, this margin volatility is estimated to impose about a 1.5 percentage point drag on otherwise achievable CAGR by tempering capex commitments and forcing operators to prioritize financial resilience over maximum growth.
Challenges Impact Analysis
| Challenge | (~) % CAGR Friction | Geographic Relevance | Mitigation Horizon |
|---|---|---|---|
| Margin volatility and feedstock cost swings | -1.5% | EU regulatory hubs, North America core, APAC corridors | Medium term (2–4 years) |
| Complex biofuel supply chain design and coordination | -1.2% | EU, Brazil, India, ASEAN logistics corridors | Long term (≥ 4 years) |
| Infrastructure and industrial integration gaps | -1.0% | Emerging APAC, Africa, Latin America | Long term (≥ 4 years) |
| Green skills and operations talent shortage | -1.0% | EU, North America, global renewable clusters | Medium/long term (2–6 years) |
| Technology reliability and process complexity | -0.8% | Global biorefinery fleets | Long term (≥ 4 years) |
| Geopolitical and energy market volatility | -0.7% | Global trade lanes, EU & Asia fuel markets | Medium term (2–4 years) |
Geopolitical Impact Analysis
Trade Defence and Certification Rules Redirecting Biorefinery Supply Chains
Geopolitical competition is reshaping the biorefinery market through biodiesel trade remedies, stricter sustainability checks, and attention to domestic renewable fuel capacity. These changes affect the movement of feedstocks and finished biofuels, while encouraging producers to review sourcing, certification, and investment locations across Europe, China, and the United Kingdom.
In February 2025, the European Commission imposed definitive anti-dumping duties ranging from 10% to 35.6% on biodiesel imported from China. The measure covers a European Union biodiesel industry valued at €25 billion annually, supporting nearly 6,000 jobs across more than 60 producers in 18 Member States. Sustainable aviation fuel was excluded, creating different trade conditions across biorefinery output categories.
The United Kingdom followed a similar path in November 2025. The Department for Business and Trade introduced five-year duties effective from 25 November 2025, setting a 14.79% rate for listed and cooperating exporters and 54.64% for other exporters. Sustainable aviation fuel again received a zero rate, which may redirect Chinese supply toward aviation fuel while tightening competition in road-fuel markets.
Certification has become another geopolitical pressure point. In July 2025, the European Commission identified systemic weaknesses in audits covering Chinese biodiesel imports and planned stronger rules for early 2026. These actions support regional biorefinery investment and traceability, but they also increase compliance costs, documentation requirements, and qualification periods for sourced biomass and waste-based feedstocks.
Regional Analysis
North America Held the Largest Share of the Global Biorefinery Market.
In 2025, North America dominated the global biorefinery market, accounting for 42.7% of the total market share. The region’s leadership can be attributed to the presence of a well-established biofuel industry, favorable renewable energy policies, and abundant availability of biomass feedstocks derived from agricultural and forestry activities.
The United States continues to play a pivotal role in regional growth owing to its advanced biorefinery infrastructure, increasing investments in next-generation biofuel technologies, and strong emphasis on reducing dependence on conventional fossil fuels. Additionally, growing initiatives aimed at supporting sustainable aviation fuels, renewable diesel production, and low-carbon industrial processes have reinforced the adoption of biorefinery products across the region.
- According to the U.S. Energy Information Administration (EIA) in February 2025, the United States continued to demonstrate strong fuel ethanol production capacity, with output averaging more than 1 million barrels per day. Supported by an established renewable fuel ecosystem and extensive production infrastructure, the country remains one of the world’s leading producers of fuel ethanol, reinforcing its role in global biofuel markets
Key Regions and Countries Covered
- North America
- The US
- Canada
- Europe
- Germany
- France
- The UK
- Spain
- Italy
- Russia & CIS
- Rest of Europe
- APAC
- China
- Japan
- South Korea
- India
- ASEAN
- Rest of APAC
- Latin America
- Brazil
- Mexico
- Rest of Latin America
- Middle East & Africa
- GCC
- South Africa
- Rest of MEA
Key Players Analysis
The global biorefinery market features established biofuel producers, biotechnology firms, enzyme manufacturers, and integrated developers competing to enhance their bio-based value chain capabilities. Key focus areas include feedstock flexibility, biomass conversion efficiency, and product diversification. The shift toward integrated biorefinery models for producing biofuels, biochemicals, and biomaterials intensifies competition among traditional energy and biotech companies. Strategic partnerships with agricultural stakeholders and research institutions are crucial for securing sustainable feedstock and technology commercialization.
Biorefinery companies are implementing capacity expansions, technological innovations, strategic partnerships, and investments in advanced platforms to meet sustainable product demand. Focus on circular economy and low-carbon development drives investment in feedstock processing and biomass conversion technologies. Additionally, firms are expanding geographically and enhancing research and development to leverage opportunities in renewable fuels and bio-based chemicals.
Market Key Players
- POET-DSM Advanced Biofuels, LLC
- Novozymes A/S
- Avantium N.V.
- LanzaTech Global, Inc.
- Amyris, Inc.
- Clariant AG
- Braskem S.A.
- Green Plains Inc.
- Virent, Inc.
- Enerkem Inc.
- ADM
- Valero
Key Development
- In January 2026, LanzaTech Global, Inc. selected Saltend Chemicals Park in the United Kingdom as the proposed site for its DRAGON II project, supporting commercial production of sustainable aviation fuel and renewable diesel from recycled carbon.
- In January 2026, Braskem S.A. introduced its new Medcol VV7040 bio-based low-density polyethylene grade for healthcare packaging, designed for blow-fill-seal processing and compliance with pharmaceutical requirements.
- In July 2026, Avantium N.V. partnered with Casa da Malha and Lacatoni to develop textile and sportswear prototypes using plant-based and recyclable polyethylene furanoate materials.
Report Scope
| Report Features | Description |
|---|---|
| Market Value (2025) | USD 226.7 Bn |
| Forecast Revenue (2035) | USD 484.9 Bn |
| CAGR (2026-2035) | 7.09% |
| Base Year for Estimation | 2025 |
| Historic Period | 2020-2024 |
| Forecast Period | 2026-2035 |
| Report Coverage | Revenue Forecast, Market Dynamics, Competitive Landscape, Recent Developments |
| Segments Covered | By Product (Biofuels, Biochemicals, Bioenergy, Biomaterials, Biofertilizers, and Soil Amendments), By Application (Energy Production, Chemical Production, Agriculture, Materials Manufacturing, and Others), By End User (Energy Industry, Chemical Industry, Agriculture Sector, Manufacturing Industry, and Others) |
| Regional Analysis | North America – The US & Canada; Europe – Germany, France, The UK, Spain, Italy, Russia & CIS, Rest of Europe; APAC– China, Japan, South Korea, India, ASEAN & Rest of APAC; Latin America– Brazil, Mexico & Rest of Latin America; Middle East & Africa– GCC, South Africa, & Rest of MEA |
| Competitive Landscape | POET-DSM Advanced Biofuels, LLC, Novozymes A/S, Avantium N.V., LanzaTech Global, Inc., Amyris, Inc., Clariant AG, Braskem S.A., Green Plains Inc., Virent, Inc., Enerkem Inc., ADM, and Valero. |
| Customization Scope | Customization for segments, region/country-level will be provided. Moreover, additional customization can be done based on the requirements. |
| Purchase Options | We have three licenses to opt for: Single User License, Multi-User License (Up to 5 Users), Corporate Use License (Unlimited Users and Printable PDF) |





































