


Report Overview
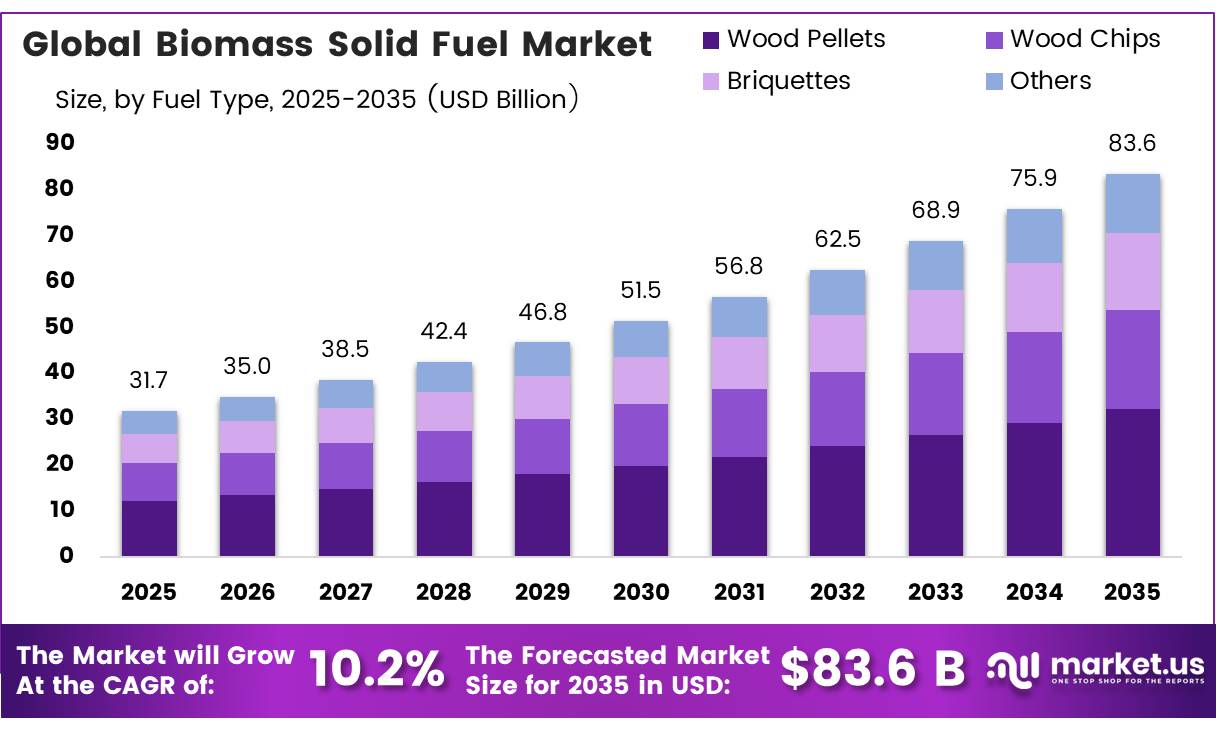
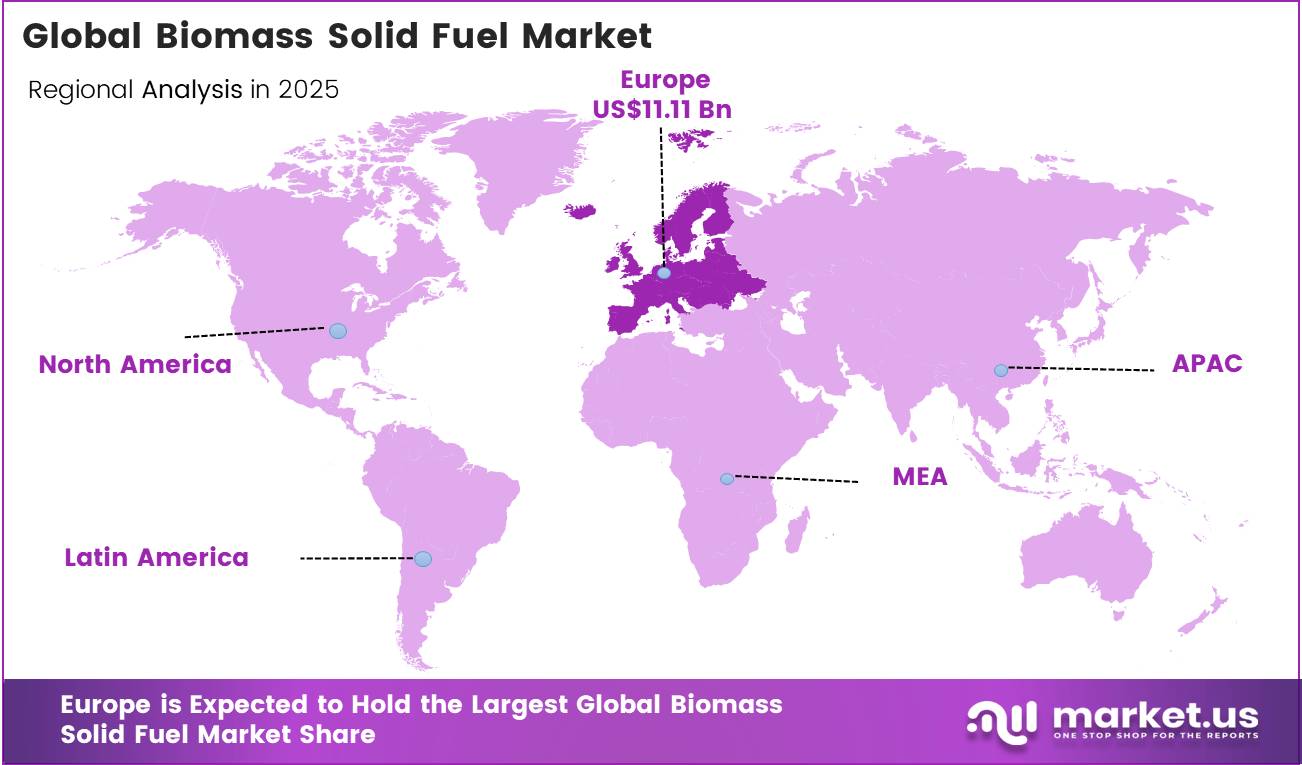
In 2025, the Global Biomass Solid Fuel Market was valued at USD 31.7 billion, and between 2026 and 2035, this market is estimated to register a CAGR of 10.2%, reaching about USD 83.6 billion by 2035. In 2025, Europe held a dominant market position, capturing more than a 35.0% share, holding USD 11.11 Billion revenue.
Biomass solid fuel is an energy category covering wood pellets, briquettes, chips, fuelwood, charcoal, agricultural residues, and solid biogenic materials used for heating, steam, electricity, and process energy. Compared with loose residues, densified fuels offer consistent moisture, energy density, storage, and transport characteristics, supporting use in utility boilers, combined heat and power plants, district-heating systems, and manufacturing.
- In the United States, EIA data show that wood-pellet exports reached approximately 9.4 million tons in 2025. The industrial sector represented about 68% of U.S. wood and wood-waste energy consumption, reflecting demand from paper, wood-products, and process-heat operations.
- According to the IEA, total final energy consumption reached over 450 EJ in 2024, with industry representing nearly 40% of this demand, the largest share among all end-use sectors. Within this industrial energy mix, renewable sources, led substantially by bioenergy, accounted for 12% of global industrial heat consumption in 2024. According to the IEA, with nearly 80% of overall renewable heat growth attributed to bioenergy use in industry.
- The IEA further projects that industrial heat demand will expand by 14%, or 16 EJ, globally between 2025 and 2030, with the renewable share of industrial heat rising to 16% by 2030.
In the United States, biomass accounted for about 5% of total energy consumption in 2025, equivalent to nearly 4,853 trillion British thermal units, according to the U.S. Energy Information Administration, with the industrial sector recording the highest biomass consumption share that year. The U.S. also exported approximately 9.4 million tons of wood fuel pellets in 2025, reflecting solid biomass’s growing role as a globally traded industrial fuel supported by decarbonization policy.
Key Takeaways
- The global Biomass Solid Fuel market was valued at USD 31.7 billion in 2025.
- The global market is projected to grow at a CAGR of 10.2% and is estimated to reach USD 83.6 billion by 2035.
- On the basis of By Fuel Type, Wood Pellets dominated the market, constituting 38.50% of the total market share.
- Based on the Feedstock, the Woody Biomass dominated the Biomass Solid Fuel market, with a substantial market share of around 61.50%.
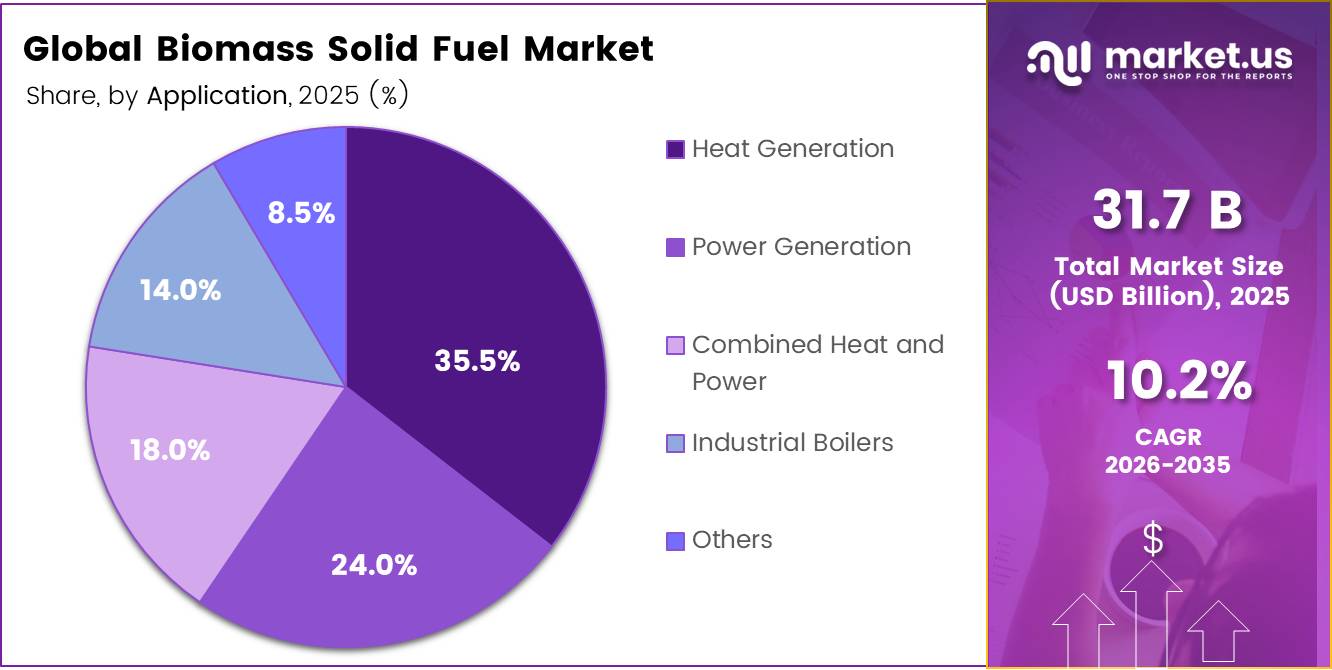
- Based on the Application, Heat Generation led the market, comprising 35.5% of the total market.
- Among the end-use industry, the Industrial held a major share in the Biomass Solid Fuel market, 30.50% of the market share.
- Among the Distribution Channel, the Fuel Supply Contracts is the most considerable within the market, accounting for around 30.0% of the revenue.
- In 2025, the Europe was the most dominant region in the Biomass Solid Fuel market, accounting for 35.0% of the total global consumption.
Fuel Type Analysis
Wood Pellets represents dominant Segment in the Market.
Wood pellets clearly lead this segment, holding a commanding 38.50% share, and government data reflect the scale of manufacturing behind that dominance. In April 2026, according to the U.S. Energy Information Administration, the country’s densified biomass fuel sector included 71 operating manufacturers with a combined production capacity of 12.99 million tons per year. Backed by steady industrial and export demand, wood pellets remain the most established and widely produced format within the processed biomass fuel space.
Wood chips, meanwhile, are the fastest-growing segment, gaining traction as an accessible, lower-cost fuel for industrial heat and power generation. In May 2026, according to the U.S. Energy Information Administration, wood and wood waste, which includes wood chips, accounted for about 2% of total U.S. annual energy consumption in 2025. This growing utilization reflects wood chips’ expanding role as a flexible, readily available fuel source across both industrial and utility-scale applications.
Feedstock Analysis
Woody Biomass a significant feedstock.
Woody biomass remains the clear market leader among feedstock types, holding a dominant 61.50% share. This strength is rooted in its long-established role in industrial process heat, and government data reflect this concentration well: according to the U.S. Energy Information Administration, the industrial sector accounted for about 68% of total U.S. wood and wood waste consumption in 2025, driven largely by wood product and paper manufacturers using mill residues to generate steam and electricity for their own operations. This steady industrial reliance keeps woody biomass firmly anchored at the core of the feedstock landscape.
Agricultural residues are emerging as the fastest-growing feedstock category, supported by expanding federal mandates for cellulosic biofuel production, which draws heavily on corn stover, wheat straw, and other crop residues. According to the U.S. Environmental Protection Agency’s final Renewable Fuel Standard rule, the cellulosic biofuel volume requirement is set to rise from 1.21 billion RINs in 2025 to 1.36 billion in 2026, reaching 1.43 billion in 2027. This steady regulatory push signals growing federal support for converting agricultural residues into usable, renewable energy in the years ahead.
Application Analysis
Heat Generation Are the Most Widely Used Applications.
Heat generation clearly leads the applications segment, commanding a substantial 35.5% share, and reflects biomass’s long-standing role in industrial and process heat. In October 2025, according to the International Energy Agency, renewable heat consumption is projected to expand by more than 42%, or 12 EJ, globally between 2025 and 2030, with bioenergy remaining by far the largest renewable heat source and meeting around 11% of global industrial heat demand over that period. This scale keeps heat generation firmly at the center of biomass’s application landscape.
Power generation, meanwhile, continues to expand its footprint within the broader renewable electricity mix, even as bioenergy’s growth pace has moderated recently. In October 2025, according to the IEA, bioenergy for power capacity additions totaled 4.2 GW in 2024, the lowest level since 2008, even as overall global renewable electricity generation is projected to rise 60% by 2030.
End Use Analysis
Biomass Solid Fuels Are Mostly Utilized in the Industrial Sector.
The industrial sector, accounting for 31.0% of the biomass solid fuel market, represents the largest end-use segment due to its continuous demand for renewable process heat, steam generation, and fuel substitution in energy-intensive industries such as cement, pulp & paper, food processing, and chemicals. Industrial operators are increasingly replacing fossil fuels with biomass pellets, briquettes, and other solid biofuels to meet decarbonization targets while improving energy security.
In April 2026, according to the European Environment Agency (EEA), renewable energy reached 25.2% of the European Union’s final energy consumption in 2024, with solid, gaseous, and liquid biomass collectively remaining the largest renewable energy category, reinforcing biomass solid fuels’ importance in industrial heating applications.
The power utilities segment is the fastest-growing application as utilities diversify renewable electricity portfolios and strengthen grid reliability through dispatchable biomass generation. In 2025, according to the U.S. Energy Information Administration (EIA), biomass generated about 4% of U.S. utility-scale renewable electricity, demonstrating its continued contribution alongside expanding renewable power systems and supportive clean energy policies
Distribution Channel Analysis
Biomass Solid Fuels Are Mostly Utilized in the fuel supply contracts.
The fuel supply contracts segment, accounting for 30.0% of the biomass solid fuel market, leads the distribution landscape as long-term procurement agreements ensure secure fuel availability, price stability, and uninterrupted deliveries for utilities and industrial consumers. Contract-based purchasing also supports investment in pellet manufacturing and logistics infrastructure by providing predictable demand. In December 2025, according to the U.S. Energy Information Administration (EIA), the United States had 73 operating densified biomass fuel manufacturing facilities with a combined annual production capacity of 12.91 million tons, highlighting the scale of supply infrastructure that supports long-term contractual procurement.
The direct sales segment is expanding as biomass producers increasingly engage directly with industrial users and commercial buyers to improve supply transparency, reduce intermediary costs, and offer customized delivery schedules. This approach is becoming more attractive as biomass production capacity continues to expand. In December 2025, according to the U.S. Energy Information Administration (EIA), manufacturers produced 0.90 million tons and sold 0.97 million tons of densified biomass fuel during December 2025, reflecting strong market activity that supports direct supplier-to-customer transactions.
Key Market Segments
By Fuel Type
- Wood Pellets
- Wood Chips
- Briquettes
- Others
By Feedstock
- Woody Biomass
- Agricultural Residues
- Animal-Origin Biomass
- Organic Municipal Waste
- Industrial Biomass Residues
- Others
By Application
- Heat Generation
- Power Generation
- Combined Heat and Power
- Industrial Boilers
- Others
By End-Use Industry
- Residential
- Commercial
- Hotels and Restaurants
- Educational Institutions
- Hospitals
- Others
- Industrial
- Food and Beverage
- Pulp and Paper
- Metals and Mining
- Pharmaceuticals
- Others
- Power Utilities
- Institutional
- Others
By Distribution Channel
- Direct Sales
- Distributors and Wholesalers
- Retail Stores
- Online Sales
- Fuel Supply Contracts
- Others
Driver Analysis
Mandatory coal-to-biomass co-firing programs expanding baseline offtake
Government‑mandated co‑firing of biomass in existing coal power plants has moved from pilot status to a structural, near‑term demand driver because it converts installed thermal capacity into biomass offtake without requiring new plant construction. In India, the Ministry of Power made a minimum 5% unmixed biomass co‑firing mandatory for coal‑based plants from October 2021, with the mandate designed to rise to 7% by 2025–26, and by mid‑2025 the Commission for Air Quality Management confirmed that 71 thermal power plants across the country had adopted the practice, up from just 35 plants co‑firing roughly 80,525 tonnes of biomass with a combined capacity of 55,335 MW in mid‑2022.
Indonesia has pursued a parallel path, with government and state utility plans to implement cofiring at 52 coal plants by 2025, reflecting a broader APAC policy trend of using existing thermal fleets as a bridge for biomass demand rather than waiting for full renewable build‑out. This driver fundamentally alters the biomass solid fuel business model by converting a large share of demand from discretionary heating or niche industrial use into contracted, utility‑scale offtake tied to regulatory compliance schedules, which supports longer‑term supply agreements, more predictable price formation, and justifies investment in dedicated biomass fuel-prep and logistics infrastructure near coal plant clusters.
Because the mandate step‑ups (for example, India’s move from 5% to 7% blending) are already legislated and enforcement is actively tracked by regulators, this driver carries a relatively high‑confidence, short‑term impact, justifying the largest incremental CAGR contribution in the table, concentrated in India, Indonesia, and other APAC markets with large legacy coal fleets.
Drivers Impact Analysis
| Driver | (~) % Impact on CAGR Forecast | Geographic Relevance | Impact Timeline |
|---|---|---|---|
| Mandatory coal-to-biomass co-firing programs expanding baseline offtake | +1.5% | APAC (India, Indonesia), EU legacy coal fleets | Short term (≤ 2 years) |
| EU RED III sustainability compliance reshaping certified biomass demand | +1.3% | EU core, Nordic and Baltic exporters | Medium term (2-4 years) |
| Industrial decarbonization driving fuel switching from coal and oil | +1.1% | EU, North America, APAC industrial corridors | Medium term (2-4 years) |
| Energy security concerns accelerating domestic and regional fuel diversification | +1.0% | EU, APAC importers, North America | Short term (≤ 2 years) |
| Rising APAC pellet demand from renewable heating and power expansion | +1.2% | APAC core (Japan, South Korea, China, SE Asia) | Medium term (2-4 years) |
| Residential and district heating conversion from fossil fuels | +0.7% | EU, North America, cold-climate APAC | Long term (≥ 4 years) |
Restraint Analysis
Raw material and feedstock supply instability
Raw material and feedstock supply instability is a direct restraint on the biomass solid fuel market because pellet and chip production is fundamentally dependent on sawmill residues, forestry byproducts, and agricultural residues whose availability fluctuates with harvest cycles, competing industrial demand, and weather-driven logistics disruptions; industry data indicates that supply chain instability has affected production to the point where almost 18% of pellet exports have been disrupted due to raw material shortages in recent assessment periods.
This instability compounds with a broader feedstock supply crunch already visible in adjacent biofuel markets, where European biofuel consumption reaching roughly 30.6 billion liters in 2025, up about 10% year-on-year, has intensified competition for the same underlying agricultural and forestry feedstock pools used across biodiesel, renewable diesel, and solid biomass production chains. Internal cost modeling suggests that when feedstock shortages hit, producers face input cost spikes of 15-25% within a single procurement cycle, forcing mills to either absorb margin compression of several percentage points or pass costs downstream, which risks losing price-sensitive residential and light-industrial buyers to alternative fuels; simultaneously, pellet manufacturers must extend supplier contracts geographically, adding freight distance and lead-time risk that can stretch delivery schedules by two to four weeks during peak shortage periods.
Strategically, this restraint pushes larger producers toward vertically integrated feedstock sourcing, long-term forestry partnerships, and diversified residue streams to reduce single-source dependency, but until such diversification scales, feedstock volatility will continue to suppress reliable capacity utilization and contribute an estimated 1.3-1.5 percentage-point drag on achievable CAGR, concentrated in EU production hubs, North American exporters, and APAC markets reliant on imported supply.
Restraint Impact Analysis
| Restraint | (~) % Impact on CAGR Forecast | Geographic Relevance | Impact Timeline |
|---|---|---|---|
| Raw material and feedstock supply instability | -1.4% | EU core, North America exporters, APAC importers | Short term (≤ 2 years) |
| Deforestation and carbon-neutrality criticism undermining policy support | -1.3% | EU regulatory hubs, North America, global NGO scrutiny | Long term (≥ 4 years) |
| Geopolitical trade disruption and shipping route volatility | -1.1% | EU, Russia/Baltic-linked routes, APAC import corridors | Medium term (2-4 years) |
| High logistics and transport cost intensity | -0.9% | Global export routes, APAC long-haul importers | Medium term (2-4 years) |
| Warm-winter demand destruction and price volatility | -0.8% | EU residential heating markets, North America | Short term (≤ 2 years) |
| Certification and compliance cost burden under RED III | -0.7% | EU core, exporters seeking EU market access | Medium term (2-4 years) |
Opportunity Analysis
Biochar carbon removal credit monetization
Biochar carbon removal is a genuine white-space opportunity rather than a current driver because it monetizes an entirely different value stream—verified, permanent carbon dioxide removal credits—that sits outside the traditional biomass-as-fuel revenue model and has only recently gained formal regulatory recognition; the European Commission formally adopted the first certification methodologies under the Carbon Removals and Carbon Farming Regulation on February 3, 2026, officially categorizing Biochar Carbon Removal as a permanent removal pathway.
Market data shows the underlying biochar carbon removal segment growing from just $14.6 million in 2022 to $33.9 million in 2023 and $181.5 million in 2024, a compound annual growth rate exceeding 130%, indicating a nascent but rapidly scaling monetization channel that most conventional solid biomass fuel producers have not yet integrated into their business models.
The commercial mechanism allows biomass processors to pyrolyze residues that would otherwise be sold as low-margin fuel into biochar, generating both a soil amendment or filler product and a tradeable carbon credit priced per tonne of CO2 equivalent locked away for centuries, effectively creating a dual revenue stream that can lift blended margins on the same feedstock base by an estimated 25-40% compared with fuel-only monetization.
Opportunity Impact Analysis
| Opportunity | (~) % Potential CAGR Upside | Geographic Relevance | Execution Window |
|---|---|---|---|
| Torrefied black pellet pivot for coal-parity fuel switching | +2.0% | EU, Japan/South Korea, North America exporters | Medium term (2-4 years) |
| Biochar carbon removal credit monetization | +1.6% | EU (CRCF-linked), North America, APAC pilot markets | Short term (≤ 2 years) |
| BECCS retrofit of existing biomass power and heat plants | +1.4% | EU core, UK, Nordic biomass fleets | Long term (≥ 4 years) |
| Diversion into sustainable aviation fuel feedstock supply | +1.2% | EU, North America, India/South Asia emerging | Long term (≥ 4 years) |
| Vertical integration and M&A roll-up of fragmented pellet supply chains | +0.9% | North America, Baltic/EU exporters, APAC consolidators | Medium term (2-4 years) |
| Municipal and agricultural waste-to-fuel densification platforms | +0.8% | APAC (India, SE Asia), Africa, Latin America | Long term (≥ 4 years) |
Challenges Analysis
Combustible dust fire and explosion risk
Combustible wood dust generated at nearly every handling and processing stage of pellet manufacturing constitutes a persistent operational challenge because fine particulate matter below roughly 5 millimeters can ignite from electrical sparks, friction heat, or confined agitation, creating fire and explosion pentagon conditions that must be continuously managed rather than eliminated outright. The severity of this risk was starkly illustrated on July 29, 2025, when a large explosion at the Horizon Biofuels facility in Fremont, Nebraska, triggered by a release of combustible wood dust, fatally injured three people and left the facility structurally unsafe for access weeks later, underscoring that even mature operators face catastrophic tail-risk events.
Industry guidance increasingly emphasizes proactive dust hazard analyses (DHA) as a structural shift from reactive to preventive safety management, requiring pellet mills to conduct systematic combustibility testing, install NFPA-compliant spark detection, explosion suppression, and isolation systems, and retrofit legacy equipment that was not originally designed with modern dust mitigation standards. Quantitatively, internal risk-adjusted cost modeling suggests that comprehensive DHA compliance and retrofit programs can add 3-5% to a mill’s annual capital maintenance budget, while insurance premiums for facilities without documented dust hazard mitigation programs can run 20-30% higher than for compliant peers, and a single major incident can shut down a production line for months, eliminating an entire quarter or more of output capacity.
Strategically, this challenge requires continuous investment in safety engineering, workforce training, and third-party hazard audits rather than a one-time fix, and until industry-wide adoption of proactive DHA protocols matures, this friction will impose an estimated 1.0-1.2 percentage-point drag on achievable CAGR, concentrated in North American and EU pellet mill clusters with the largest installed processing base.
Challenges Impact Analysis
| Challenge | (~) % CAGR Friction Drag | Geographic Relevance | Mitigation Horizon |
|---|---|---|---|
| Combustible dust fire and explosion risk | -1.1% | North America core, EU pellet mill clusters | Medium term (2-4 years) |
| Chronic forestry and logging workforce shortages | -1.3% | North America, EU, APAC forestry regions | Long term (≥ 4 years) |
| Feedstock composition and quality variability | -1.0% | Global sourcing regions, APAC agricultural residues | Medium term (2-4 years) |
| Material handling equipment wear and clogging | -0.7% | Global pellet mills, APAC humid-climate corridors | Short term (≤ 2 years) |
| Ongoing sustainability verification and audit burden | -0.9% | EU core, exporters into EU-regulated markets | Long term (≥ 4 years) |
| Bunker fuel and freight cost unpredictability | -0.8% | Global export shipping lanes, APAC long-haul routes | Short term (≤ 2 years) |
Geopolitical Impact Analysis
Geopolitical Realignment and Supply Chain Fragmentation Reshaping Biomass Solid Fuel Manufacturing.
Ongoing geopolitical tensions, including the prolonged Russia–Ukraine conflict and continued volatility in global fuel trade, have intensified efforts across Europe and North America to diversify energy sources and reduce dependence on imported fossil fuels. As a dispatchable renewable fuel that can be sourced domestically, biomass solid fuel has gained strategic importance in strengthening energy security and stabilizing industrial energy supply.
- In July 2025, according to Eurostat, the European Union’s renewable energy supply increased by 4% in 2024 to approximately 11.3 million terajoules (TJ), while hard coal supply declined by 13.8% year over year, reflecting a structural shift toward renewable energy resources.
At the same time, geopolitical uncertainty has encouraged governments to localize biomass feedstock sourcing and strengthen regional supply chains to reduce exposure to external fuel market disruptions. Sustainability regulations and domestic resource utilization are increasingly shaping biomass trade and investment decisions.
In December 2025, according to Eurostat, renewable energy accounted for 25.2% of the European Union’s gross final energy consumption in 2024, demonstrating continued policy momentum toward cleaner and more secure energy systems, where sustainable biomass remains an important contributor to electricity generation and industrial heat.
Regional Analysis
Asia Pacific Held the Largest Share of the Global Biomass Solid Fuel Market.
Europe, accounting for 35.0% of the biomass solid fuel market, maintains its leadership through well-established renewable energy policies, advanced biomass heating networks, and strong sustainability regulations governing biomass feedstocks. The region continues to expand biomass utilization across industrial facilities, combined heat and power plants, and district heating systems as part of its long-term decarbonization strategy.
- In January 2025, according to Eurostat, renewable energy represented 47.4% of the European Union’s gross electricity consumption in 2024, reflecting the continued expansion of renewable electricity systems that support greater deployment of dispatchable biomass-based generation.
The Asia-Pacific region is projected to register the fastest growth, driven by rising investments in renewable power, expanding biomass utilization from agricultural and forestry residues, and increasing demand for cleaner industrial fuels. Governments are strengthening energy diversification strategies while promoting domestic bioenergy resources to improve long-term energy resilience.
- In February 2025, according to Japan’s Ministry of Economy, Trade and Industry (METI), the government reaffirmed its target for renewable energy to account for 36–38% of the national electricity mix by FY2030, encouraging continued development of biomass power generation as part of a diversified renewable energy portfolio
Key Regions and Countries Covered
- North America
- The US
- Canada
- Europe
- Germany
- France
- The UK
- Spain
- Italy
- Russia & CIS
- Rest of Europe
- APAC
- China
- Japan
- South Korea
- India
- ASEAN
- Rest of APAC
- Latin America
- Brazil
- Mexico
- Rest of Latin America
- Middle East & Africa
- GCC
- South Africa
- Rest of MEA
Key Players Analysis
Biomass Solid Fuel manufacturers focus on strengthening feedstock security, production efficiency, and supply chain resilience to maintain long-term competitiveness. A key priority is continuous investment in advanced pelletization, briquetting, torrefaction, and drying technologies that improve fuel density, combustion efficiency, and storage stability while reducing moisture content and emissions.
Vertical integration with forestry operators, agricultural producers, and logistics providers enhances raw material availability while improving cost management amid seasonal feedstock fluctuations. Strategic investments in automated production facilities and certified sustainable sourcing enable manufacturers to meet increasingly stringent environmental regulations and customer sustainability requirements.
In addition, producers emphasize product quality standardization, supply chain digitalization, and long-term fuel supply agreements with industrial users, utilities, and district heating operators to strengthen customer retention, improve operational reliability, and reinforce their position in the growing renewable energy and industrial decarbonization landscape.
The Major Players In The Industry
- Enviva Inc.
- Drax Group plc
- AS Graanul Invest
- CM Biomass Partners A/S
- Lignetics, Inc.
- Stora Enso Oyj
- Svenska Cellulosa Aktiebolaget SCA
- Fram Renewable Fuels, LLC
- Balcas Energy
- Tolko Industries Ltd.
- Binderholz GmbH
- Pfeifer Holding GmbH
- Neova Group
- Rettenmaier & Söhne GmbH + Co. KG
- Moelven Pellets AS
Key Development
- In March 2025, Stora Enso Oyj commenced production at its new consumer packaging board line in Oulu, Finland. The approximately EUR 1 billion investment added a production line with 750,000 tonnes annual capacity, while wood consumption at the site will increase by around 1 million m³ to 3.5 million m³ annually, strengthening renewable biomass utilization.
- In May 2025 – Enviva Inc. announced that its 11th wood pellet production plant in Epes, Alabama is expected to begin producing pellets in May 2025. Once fully ramped up, the facility is projected to produce approximately 1 million metric tons of wood pellets annually, strengthening the company’s biomass fuel production capacity.
Report Scope
| Report Features | Description |
|---|---|
| Market Value (2025) | USD 31.7 Bn |
| Forecast Revenue (2035) | USD 83.6 Bn |
| CAGR (2026-2035) | 10.2% |
| Base Year for Estimation | 2025 |
| Historic Period | 2020-2024 |
| Forecast Period | 2026-2035 |
| Report Coverage | Revenue Forecast, Market Dynamics, Competitive Landscape, Recent Developments |
| Segments Covered | By Fuel Type (Wood Pellets, Wood Chips, Briquettes and Others), By Feedstock (Woody Biomass, Agricultural Residues, Animal-Origin Biomass, Organic Municipal Waste, Industrial Biomass Residues and Others), By Application (Heat Generation, Power Generation, Combined Heat and Power, Industrial Boilers and Others), By End-Use Industry (Residential, Commercial, Industrial, Power Utilities, Institutional and Others), By Distribution Channel (Direct Sales, Distributors and Wholesalers, Retail Stores, Online Sales, Fuel Supply Contracts and Others) |
| Regional Analysis | North America – The US & Canada; Europe – Germany, France, The UK, Spain, Italy, Russia & CIS, Rest of Europe; APAC– China, Japan, South Korea, India, ASEAN & Rest of APAC; Latin America– Brazil, Mexico & Rest of Latin America; Middle East & Africa– GCC, South Africa, & Rest of MEA |
| Competitive Landscape | Enviva Inc., Drax Group plc, AS Graanul Invest , CM Biomass Partners A/S, Lignetics, Inc., Stora Enso Oyj , Svenska Cellulosa Aktiebolaget SCA, Fram Renewable Fuels, LLC, Balcas Energy , Tolko Industries Ltd., Binderholz GmbH, Pfeifer Holding GmbH , Neova Group, J. Rettenmaier & Söhne GmbH + Co. KG, Moelven Pellets AS. |
| Customization Scope | Customization for segments, region/country-level will be provided. Moreover, additional customization can be done based on the requirements. |
| Purchase Options | We have three licenses to opt for: Single User License, Multi-User License (Up to 5 Users), Corporate Use License (Unlimited Users and Printable PDF) |





































