


Report Overview
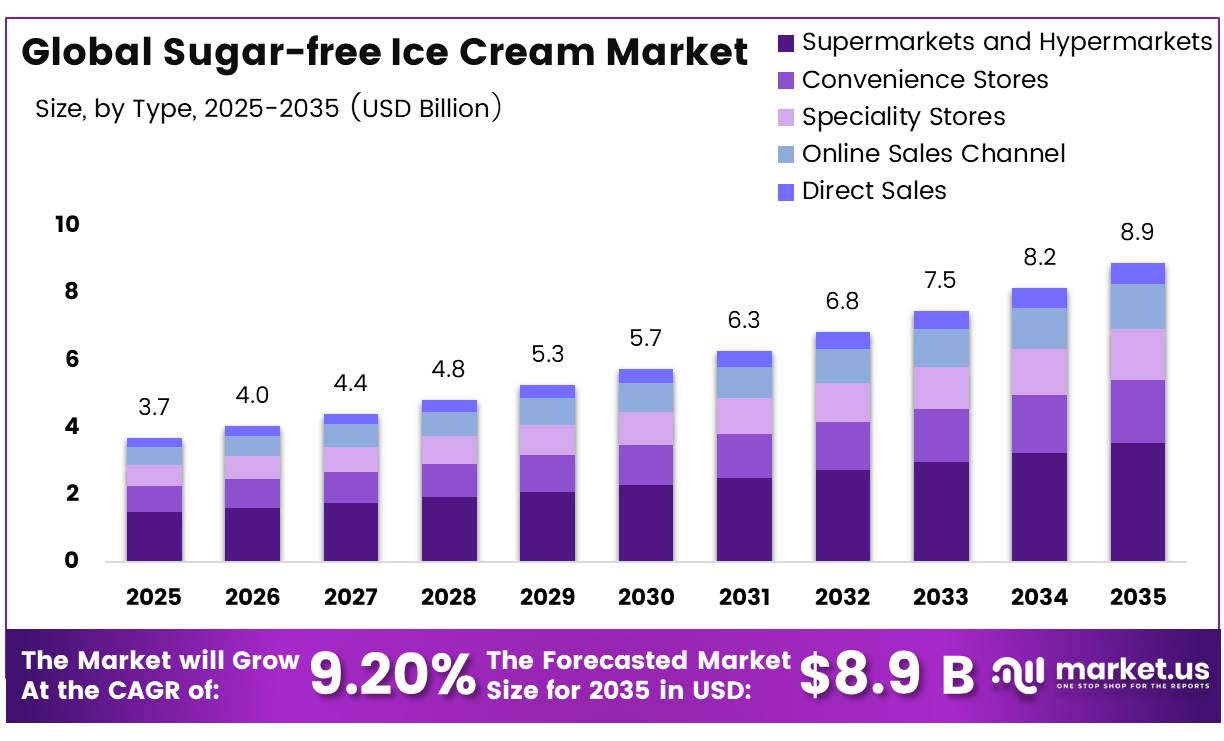
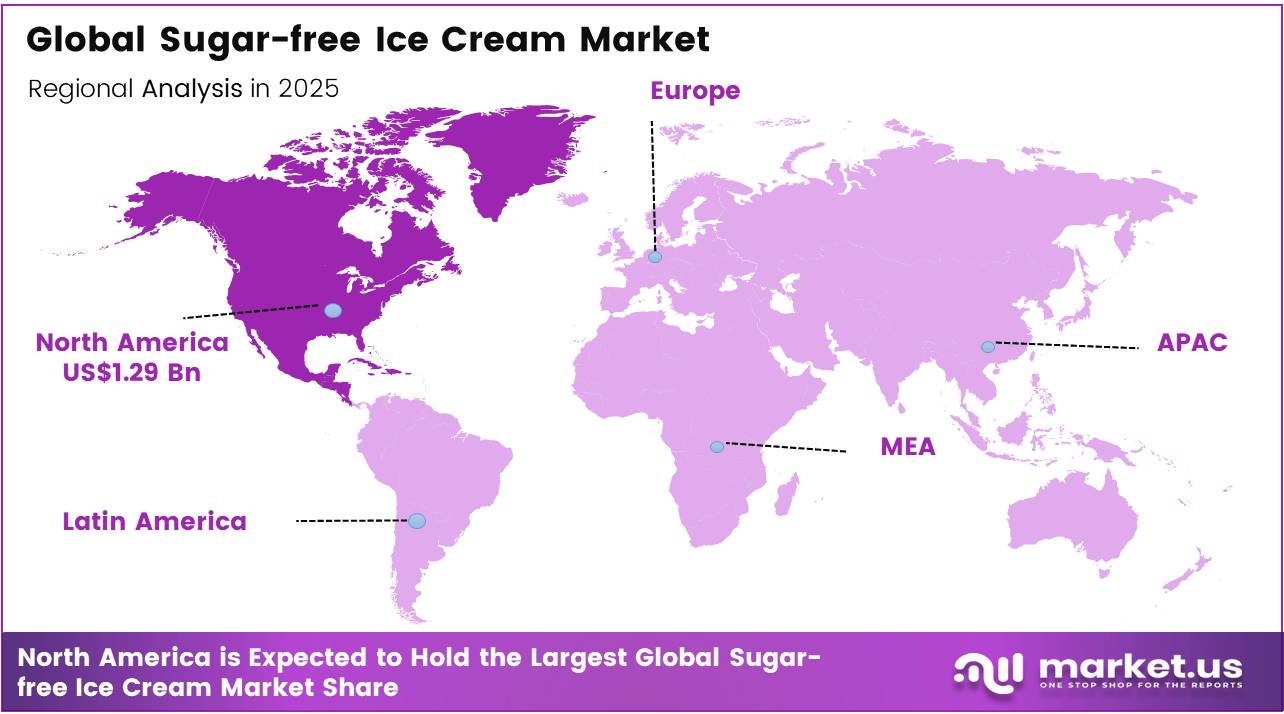
In 2025, the Global Sugar-free Ice Cream Market was valued at USD 3.7 billion, and between 2026 and 2035, this market is estimated to register a CAGR of 9.2%, reaching about USD 8.9 billion by 2035. In 2025, North America held a dominant market position, capturing more than a 34.78% share, holding USD 1.29 Billion revenue.
The sugar-free ice cream industry is moving from a diabetic offering into a better-for-you frozen dessert category. Manufacturers are reformulating dairy products with stevia, monk fruit, erythritol, allulose and soluble fibers while protecting creaminess, freezing stability and flavour.
- USDA reported that U.S. ice cream and frozen dairy output reached 1,386 million gallons in 2024, while regular ice cream represented about 60–65% and low-fat or nonfat products accounted for 24–34%, showing demand for differentiated formulations.
Future growth will come from high-protein recipes, plant-based bases, portion-controlled formats and clean-label sweetener blends. FDA rules allow a “sugar free” claim below 0.5 gram of sugars per serving, while its added-sugar Daily Value is 50 grams and dietary guidance recommends keeping added sugars below 10% of calories.
Key Takeaways
- The global Sugar-free Ice Cream market was valued at USD 3.7 billion in 2025.
- The global market is projected to grow at a CAGR of 9.2% and is estimated to reach USD 8.9 billion by 2035.
- On the basis of type, the Vanilla Sugar-free Ice Cream dominated the market, constituting 33.45% of the total market share.
- Based on the Form, the Bar/Stick dominated the Sugar-free Ice Cream market, with a substantial market share of around 42.34%.
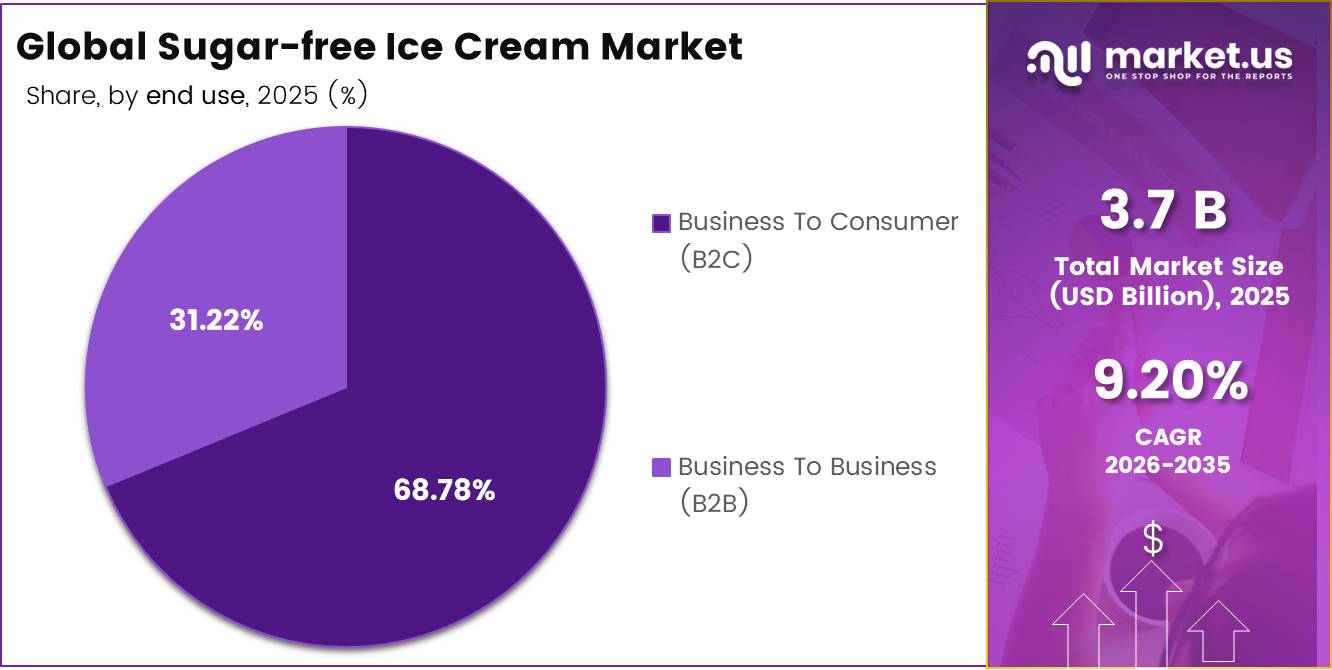
- Based on the End Use, Business To Consumer (B2C) led the market, comprising 68.78% of the total market.
- Among the Distribution Channel, the Supermarkets and Hypermarkets held a major share in the Sugar-free Ice Cream market, 39.78% of the market share.
- In 2025, the North America was the most dominant region in the Sugar-free Ice Cream market, accounting for 34.78% of the total global consumption.
Type Analysis
Vanilla represents dominant Segment in the Market.
Vanilla remains the leading sugar-free ice cream flavour with a market share of 33.45%. It’s mild and familiar profile works well with stevia, monk fruit, allulose and other sugar alternatives. It is widely used in retail tubs, food-service desserts and plant-based formulations, giving producers flexibility across different product ranges.
- In 2025, U.S. milk production exceeded 231 billion pounds, providing a strong dairy supply base for manufacturers developing conventional and reduced-sugar frozen desserts. Vanilla also acts as a versatile base for fruits, nuts and sauces, supporting its continued leadership.
Chocolate is emerging as the fastest-growing flavour as producers improve cocoa intensity while controlling sweetness and calories. Its indulgent positioning helps sugar-free products appeal beyond consumers managing sugar intake. In 2026, CDC reported that desserts and sweet snacks contributed 19% of added sugars consumed in the United States, highlighting opportunities for reformulated alternatives. FDA rules also allow a reduced-sugar claim when a product contains at least 25% less sugar than a suitable reference product.
Form Analysis
Bar/Stick a significant form.
Bar/stick held the leading position in the sugar-free ice cream market with a 42.34% share. Its portion-controlled design, easy handling and individual wrapping make it suitable for convenience stores, supermarkets, vending points and food-service outlets. The format also reduces serving effort and supports quick consumption outside the home.
- USDA reported that U.S. food-away-from-home spending reached USD 1.41 trillion in 2025, providing a strong consumer base for portable frozen desserts.
Pints are emerging as the fastest-growing form, supported by at-home consumption, resealable packaging and the expansion of premium sugar-free recipes. They allow buyers to control portions while keeping the remaining product frozen for later use. According to the U.S. Census Bureau, the country had 39.7 million one-person households in 2025, creating favourable demand for compact packages designed for smaller households.
End Use Analysis
Business-to-consumer Are the Most Widely Used Separators.
Business-to-consumer held the leading position in the sugar-free ice cream market with a 68.78% share. Its dominance is supported by easy product access through supermarkets, convenience stores, brand websites and online grocery platforms. Consumers can directly compare flavours, ingredients, calorie content and sweetener claims before purchasing.
- The U.S. Census Bureau reported that retail e-commerce sales reached USD 326.7 billion during the first quarter of 2026, strengthening opportunities for home delivery, multipacks and direct-to-consumer frozen dessert subscriptions.
Business-to-business is emerging as the fastest-growing end use as restaurants, hotels, cafés, hospitals and institutional caterers expand reduced-sugar menu choices. Bulk packaging and recurring supply contracts help buyers manage serving costs while offering healthier dessert alternatives. The U.S. Census Bureau’s Annual Retail Trade Survey and the Bureau of Labor Statistics’ Food Services and Drinking Places (NAICS 722) data indicate that the U.S. food service sector represents a multi-trillion-dollar market, underscoring continued growth in demand for commercial sugar-free ice cream suppliers.
Distribution Channel Analysis
Held a Major Share of the Sugar-free Ice Cream Market.
Supermarkets and hypermarkets held the leading position in the sugar-free ice cream market with a 39.78% share. Their strength comes from high customer traffic, large freezer sections and the ability to offer several flavours, pack sizes and price points in one place. Shoppers can also review nutrition labels and compare sweetener ingredients before buying.
- USDA reported that U.S. food-at-home expenditure reached USD 1.10 trillion in 2025, highlighting the strong purchasing base available to grocery-led frozen dessert sales.
Convenience stores are the fastest-growing distribution channel in the sugar-free ice cream market, supported by demand for quick, portable and portion-controlled desserts. Their neighbourhood locations, extended operating hours and grab-and-go layouts encourage impulse purchases, particularly among commuters and younger consumers. Retailers are also expanding freezer selections with low-sugar products that provide indulgence without conventional sugar levels.
- The latest U.S. Census Bureau County Business Patterns data counted 36,992 convenience-store employer establishments, showing the broad retail network available for sugar-free ice cream brands to expand product visibility and reach everyday shoppers..
Key Market Segments
By Type
- Chocolate
- Vanilla
- Mint Chip
- Strawberry
- Salted Caramel
- Coffee
- Others
By Form
- Bar/Stick
- Pints
- Sandwich
- Others
By End Use
- Business To Business (B2B)
- Business To Consumer (B2C)
By Distribution Channel
- Supermarkets and Hypermarkets
- Convenience Stores
- Speciality Stores
- Online Sales Channel
- Direct Sales
Driver Analysis
Label-compliant sugar-free reformulation
Regulatory definitions make formulation accuracy a growth prerequisite rather than a marketing choice, because the “sugar-free” claim has exceptionally tight thresholds in key markets. In the United States, FDA rules permit “sugar free” only below 0.5 g sugars per reference amount customarily consumed and per labeled serving, while requiring specific handling where ingredients contribute trivial sugar; the EU likewise permits the claim only at no more than 0.5 g sugars per 100 g or 100 ml. India’s FSSAI-aligned threshold reported for solid food is also no more than 0.5 g total sugars per 100 g, compared with 5 g per 100 g for “low sugar.”
These thresholds pressure dairy-based formulations because lactose and inclusions can contribute naturally occurring sugar, pushing producers toward lactose-reduced bases, controlled inclusion loading, smaller serving sizes, and separate “no added sugar” SKUs where a true sugar-free claim is technically or economically impractical. The +1.2 pp effect comes from lower consumer-search friction and improved retail acceptance for defensible front-of-pack claims; however, it favors companies with formulation laboratories, validated nutrient testing, and claim-governance capabilities over small brands relying on ambiguous wellness messaging.
Drivers Impact Analysis
| Driver | (~) % Impact on CAGR Forecast | Geographic Relevance | Impact Timeline |
|---|---|---|---|
| Diabetes and weight-management demand | +1.6 pp | North America, Europe, APAC urban markets | Medium term (2–4 years) |
| Label-compliant sugar-free reformulation | +1.2 pp | US, EU, India, GCC | Short term (≤2 years) |
| Taste parity via sweetener systems | +1.0 pp | North America, EU, Japan, South Korea | Medium term (2–4 years) |
| Premium protein and functional formats | +0.9 pp | North America core, Europe, APAC metros | Medium term (2–4 years) |
| Omnichannel frozen distribution | +0.8 pp | North America, China, India, GCC, LATAM cities | Short term (≤2 years) |
| Plant-based and lactose-free convergence | +0.6 pp | North America, Western Europe, APAC corridors | Long term (≥4 years) |
Restraint Analysis
Premium Price Gap
Sugar-free ice cream carries a structurally higher delivered cost than conventional ice cream because sucrose removal requires a replacement system rather than a one-for-one ingredient substitution: high-intensity sweeteners provide sweetness but not bulk, while polyols, soluble fibers, stabilizers, milk proteins, and flavor-maskers add formulation and procurement cost. Industry technical guidance indicates that replacing sugar typically requires three or more ingredients to restore sweetness, solids, body, and freezing behavior, increasing stock-keeping-unit complexity and raising minimum-order exposure for smaller manufacturers.
In price-sensitive markets, a premium of even 20–40% per pint or tub can shift shoppers back to conventional private-label ice cream, particularly when sugar-free products are positioned as discretionary wellness treats rather than medically necessary food. This creates volume elasticity at retail, reduces promotional headroom, and compresses manufacturer margin because brands must choose between absorbing incremental formulation cost, reducing pack size, or accepting a lower gross margin; the restraint is strongest across India, Southeast Asia, Latin America, and African urban markets, where freezer access may expand faster than consumers’ willingness to pay a persistent health-positioning premium.
Restraint Impact Analysis
| Restraint | (~) % Impact on CAGR Forecast | Geographic Relevance | Impact Timeline |
|---|---|---|---|
| Premium price gap | -1.5 pp | APAC, LATAM, Africa, EU | Short term (≤2 years) |
| Taste and texture gap | -1.3 pp | North America, EU, APAC | Medium term (2–4 years) |
| Sweetener-health skepticism | -1.1 pp | North America, EU, Australia | Medium term (2–4 years) |
| Claim-compliance burden | -0.9 pp | US, EU, India, GCC | Short term (≤2 years) |
| Cold-chain cost and loss | -0.8 pp | India, LATAM, Africa, SE Asia | Medium term (2–4 years) |
| Ingredient-cost volatility | -0.7 pp | Global; EU, North America core | Short term (≤2 years) |
Opportunity Analysis
Clinical Nutrition Partnerships
The white space is not merely selling sugar-free ice cream to health-conscious shoppers—the baseline market already does that—but building referral, education, and repeat-purchase pathways through diabetes clinics, dietitian networks, digital glucose-management platforms, pharmacies, and employer wellness programmes. WHO estimates that 830 million people lived with diabetes in 2022, creating a large potential engagement pool, although product marketing must not imply disease treatment or glucose-control efficacy without substantiation.
A manufacturer could pilot a 90-day programme built around 4–8 single-serve products per month, dietitian-reviewed portion guidance, and a target of 20–30% subscription conversion from clinic referrals; at a 2–3 times higher annual purchase frequency than intermittent grocery buyers, this could add approximately 1.4 percentage points to category CAGR in an execution-led scenario. Value creation comes from lower customer-acquisition cost, more predictable demand, and reduced promotional dependence, while the operating requirement is a compliant “permissible treat” proposition—typically 80–120 ml portions, transparent total-carbohydrate disclosure, and no unapproved therapeutic claims—rather than a broad and legally vulnerable “diabetic ice cream” label.
Opportunity Impact Analysis
| Opportunity | (~) % Potential CAGR Upside | Geographic Relevance | Execution Window |
|---|---|---|---|
| Clinical nutrition partnerships | +1.4 pp | North America, EU, India, GCC | Medium term (2–4 years) |
| Foodservice dessert platforms | +1.2 pp | North America, EU, APAC metros | Short term (≤2 years) |
| DTC subscription and personalization | +1.0 pp | US, Canada, UK, Australia | Short term (≤2 years) |
| Affordable emerging-market packs | +1.3 pp | India, SE Asia, LATAM, Africa | Medium term (2–4 years) |
| Licensed ingredient platforms | +0.9 pp | North America, EU, APAC | Medium term (2–4 years) |
| Free-from portfolio roll-ups | +0.8 pp | North America, Western Europe | Long term (≥4 years) |
Challenges Analysis
Formulation Stability Management
Sugar-free ice cream production requires continuous management of a formulation system in which sucrose’s sweetness, solids, freezing-point depression, viscosity, and water-binding roles are split across multiple ingredients, making quality variation an operational challenge rather than an absolute barrier to sales. A typical sugar-free recipe may require 3–6 functional inputs beyond the dairy or plant base—such as high-intensity sweeteners, polyols, soluble fibres, emulsifiers, stabilisers, and flavour-maskers—and small dosage variation can affect draw temperature, overrun, hardness, melt profile, and ice-crystal growth during 6–12 months of frozen storage.
Technical guidance confirms that replacing sugar usually requires at least three ingredients to restore its functions in frozen desserts. The resulting friction appears as additional pilot batches, 8–16 week stability testing cycles, higher formulation-change approval workload, and yield loss when products fail sensory or texture specifications after freeze–thaw exposure; mitigation requires standardised premix systems, digital batch records, tighter supplier specifications, accelerated shelf-life modelling, and sensory panels calibrated against conventional premium ice cream, with the estimated -1.1 percentage-point drag persisting until manufacturers can scale robust recipes across multiple plants and climates.
Challenges Impact Analysis
| Challenge | (~) % CAGR Friction Drag | Geographic Relevance | Mitigation Horizon |
|---|---|---|---|
| Formulation stability management | -1.1 pp | North America, EU, APAC | Medium term (2–4 years) |
| Multi-tier cold-chain control | -0.9 pp | India, SE Asia, LATAM, Africa | Long term (≥4 years) |
| Sweetener sourcing complexity | -0.8 pp | Global; APAC, EU, North America | Medium term (2–4 years) |
| Food-science talent scarcity | -0.7 pp | North America, EU, UK, APAC | Long term (≥4 years) |
| Regulatory evidence adaptation | -0.6 pp | EU, US, India, Australia | Medium term (2–4 years) |
| Forecasting and SKU volatility | -0.5 pp | Global retail markets | Short term (≤2 years) |
Geopolitical Impact Analysis
Geopolitical Realignment and Supply Chain Fragmentation Reshaping Sugar-free Ice Cream Manufacturing.
Geopolitical tension around the Red Sea is reshaping sourcing and logistics for sugar-free ice cream producers. Sweeteners, cocoa, fruit preparations, stabilizers and packaging often move through international shipping networks, so disruption can quickly affect lead times and cold-chain costs.
- During the first half of 2025, 9.1 million barrels per day of oil moved around the Cape of Good Hope, while flows through the Suez Canal and SUMED pipeline were 4.9 million barrels per day. Bab el-Mandeb handled another 4.2 million barrels per day. These shifts indicate heavier reliance on longer routes, increasing fuel use, insurance exposure and uncertainty for refrigerated ingredients and finished products.
Trade realignment is creating a second layer of pressure. USDA reported that U.S. agricultural imports reached USD 212 billion in 2025 and exceeded exports by USD 41 billion. Imports from Mexico were valued at USD 43.8 billion, while Canada supplied USD 39.3 billion, showing how strongly food manufacturers depend on cross-border sourcing. Horticultural imports declined by 8% as new tariffs affected trade, while tropical products such as cocoa and coffee faced higher global prices. Sugar-free ice cream producers are therefore likely to qualify more regional suppliers, hold additional safety stock and simplify recipes to protect availability, margins and consistent product quality.
Regional Analysis
North America Held the Largest Share of the Global Sugar-free Ice Cream Market.
North America held the leading position in the sugar-free ice cream market with a 34.78% share. Its dominance is supported by established frozen-food retail networks, strong label awareness and wide availability of low-calorie and reduced-sugar products. U.S. retail and food-service sales reached USD 757.1 billion in April 2026, showing the region’s large consumer-spending base. Separately, a CDC study covering 2021–2024 found diagnosed diabetes among 9.8% of U.S. adults, encouraging manufacturers and retailers to offer desserts suited to controlled-sugar diets.
Asia-Pacific is the fastest-growing region as health concerns, modern grocery expansion and product reformulation influence purchasing. Japan’s health ministry estimated that nearly 11 million people were strongly suspected of having diabetes, while another 7 million could not rule out the condition. In Australia, 6.6% of adults had diabetes during 2022–2024. These figures highlight a sizeable regional consumer base for portion-controlled, naturally sweetened and dairy-free sugar-free ice cream products.
Key Regions and Countries Covered
- North America
- The US
- Canada
- Europe
- Germany
- France
- The UK
- Spain
- Italy
- Russia & CIS
- Rest of Europe
- APAC
- China
- Japan
- South Korea
- India
- ASEAN
- Rest of APAC
- Latin America
- Brazil
- Mexico
- Rest of Latin America
- Middle East & Africa
- GCC
- South Africa
- Rest of MEA
Key Players Analysis
Sugar-free ice cream manufacturer’s focus on strengthening product differentiation, formulation quality and distribution reach to remain competitive. A key priority is continuous recipe innovation, including the use of stevia, monk fruit, allulose, erythritol and soluble fibres that reduce sugar while preserving sweetness, creaminess and mouthfeel.
Companies also invest in improved freezing, aeration and stabilisation processes, as these methods help control ice-crystal formation and support smoother texture across dairy and plant-based products. Closer coordination with dairy suppliers, sweetener producers and cold-chain partners helps secure ingredient availability and manage costs during periods of raw material volatility.
Strategic production and retail expansion, particularly across North America and Asia-Pacific, allows brands to serve growing demand from health-conscious consumers and people managing sugar intake. Manufacturers further emphasise clean-label positioning, portion-controlled packaging and transparent nutrition claims to build trust, while expanding through supermarkets, convenience stores and online grocery platforms. Long-term partnerships with retailers, food-service operators and ingredient specialists also improve shelf access, support product development and strengthen the position of brands in premium and functional frozen-dessert segments..
Major Players In The Industry
- Beyond Better Foods, LLC (Enlightened)
- Turkey Hill Dairy
- Vadilal Industries Ltd.
- Hershey Creamery Co.
- Mammoth Creameries
- Wells Enterprises, Inc.
- Graviss Foods Pvt Ltd. (Baskin Robbins)
- Froneri International Limited (Dreyer’s)
- Devyani Food Industries Pvt. Ltd. (Creambell)
- Gujarat Co-operative Milk Marketing Federation Ltd.
- Other Key Players
Key Development
- In May 2026, Wells Enterprises detailed a USD 512 million Dunkirk expansion across three phases, expected to retain 380 jobs and create 270 positions while adding frozen-dessert capacity and integrated chocolate manufacturing.
- In January 2026, Turkey Hill Dairy launched two soft-serve-inspired frozen desserts, Vanilla Soft and Chocolate & Vanilla Twist, expanding its at-home portfolio with scoopable products designed for smoother texture directly from household freezers and greater consumer convenience nationwide.
Report Scope
| Report Features | Description |
|---|---|
| Market Value (2025) | USD 3.7 Bn |
| Forecast Revenue (2035) | USD 8.9 Bn |
| CAGR (2026-2035) | 9.2% |
| Base Year for Estimation | 2025 |
| Historic Period | 2020-2024 |
| Forecast Period | 2026-2035 |
| Report Coverage | Revenue Forecast, Market Dynamics, Competitive Landscape, Recent Developments |
| Segments Covered | By Type (Chocolate, Vanilla, Mint Chip, Strawberry, Salted Caramel, Coffee and Others), By Form (Bar/Stick, Pints, Sandwich and Others), By End Use (Business To Business (B2B) and Business To Consumer (B2C)), By Distribution Channel (Supermarkets and Hypermarkets, Convenience Stores, Speciality Stores, Online Sales Channel and Direct Sales) |
| Regional Analysis | North America – The US & Canada; Europe – Germany, France, The UK, Spain, Italy, Russia & CIS, Rest of Europe; APAC– China, Japan, South Korea, India, ASEAN & Rest of APAC; Latin America– Brazil, Mexico & Rest of Latin America; Middle East & Africa– GCC, South Africa, & Rest of MEA |
| Competitive Landscape | Beyond Better Foods, LLC (Enlightened), Turkey Hill Dairy, Vadilal Industries Ltd., Hershey Creamery Co., Mammoth Creameries, Wells Enterprises, Inc., Graviss Foods Pvt Ltd. (Baskin Robbins), Froneri International Limited (Dreyer’s), Devyani Food Industries Pvt. Ltd. (Creambell), Gujarat Co-operative Milk Marketing Federation Ltd., Other Key Players. |
| Customization Scope | Customization for segments, region/country-level will be provided. Moreover, additional customization can be done based on the requirements. |
| Purchase Options | We have three licenses to opt for: Single User License, Multi-User License (Up to 5 Users), Corporate Use License (Unlimited Users and Printable PDF) |





































