


Report Overview
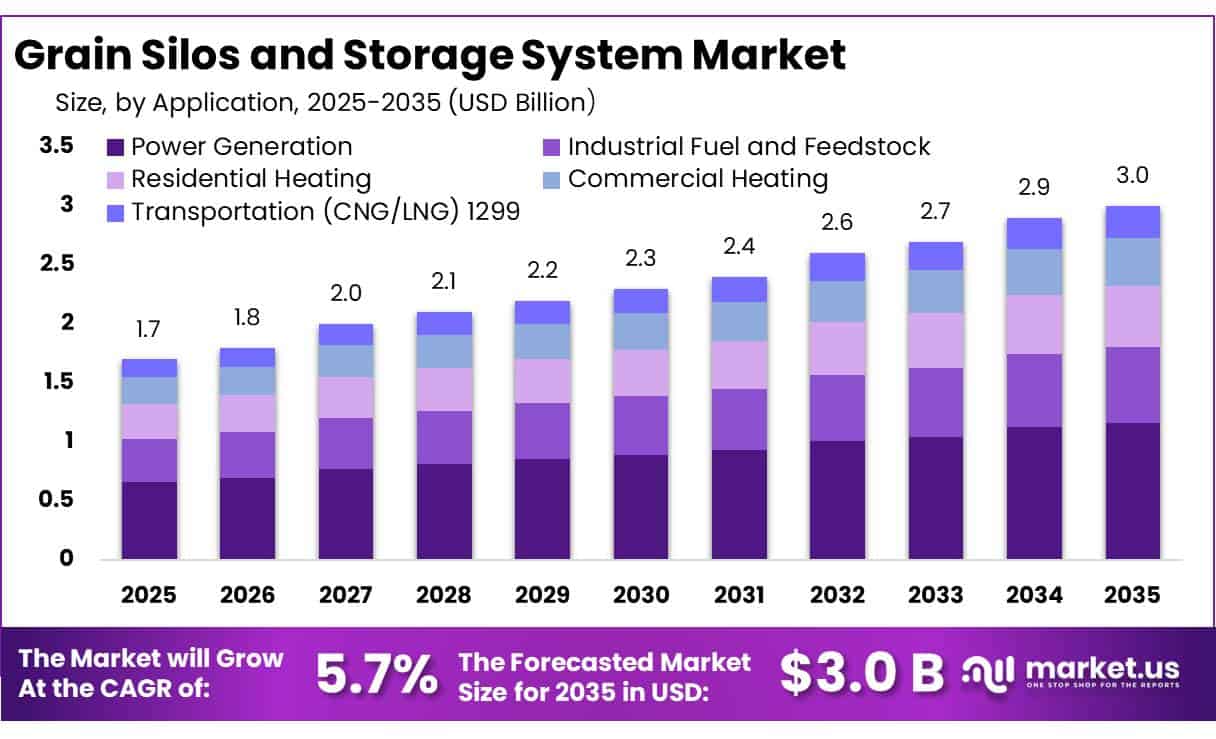
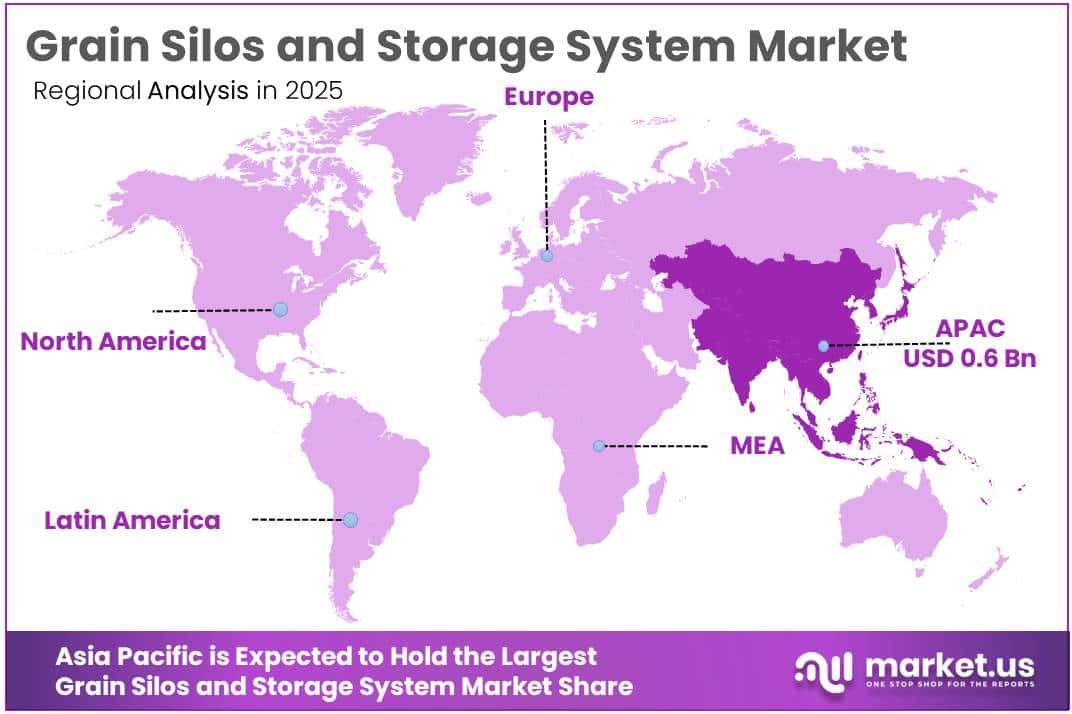
In 2025, the Global Grain Silos and Storage System Market valued at USD 1.7 billion, and between 2026 and 2035, this market is estimated to register a CAGR of 5.7%, reaching about USD 3.0 billion by 2035. Asia Pacific held a dominant market position, capturing more than a 36.4% share, holding USD 0.64 billion in revenue.
Grain silos and storage systems form a critical part of the agricultural supply chain by protecting harvested wheat, maize, rice, barley and other grains between farms, processors, feed manufacturers, exporters and food companies. Modern installations increasingly combine steel or concrete silos with conveyors, elevators, dryers, aeration systems, temperature and moisture monitoring, dust control and automated loading equipment.
- The industrial scenario remains supported by historically high cereal availability. FAO estimated global cereal production at 3,043 million tonnes in 2025, up 6.1% from 2024. Global cereal utilization reached about 2,952 million tonnes in 2025/26, while cereal stocks were estimated at 952.2 million tonnes. International cereal trade was estimated at 508.6 million tonnes during the same marketing season. These volumes create continuous demand for bulk storage, port silos, commercial elevators, drying systems and grain-handling infrastructure.
Key Takeaways
- Grain Silos and Storage System Market valued at USD 1.7 billion, and between 2026 and 2035, this market is estimated to register a CAGR of 5.7%, reaching about USD 3.0 billion by 2035.
- Hydraulic Fracturing held a dominant market position, capturing more than a 51.20% share.
- Power Generation held a dominant market position, capturing more than a 38.70% share.
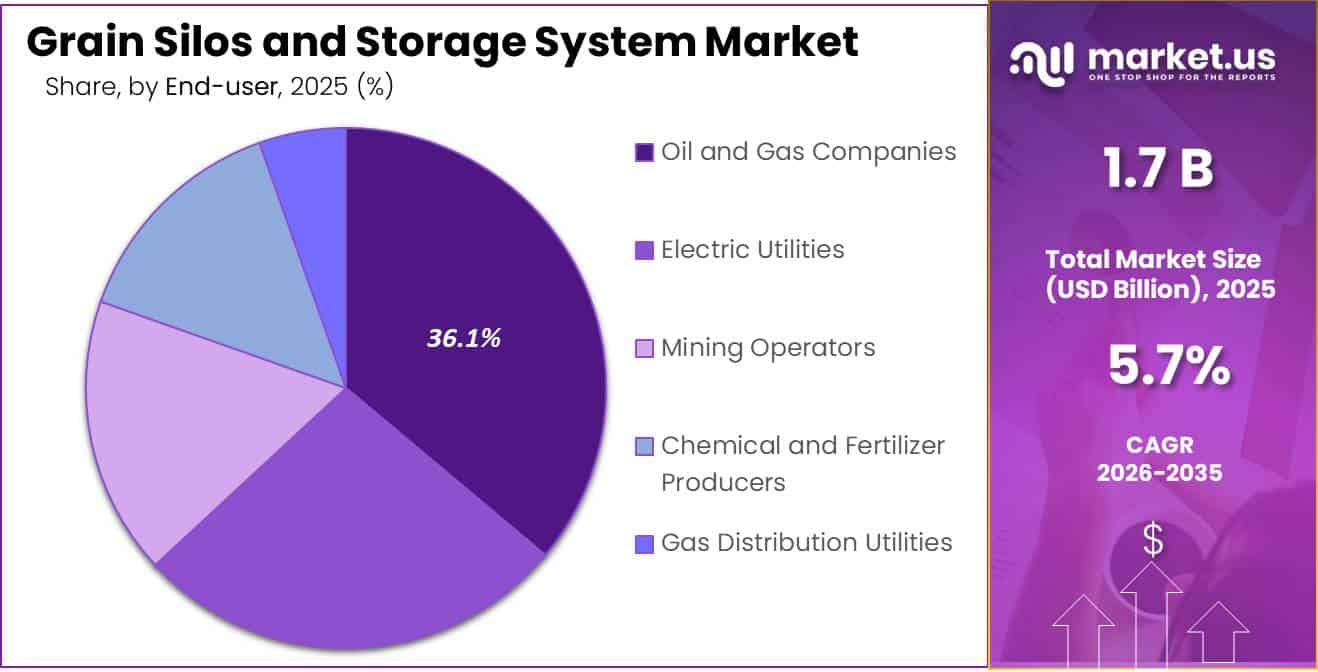
- Oil and Gas Companies held a dominant market position, capturing more than a 36.00% share.
- Asia Pacific held a dominant market position, capturing more than a 36.40% share and generating about USD 0.64 billion.
Although FAO expects 2026 cereal production to ease to about 2,983 million tonnes, this would still represent the second-highest output on record and only 1.9% below the 2025 peak. High production levels, combined with weather variability and fluctuating harvest timing, are encouraging operators to maintain flexible storage capacity. FAO World Food Situation In the United States, USDA reported 11.9 billion bushels of off-farm commercial grain storage capacity across 7,844 facilities on December 1, 2025, illustrating the scale of established bulk-storage infrastructure in a major grain-producing economy.
- Food security and reduction of post-harvest deterioration remain major driving factors. FAO identifies moisture, heat, insects and fungi as key storage risks, supporting demand for controlled aeration, drying, sealing, fumigation-ready structures and real-time grain-condition monitoring. Large cereal inventories also strengthen this requirement; FAO projected world cereal stocks at 949.0 million tonnes for the close of the 2026/27 seasons, with a global stocks-to-use ratio of 31.7%.
Government support is also improving access to modern storage. USDA’s Farm Storage Facility Loan Program had issued more than 40,000 loans by May 2025 and added about 1 billion bushels of on-farm storage capacity since its launch. The program allows storage-facility loans of up to USD 500,000, with terms ranging from 3 to 12 years, helping producers finance bins, drying equipment and handling systems.
Future growth opportunities are expected to remain strong in smart silos, automated grain terminals, sensor-based inventory management, energy-efficient dryers and integrated temperature, moisture and pest monitoring. OECD-FAO projects global cereal production to reach a record 3.22 billion tonnes by 2035, supported mainly by 0.9% annual yield growth while cultivated area expands only 0.1% per year. By 2035, about 40% of cereals are expected to be consumed directly as food and 34% used as animal feed, indicating sustained long-term requirements for safe, efficient and digitally managed storage capacity.
By Technology Analysis
The supplied Hydraulic Fracturing share of 51.20% cannot be classified under the Grain Silos and Storage System market because the technology belongs to oil and gas extraction.
In 2025, Hydraulic Fracturing held a dominant market position, capturing more than a 51.20% share, should not be published under the Grain Silos and Storage System Market. Hydraulic fracturing is used to increase oil and natural gas production from underground formations rather than to store or handle grain.
The U.S. Energy Information Administration reported in its 2025 well study that horizontal drilling combined with hydraulic fracturing has become standard practice for U.S. oil and natural gas production. USDA, by comparison, identifies grain bins, drying systems, handling equipment and storage facilities as eligible grain-storage infrastructure under its Farm Storage Facility Loan Program.
Horizontal Drilling cannot be reliably presented as a technology segment of the Grain Silos and Storage System Market. EIA reported in November 2025 that horizontal wells produced 94% of Lower 48 U.S. oil and 92% of natural gas in December 2024, showing that the technology is directly associated with hydrocarbon production. The same EIA analysis stated that more than 15,000 new wells entered production during 2024, including around 11,700 horizontal wells.
By Application Analysis
Power Generation leads with a 38.70% share under the supplied application classification, supported by the wider use of stored biomass materials in energy operations.
In 2025, Power Generation held a dominant market position, capturing more than a 38.70% share. Within the supplied application classification, the segment benefits from the need for reliable bulk-storage and material-handling systems where agricultural and biomass materials are accumulated before energy conversion. Storage systems help operators protect feedstock from moisture, control material flow and maintain continuous plant operations. Government energy data also show sizeable biomass use in electricity production.
- In 2025, U.S. wood and wood-waste biomass consumption for electricity generation reached 279,522 billion Btu, highlighting the large physical feedstock requirement associated with biomass-based power operations.
Industrial Fuel and Feedstock represents an important application area because grains, particularly corn, require safe storage before being supplied to ethanol plants and other processing facilities. USDA reported in July 2026 that U.S. corn use for fuel ethanol was projected at 5.55 billion bushels for the 2025/26 marketing year.
During the first three quarters of the same marketing year, ethanol producers had already used around 4.13 billion bushels of corn. USDA also projected total feed and residual corn use at 6.35 billion bushels for 2025/26. These large physical volumes support continued requirements for grain silos, elevators, aeration systems, conveyors and controlled storage infrastructure near industrial processing and biofuel facilities.
By End-User Analysis
Oil and Gas Companies lead with a 36.00% share under the supplied end-user classification, supported by large-scale energy production and bulk-material handling requirements.
In 2025, Oil and Gas Companies held a dominant market position, capturing more than a 36.00% share. Under the supplied classification, these companies can create demand for industrial storage and handling infrastructure where bulk agricultural materials, biomass, additives or other solid feedstocks are used alongside energy-processing operations. The wider oil and gas industry maintained a very large operating base during 2025.
According to the U.S. Energy Information Administration, U.S. crude oil production reached a record 13.6 million barrels per day in 2025, increasing 3% from the previous year, while the Lower 48 states excluding the Gulf of America supplied 83% of total U.S. production. This level of industrial activity supports continued investment in automated material handling, enclosed storage, monitoring and logistics infrastructure across large energy facilities.
Electric Utilities can support demand for silo-type storage and bulk-handling systems, particularly at facilities using biomass and other solid energy materials. Such systems help maintain feedstock quality, improve continuous material feeding and reduce exposure to moisture during storage.
In 2025, total U.S. utility-scale electricity generation reached approximately 4.43 trillion kilowatthours, demonstrating the scale of utility operations. Natural gas supplied about 41% of utility-scale generation, while renewable energy sources accounted for approximately 24%. The large and increasingly diversified generation base is encouraging utilities to adopt more automated material handling, monitoring and storage infrastructure where solid or biomass feedstocks are involved.
Key Market Segments
By Technology
- Hydraulic Fracturing
- Horizontal Drilling
- CO2 Sequestration
- De-watering
By Application
- Power Generation
- Industrial Fuel and Feedstock
- Residential Heating
- Commercial Heating
- Transportation (CNG/LNG) 1299
By End-User
- Oil and Gas Companies
- Electric Utilities
- Mining Operators
- Chemical and Fertilizer Producers
- Gas Distribution Utilities
Driver Analysis
Record grain output and storage tightness
The near-term demand catalyst is the mismatch between harvest volumes, inventory carryover and usable storage rather than crop production alone. Global cereal output reached an estimated record range of roughly 3.0 billion tonnes in 2025, while FAO expects 2026 production to remain historically elevated at about 2.98 billion tonnes despite a projected 2.0% year-on-year reduction; this sustains peak-season pressure on receiving, drying and buffer-storage infrastructure.
In the United States, total on- and off-farm grain-storage capacity stood around 25.5 billion bushels at December 2025, but capacity growth was only about 56 million bushels, or 0.2%, during the year; on-farm capacity reached 13.6 billion bushels after just 25 million bushels of additions. The commercial consequence is a higher willingness to invest in incremental farm bins, high-throughput elevators, dryers, conveying systems and temporary-to-permanent storage conversion, particularly where producers can delay sales beyond harvest and capture basis or seasonal price improvement.
Drivers Impact Analysis
| Driver | (~) % Impact on CAGR Forecast | Geographic Relevance | Impact Timeline |
|---|---|---|---|
| Record grain output and storage tightness | +1.4 pp | North America, India, Brazil, Argentina | Short term (≤ 2 years) |
| Food-security silo programs and PPP procurement | +1.7 pp | India, South Asia, Africa, MENA | Medium term (2–4 years) |
| Loss reduction and grain-quality preservation | +1.2 pp | Sub-Saharan Africa, South Asia, ASEAN | Medium term (2–4 years) |
| Smart monitoring and automated aeration | +1.0 pp | North America, EU, China, Australia | Medium term (2–4 years) |
| Safety, dust-control and design compliance | +0.8 pp | North America, EU, China, GCC | Short term (≤ 2 years) |
| Trade-corridor resilience and bulk logistics | +0.9 pp | Black Sea, EU, Brazil, MENA, Asia | Long term (≥ 4 years) |
Restraint Analysis
Credit and farm-debt pressure
Restricted credit availability reduces the pool of farmers and commercial handlers able to convert storage demand into signed orders, particularly where projects are funded from seasonal cash flow rather than infrastructure-level financing. U.S. farm-sector debt is forecast to rise 5.2% to USD 624.7 billion in 2026, including USD 404.3 billion in real-estate debt and USD 220.4 billion in non-real-estate debt, while sector working capital is expected to decline 9.2% year on year.
Commercial operating-loan rates were still 7.50% in the Chicago Federal Reserve District and 7.78% in the St. Louis District during Q3 2025, raising the hurdle rate for discretionary on-farm capital expenditure. Subsidized alternatives mitigate but do not eliminate the constraint: U.S. Farm Storage Facility Loans carried 3.75–4.50% rates across three- to 12-year maturities in September 2025, but applicants generally require satisfactory credit, proof of repayment ability, insurance and a 15% builder/contractor down payment for many loan structures.
With 2026 farm production expenses projected at USD 477.7 billion, up USD 4.6 billion from 2025, capital budgets are increasingly diverted to inputs, land, debt service and liquidity protection, delaying silo upgrades despite clear storage-loss benefits.
Restraint Impact Analysis
| Restraint | (~) % Impact on CAGR Forecast | Geographic Relevance | Impact Timeline |
|---|---|---|---|
| High installed CapEx | -1.5 pp | North America, EU, APAC | Short term (≤ 2 years) |
| Credit and farm-debt pressure | -1.3 pp | North America, Brazil, Australia | Short term (≤ 2 years) |
| Steel and equipment volatility | -0.9 pp | Global, import-dependent APAC, Africa | Medium term (2–4 years) |
| Land, rail and permit delays | -1.1 pp | India, Africa, MENA, Latin America | Medium term (2–4 years) |
| Safety and compliance burden | -0.7 pp | North America, EU, China, GCC | Short term (≤ 2 years) |
| Climate and site-risk premiums | -0.6 pp | South Asia, ASEAN, Africa, coastal Americas | Long term (≥ 4 years) |
Opportunity Analysis
Storage-as-a-Service
In the United States, Farm Storage Facility Loans can finance up to USD 500,000 for permanent storage and handling assets, with February 2026 fixed rates of 3.625% for three years, 3.750% for five years, 4.000% for seven years, 4.125% for 10 years and 4.375% for 12 years, creating a benchmark against which private lessors can structure bundled finance, service and insurance offerings.
A provider financing a 50,000-bushel system at USD 4.0 per bushel, or about USD 200,000 installed, could target annualized customer charges of USD 0.30–0.45 per bushel while preserving an 8–12-year payback path through storage fees, handling charges and equipment-service revenue; pooled facilities can further raise utilization by serving multiple growers rather than one farm.
The upside is not a baseline driver because it requires lenders, OEMs, insurers, grain buyers and farmer cooperatives to share credit and utilization risk, but successful deployment could reduce customer initial cash outlay by 70–90%, lower acquisition friction and unlock demand among operators otherwise unable to finance permanent storage.
Opportunity Impact Analysis
| Opportunity | (~) % Potential CAGR Upside | Geographic Relevance | Execution Window |
|---|---|---|---|
| Storage-as-a-Service | +1.6 pp | India, Africa, ASEAN, Latin America | Medium term (2–4 years) |
| Smart retrofit subscriptions | +1.3 pp | North America, EU, Australia, China | Short term (≤ 2 years) |
| PACS micro-hub rollout | +1.8 pp | India, South Asia, East Africa | Medium term (2–4 years) |
| Post-harvest service bundles | +1.1 pp | Africa, ASEAN, Brazil, India | Medium term (2–4 years) |
| Low-carbon traceable silos | +0.9 pp | EU, UK, North America, GCC | Long term (≥ 4 years) |
| Regional M&A platform build | +1.0 pp | North America, EU, APAC, Latin America | Medium term (2–4 years) |
Challenges Analysis
Skilled Technician Scarcity
The practical effect is that a silo shell may be fabricated and delivered on schedule while electrical control panels, bucket elevators, level sensors, fan automation or commissioning remain incomplete for several weeks; for a mid-sized 20,000–50,000-tonne commercial facility, a 10–20 day commissioning extension can defer an entire harvest-season revenue window. Contractors then raise day rates, retain standby crews or subcontract specialist work, adding an estimated 4–8% to field-installation cost and increasing defect, rework and warranty exposure.
Long-term mitigation requires OEM-backed certification academies, standardized modular control systems, remote commissioning, augmented-reality work instructions, retention-linked pay structures and regional service hubs; companies that treat after-sales labour as a strategic capacity asset rather than a variable project expense will retain higher installation throughput and recurring-service margins.
Challenges Impact Analysis
| Challenge | (~) % CAGR Friction Drag | Geographic Relevance | Mitigation Horizon |
|---|---|---|---|
| Skilled technician scarcity | -1.0 pp | North America, EU, Australia, GCC | Long term (≥ 4 years) |
| Seasonal installation bottlenecks | -0.8 pp | North America, Europe, South America | Medium term (2–4 years) |
| Climate-resilient design gaps | -0.9 pp | South Asia, ASEAN, Africa, Americas | Long term (≥ 4 years) |
| Fragmented automation standards | -0.7 pp | North America, EU, China, APAC | Medium term (2–4 years) |
| Last-mile logistics volatility | -0.8 pp | Africa, India, Latin America, MENA | Medium term (2–4 years) |
| Dust-safety execution risk | -0.6 pp | North America, EU, China, Brazil | Long term (≥ 4 years) |
Geopolitical Impact Analysis
The continuing Russia-Ukraine war remains a major geopolitical pressure on the grain silos and storage system market. USDA reported that Ukrainian grain exports during July-December 2025 were about 30% slower than a year earlier, showing how conflict-related logistics constraints can increase storage duration and inventory pressure.
The situation also creates investment opportunities in safer, flexible storage infrastructure. In April 2026, around 90% of Ukraine’s grain, oilseed and related exports still moved through the Black Sea, while EU Solidarity Lanes handled roughly 10%. USDA’s August 2026 outlook reduced Ukraine’s 2026/27 corn export forecast from 23 million tonnes to 22 million tonnes and barley exports from 2.3 million tonnes to 2.1 million tonnes because of expected disruption from increased Black Sea hostilities.
Regional Insights
Asia Pacific Dominates with 36.40% Share and USD 0.64 Billion Market Value
In 2025, Asia Pacific held a dominant market position, capturing more than a 36.40% share and generating about USD 0.64 billion. The region benefits from large grain harvests, expanding food demand and continuous investment in storage, drying and bulk-handling infrastructure.
In China, total grain production reached 714.9 million tonnes during 2025/26, including 301.2 million tonnes of corn and 140.1 million tonnes of wheat. These large volumes create consistent demand for commercial silos, temperature monitoring, aeration and automated handling equipment.
Government estimates placed Australian wheat production at nearly 36 million tonnes in 2025/26, while barley production reached a record 16.3 million tonnes. High harvest volumes, export-oriented farming and seasonal production swings encourage investment in additional on-farm bins, large terminal silos and efficient grain-loading systems.
Key Regions and Countries Insights
- North America
- US
- Canada
- Europe
- Germany
- France
- The UK
- Spain
- Italy
- Rest of Europe
- Asia Pacific
- China
- Japan
- South Korea
- India
- Australia
- Rest of APAC
- Latin America
- Brazil
- Mexico
- Rest of Latin America
- Middle East & Africa
- GCC
- South Africa
- Rest of MEA
Key Players Analysis
Ag Growth International (AGI) remains a supplier of grain storage, handling, conditioning and monitoring systems for farm and commercial customers. In 2025, its fourth-quarter revenue reached CAD 396 million, up 4% year over year, while its year-end order book stood at CAD 543 million. AGI offers grain bins, bucket elevators, conveyors, aeration systems and digital monitoring solutions, giving it a broad position across storage projects. Its commercial business also serves grain elevators, food processors and ethanol producers across worldwide markets.
GSI is a well-established grain storage and handling brand serving commercial and farm customers with grain bins, dryers, material-handling equipment and control systems. Following AGCO’s divestiture, GSI became part of Grain & Protein Technologies under American Industrial Partners in November 2024. The transaction valued AGCO’s majority Grain & Protein business at USD 700 million. Grain & Protein Technologies now markets GSI and other agricultural equipment brands in more than 100 countries through a network of over 1,000 independent dealers globally.
AGCO Corporation remains a global agricultural machinery company, although its direct exposure to grain silos changed after it sold the majority of its Grain & Protein business, including GSI, in November 2024 for USD 700 million. In 2025, AGCO recorded net sales of USD 10.082 billion and net income of USD 726.5 million. The company distributes agricultural machinery and precision farming solutions through approximately 2,800 independent dealers and distributors across about 140 countries, maintaining broad access to farming customers worldwide.
Top Key Players Outlook
- Ag Growth International (AGI)
- GSI (Grain Systems, Inc./AGCO)
- AGCO Corporation
- Sukup Manufacturing Co.
- Symaga S.A.
- Bühler Group
- CTB, Inc. (Berkshire Hathaway)
- Brock Grain Systems
- Silos Córdoba S.L.
- Chief Industries Inc. (Chief Agri)
- Mysilo (SFA/Altuntaş Group)
- SCAFCO Grain Systems Co.
- Sioux Steel Company
- Cimbria A/S (AGCO)
- Kepler Weber S.A.
Recent Developments
- In 2025, Sukup reported 800+ employees, products operating in 90+ countries, more than 125 patents, and about 50% sales growth over the previous 5 years, showing continued scale and innovation in grain storage systems.
- July 2026, when Symaga introduced S450GD steel for its feed silos, increasing yield strength from 350 N/mm² to 450 N/mm², while expanding its 3.80-meter silo range to capacities of up to 86 m³.
- In May 2026, Silos Córdoba expanded a German milling customer’s storage site with a 15-meter-diameter flat-bottom wheat silo offering about 3,100 tonnes of capacity, along with ventilation, temperature probes and management software for improved grain preservation.
Report Scope
| Report Features | Description |
|---|---|
| Market Value (2025) | USD 1.7 Bn |
| Forecast Revenue (2035) | USD 3.0 Bn |
| CAGR (2026-2035) | 5.7% |
| Base Year for Estimation | 2025 |
| Historic Period | 2020-2024 |
| Forecast Period | 2026-2035 |
| Report Coverage | Revenue Forecast, Market Dynamics, Competitive Landscape, Recent Developments |
| Segments Covered | By Technology (Hydraulic Fracturing, Horizontal Drilling, CO2 Sequestration, De-watering), By Application (Power Generation, Industrial Fuel and Feedstock, Residential Heating, Commercial Heating, Transportation (CNG/LNG) 1299), By End-User (Oil and Gas Companies, Electric Utilities, Mining Operators, Chemical and Fertilizer Producers, Gas Distribution Utilities) |
| Regional Analysis | North America – US, Canada; Europe – Germany, France, The UK, Spain, Italy, Rest of Europe; Asia Pacific – China, Japan, South Korea, India, Australia, Singapore, Rest of APAC; Latin America – Brazil, Mexico, Rest of Latin America; Middle East & Africa – GCC, South Africa, Rest of MEA |
| Competitive Landscape | Ag Growth International (AGI), GSI (Grain Systems, Inc./AGCO), AGCO Corporation, Sukup Manufacturing Co., Symaga S.A., Bühler Group, CTB, Inc. (Berkshire Hathaway), Brock Grain Systems, Silos Córdoba S.L., Chief Industries Inc. (Chief Agri), Mysilo (SFA/Altuntaş Group), SCAFCO Grain Systems Co., Sioux Steel Company, Cimbria A/S (AGCO), Kepler Weber S.A. |
| Customization Scope | Customization for segments, region/country-level will be provided. Moreover, additional customization can be done based on the requirements. |
| Purchase Options | We have three licenses to opt for: Single User License, Multi-User License (Up to 5 Users), Corporate Use License (Unlimited User and Printable PDF) |





































