


Report Overview
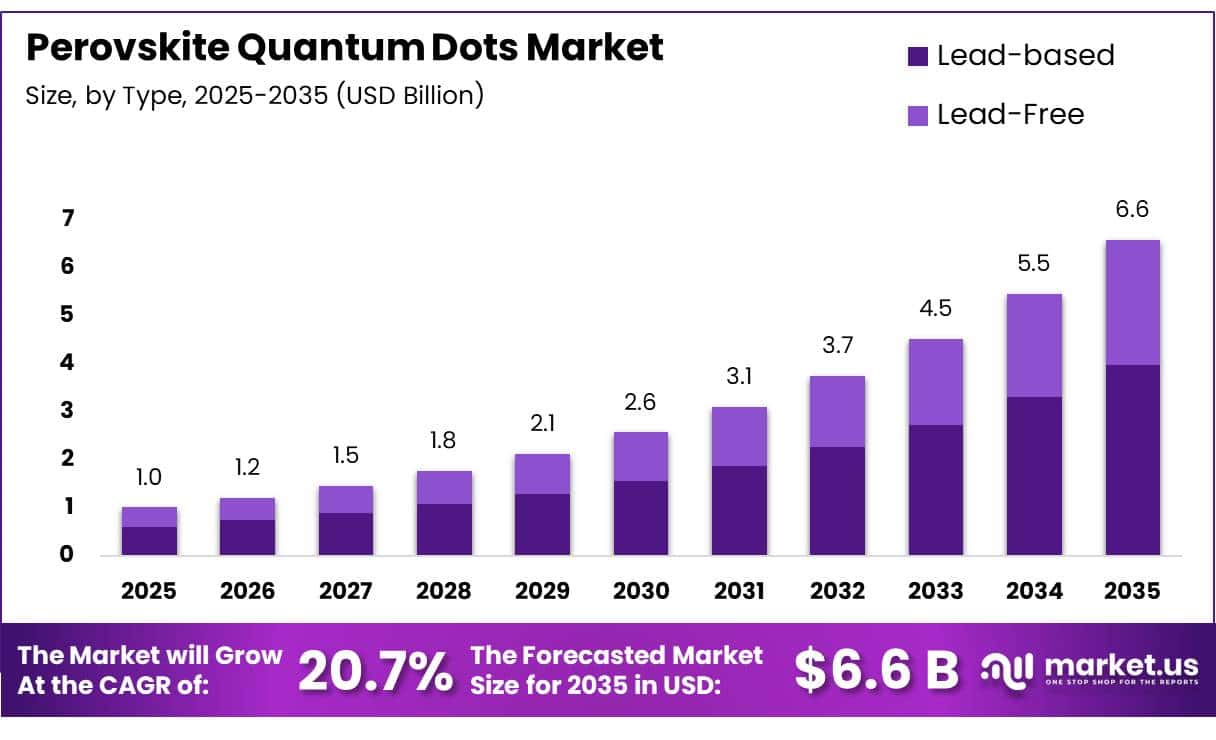
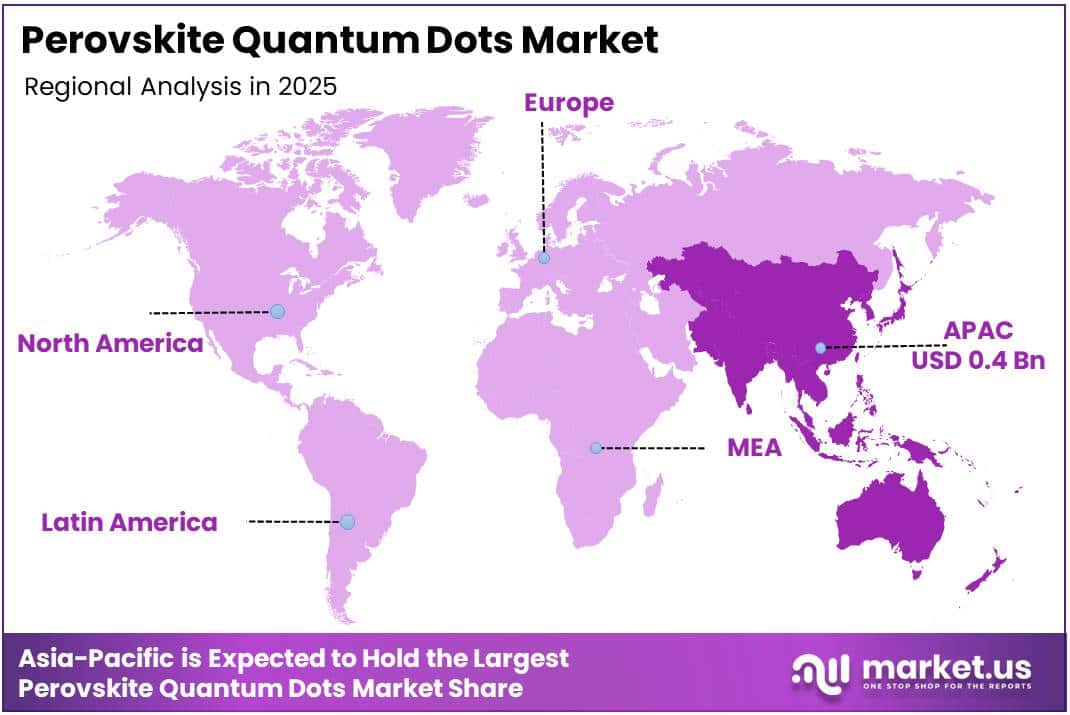
In 2025, the Global Perovskite Quantum Dots Market was valued at USD 1.0 billion, and between 2026 and 2035, this market is estimated to register a CAGR of 20.7%, reaching about USD 6.6 billion by 2035. In 2025, Asia-Pacific led the market, achieving over 41.3% share with a revenue of USD 0.4 Billion.
Perovskite quantum dots are emerging as an advanced class of semiconductor nanomaterials for photovoltaics, light-emitting devices, photodetectors, sensors, and other optoelectronic systems. Their main industrial advantage comes from tunable optical properties, strong light absorption, solution-based processing, and compatibility with relatively low-temperature manufacturing.
- National Renewable Energy Laboratory research has reported perovskite quantum dot solar-cell efficiencies of 16.6%, while broader perovskite technology reached about 27% single-junction efficiency and more than 34.5% for perovskite-silicon tandem cells in laboratory development during 2025. These results strengthen the technical case for quantum-dot-based absorber and interface technologies in future high-efficiency devices.
Key Takeaways
- The Global Perovskite Quantum Dots Market was valued at USD 1.0 billion in 2025.
- The market is projected to grow at a CAGR of 20.7% and is estimated to reach USD 6.6 billion by 2035.
- On the basis of Type, Lead-based dominated the market, constituting 60.6% of the total market share.
- Based on the Application, Solar Cells dominated the market, with a substantial market share of around 34.8%.
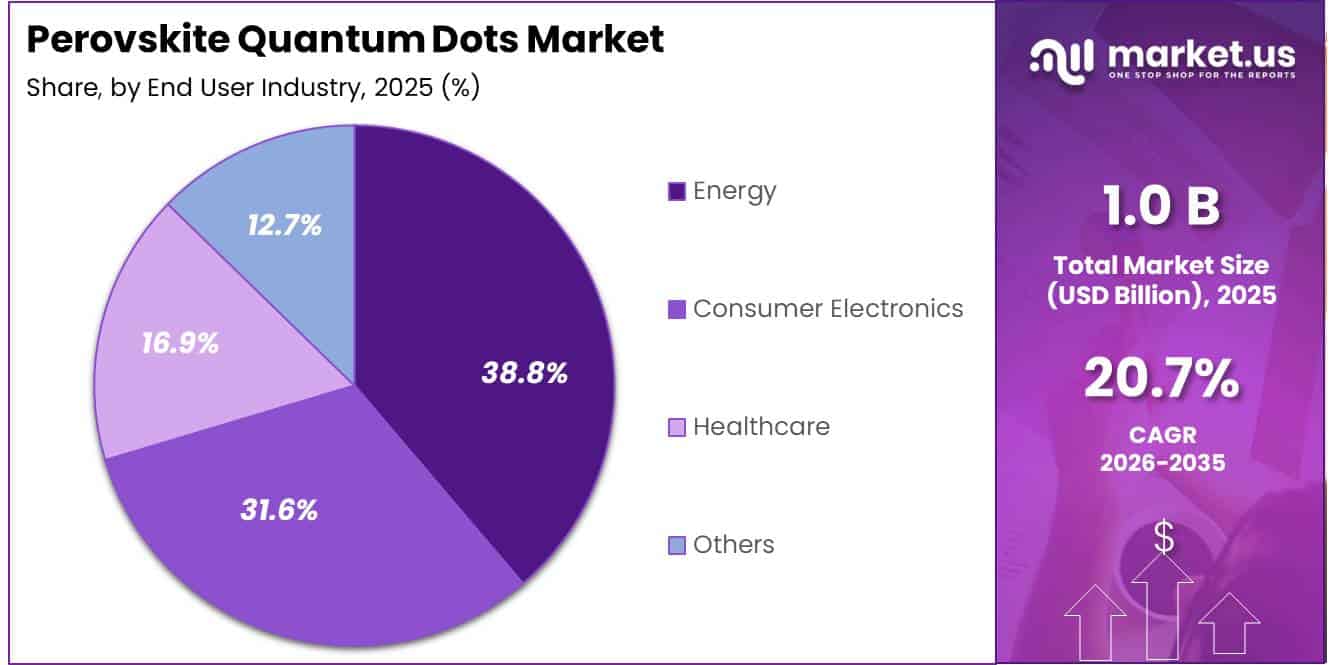
- Based on the End User Industry, Energy led the market, comprising 38.8% of the total market.
- In 2025, Asia-Pacific was the most dominant region in the market, accounting for 41.3% of the total global consumption.
The industrial environment is becoming increasingly favorable as solar photovoltaic deployment continues to expand worldwide. According to the International Energy Agency, global renewable capacity additions reached about 800 GW in 2025, while solar PV installations exceeded 600 GW for the first time. This expansion lifted cumulative global solar PV capacity to roughly 2,800 GW. Such rapid deployment creates a large technology base for next-generation materials capable of improving power density, reducing material consumption, and supporting lightweight or flexible photovoltaic products.
- IEA data show that solar PV generation increased by around 600 TWh in 2025, while renewable sources supplied approximately 34% of global electricity generation. Wind and solar PV together represented about 17% of worldwide electricity output. Rising renewable penetration is encouraging manufacturers and research organizations to pursue higher-efficiency photovoltaic materials that can produce more electricity from limited surface area.
Commercial development, however, will depend heavily on durability, manufacturing consistency, environmental protection, and large-area processing. In April 2025, an NREL-led perovskite study demonstrated approximately 26% laboratory efficiency with only around 2% degradation after 2,100 hours of continuous operation under elevated-temperature testing. At the policy level, the U.S. Department of Energy’s FY2025-27 solar laboratory program also includes dedicated work on perovskite-enabled tandems and scalable vapor-transport deposition of metal-halide perovskites.
The IEA expects nearly 4,600 GW of additional renewable capacity during 2025-2030, with solar PV representing almost 80% of worldwide renewable electricity expansion. Competitive auctions are also expected to account for nearly 60% of utility-scale renewable additions over the period, increasing pressure on technology suppliers to reduce electricity costs and improve output. Within this environment, perovskite quantum dots could gain importance in tandem photovoltaics, flexible solar products, building-integrated PV, LEDs, photodetectors, and printable optoelectronics, provided that stability, lead management, encapsulation, and scalable production continue to improve.
Type Analysis
Lead-based dominates with 60.6% share, supported by stronger optoelectronic performance
In 2025, Lead-based held a dominant market position, capturing more than a 60.6% share. The segment remained widely preferred because lead-halide compositions such as CsPbBr₃, CsPbI₃, and FAPbI₃ provide strong light absorption, efficient charge transport, tunable emission, and good solution processability for solar cells, LEDs, displays, and other optoelectronic devices.
- In June 2025, a study indexed by the U.S. National Institutes of Health reported that cesium-formamidinium lead triiodide perovskite quantum-dot solar cells reached a power-conversion efficiency of 18.17%, highlighting the strong device potential of lead-containing PQDs.
Another 2025 study available through NIH’s PubMed database reported that CsPbBr₃ quantum-dot films achieved a photoluminescence quantum yield of up to 78.64%, while the resulting QLED reached an external quantum efficiency of 9.67%. These results support the continued technical preference for lead-based materials where brightness, emission quality, and conversion performance are major requirements.
Application Analysis
Solar Cells dominate with 34.8% as rising photovoltaic capacity strengthens demand for advanced light-harvesting materials
In 2025, Solar Cells held a dominant market position, capturing more than a 34.8% share of the Perovskite Quantum Dots Market by application. Their strong position is supported by growing interest in perovskite quantum dots for improving light absorption, wavelength control, and energy conversion in next-generation photovoltaic devices. Government data also shows a rapidly expanding solar installation base.
- The U.S. Energy Information Administration reported that total U.S. solar photovoltaic capacity reached 209,304.0 MW in 2025 and increased to 222,690.5 MW by May 2026. This expanding photovoltaic base creates a favorable environment for advanced materials that can improve solar-cell performance and support lightweight and flexible photovoltaic designs.
Lasers is the fastest growing segment in the Perovskite Quantum Dots Market by application. In 2026, development activity is being supported by the strong optical properties of perovskite quantum dots, including narrow light emission, adjustable wavelengths, high brightness, and efficient interaction with light. These characteristics make the material suitable for compact lasers, optical communication systems, sensing equipment, integrated photonics, and other precision optoelectronic devices.
End User Industry Analysis
Energy dominates the Perovskite Quantum Dots Market with a 38.8% share, supported by expanding solar power generation
In 2025, Energy held a dominant market position, capturing more than a 38.8% share. The segment benefits from growing interest in perovskite quantum dots for photovoltaic applications, where their tunable optical properties and solution-based processing can support next-generation solar technologies. The U.S. Department of Energy also identifies quantum dots as semiconductor materials that can be combined with perovskites for advanced solar cells.
- The U.S. Energy Information Administration reported that utility-scale solar generation reached 296,000 GWh in 2025, while small-scale solar systems generated another 93,000 GWh. This expanding solar power base creates a favorable environment for continued research and eventual commercial use of perovskite quantum dot materials in energy conversion systems.
Consumer Electronics is the fastest growing segment in the Perovskite Quantum Dots Market. In 2025, the segment continued to attract attention because perovskite quantum dots offer adjustable light-emission characteristics that can be useful in displays, LEDs, and other compact optoelectronic devices. Their ability to tune emitted light through material composition gives manufacturers greater flexibility when developing brighter and more efficient display technologies.
Key Market Segments
By Type
- Lead-based
- Lead-Free
By Application
- Solar Cells
- Light-Emitting Diodes (LEDs)
- Photodetectors
- Lasers
- Others
By End User Industry
- Energy
- Consumer Electronics
- Healthcare
- Others
Driver Analysis
US DOE Section 45X Advanced Manufacturing Production Credit
Section 45X of the Internal Revenue Code, enacted under the Inflation Reduction Act and administered via IRS Form 7207, provides a per-unit production credit for domestically manufactured solar components $0.04 per watt of cell capacity for thin-film or crystalline photovoltaic cells and $0.07 per watt-equivalent for completed modules with eligibility explicitly open to perovskite-silicon tandem cell producers manufacturing and selling to unrelated parties after 31 December 2022.
NREL’s certified efficiency milestones a 27.3% single-junction and a 35.0% perovskite-silicon tandem record as of 2025, alongside NREL/CubicPV’s 24.0% certified minimodule announced in mid-2025 provide the underlying technology-readiness signal that is converting 45X eligibility from a theoretical incentive into bankable unit economics for tandem module producers.
Because 45X credits phase toward zero for wind by 2027 but remain uncapped in duration for solar-linked components through 2032 tax years absent further legislative change, the incremental CAGR benefit is structurally weighted to a medium-term (2-4 year) window during which manufacturers scale tandem capacity to capture the credit before any renewal-cycle uncertainty resurfaces.
Driver Impact Analysis
| Driver | (~) % Impact on CAGR Forecast | Geographic Relevance | Impact Timeline |
|---|---|---|---|
| EU RoHS cadmium-QD exemption sunset forcing Cd-free PQD substitution | +2.8% | EU core, EU-adjacent EEA/UK compliance corridors | Short term (≤ 2 years) |
| US DOE Section 45X advanced manufacturing production credit for solar components incl. perovskite tandems | +2.2% | North America core (US), Canada spill-over via IRA-aligned supply chains | Medium term (2-4 years) |
| China MOFCOM rare-earth/critical-mineral export licensing | +1.6% | APAC corridors (China origin), global downstream importers (EU, US, Korea, India) | Short term (≤ 2 years) |
| India PLI Scheme for High-Efficiency Solar PV Modules | +1.9% | APAC core (India), South Asia spill-over | Medium term (2-4 years) |
| Korea national strategic technology tax credit for QD/OLED/microLED | +1.4% | APAC core (South Korea), East Asia display supply chain | Long term (≥ 4 years) |
| EU Critical Raw Materials Act domestic indium/gallium capacity benchmarks | +1.1% | EU core, EU-linked APAC/African mineral-sourcing partners | Long term (≥ 4 years) |
Restraint Analysis
Cadmium Restriction Under RoHS Annex III (Exemptions 39a/39b)
The mechanism here is a hard regulatory deadline: RoHS Annex III Exemption 39(a), which had permitted cadmium selenide-based quantum dots in display backlighting above the standard 100 ppm homogeneous-material threshold, formally expired on 21 November 2025 following an 18-month grace period triggered by Delegated Directive (EU) 2024/1416’s publication on 21 May 2024, while the narrower replacement Exemption 39(b) restricts cadmium use to on-chip color conversion at under 5 micrograms of cadmium per mm² of LED chip surface and a hard cap of 1 mg per device, expiring again on 31 December 2027.
The quantitative bottleneck is a near-total reformulation cycle: any QD film, adhesive, or encapsulant sold in the EU after November 2025 must now meet the same 100 ppm cadmium ceiling applied to bulk homogeneous materials, effectively forcing suppliers who previously relied on higher-loading CdSe formulations into a costly transition toward heavy-metal-free indium phosphide or perovskite-based alternatives that, per market signals, already commanded over 70% share of cadmium-free demand by late 2025.
The strategic impact is a compressed compliance window of roughly 12-18 months for non-compliant SKUs to exit EU shelves, triggering inventory write-downs, accelerated qualification testing cycles (typically 6-9 months per new formulation), and a competitive tailwind for PQD producers positioned to capture displaced cadmium-QD demand, provided they can scale production fast enough to avoid supply gaps during the transition.
Restraint Impact Analysis
| Restraint | (~) % Impact on CAGR Forecast | Geographic Relevance | Impact Timeline |
|---|---|---|---|
| Lead (Pb) toxicity & REACH/RoHS regulatory tightening | -2.8% | EU core; spillover to UK, South Korea via harmonized rules | Medium term (2-4 years) |
| Cadmium restriction under RoHS Annex III (39a/39b) | -1.6% | EU core; export-dependent APAC manufacturers (China, South Korea, Taiwan) | Short term (≤2 years) |
| China critical-mineral export controls (In, Ga, Ge, rare earths) | -2.2% | Global; US and EU import-dependent supply chains, China as origin | Short term (≤2 years) |
| US Section 301 tariffs on China-origin inputs/components | -1.4% | North America core; China-linked upstream supply | Medium term (2-4 years) |
| Long-term operational/environmental stability of PQDs | -1.9% | Global; APAC manufacturing hubs, EU deployment markets | Long term (≥4 years) |
| Indium/rare-earth substrate supply concentration & criticality | -1.1% | Global; US 100% import reliance, EU import dependency | Medium term (2-4 years) |
Opportunity Analysis
Tandem Perovskite-Silicon Photovoltaic Co-Integration for Utility Solar
The U.S. Energy Information Administration projects a record 43.4 GW of new utility-scale solar PV capacity in 2026, a 60% year-on-year increase, with solar accounting for 51% of all new generation capacity additions, while NREL-certified perovskite-silicon tandem cells have already reached 35.0% conversion efficiency in laboratory settings; the opportunity is not the current silicon build-out itself but the largely uncaptured total addressable market for retrofitting or co-locating perovskite quantum dot tandem layers onto the 25.3 GW of solar cells currently under construction in the U.S. domestic pipeline, which today are being built with mono-crystalline silicon architectures that leave 8-10 percentage points of theoretical efficiency headroom unmonetized.
Capturing even 10-15% of this under-construction pipeline for tandem retrofitting or hybrid-line integration could unlock an estimated $3.5-5 billion incremental TAM in the U.S. alone by 2030, with unit economics shifting favorably as levelized cost of electricity for tandem modules could decline by 12-18% per watt through efficiency gains outpacing marginal manufacturing cost increases of only 6-9% per NREL device-architecture cost modeling benchmarks.
Opportunity Impact Analysis
| Opportunity | (~) % Potential CAGR Upside | Geographic Relevance | Execution Window |
|---|---|---|---|
| Cadmium-free QD licensing arbitrage post-RoHS 39(a) expiry | +2.2% | EU core, UK, EEA-aligned markets | Short term (≤2 years) |
| Tandem PQD-silicon photovoltaic co-integration for utility solar | +3.1% | North America (US utility-scale), APAC manufacturing hubs | Medium term (2-4 years) |
| SWIR sensing and machine-vision adjacent TAM expansion | +1.9% | North America (defense/industrial), EU, East Asia | Medium term (2-4 years) |
| Domestic non-China indium/gallium refining roll-up | +2.6% | North America, EU, allied APAC (Japan, South Korea, Australia) | Long term (≥4 years) |
| On-chip micro-LED cadmium color-conversion licensing (Exemption 39(b) window) | +1.6% | EU, South Korea, China (export) | Short term (≤2 years) |
| Lead-free/double-perovskite QD IP consolidation via M&A | +2.0% | Global, with EU and North America as first-mover buyers | Long term (≥4 years) |
Challenges Analysis
Critical Mineral Supply Exposure
The root vulnerability sits upstream: indium, gallium, and germanium all formally designated on the U.S. Geological Survey’s Final 2025 List of Critical Minerals covering 60 minerals feed directly into cadmium-free perovskite quantum dot precursor chemistries, and China’s Ministry of Commerce licensing regime, first imposed in July 2023 and escalated to an outright export ban on gallium, germanium, and antimony to the United States in December 2024, drove monthly Chinese gallium exports from roughly 6,876 kg to 227 kg and germanium exports from 7,965 kg to 590 kg within a single quarter; even with partial licensing normalization reported into late 2025, the residual customs-verification lag now averages an estimated 35-50 days per shipment for indium and gallium-bearing precursors moving through APAC-to-Western fabrication corridors, forcing PQD manufacturers to hold 60-90 days of buffer inventory against a historical norm of 30 days, which inflates working-capital costs by an estimated 8-12% per unit even as production continues uninterrupted; the strategic adjustment required is a dual-sourcing posture that qualifies non-Chinese indium and gallium refiners while simultaneously accelerating cadmium-free, indium-lean quantum dot formulations to structurally reduce single-country input concentration over a four-plus-year horizon.
Challenges Impact Analysis
| Challenge | (~) % CAGR Friction Drag | Geographic Relevance | Mitigation Horizon |
|---|---|---|---|
| Critical mineral supply exposure | -1.6% | China production hubs; APAC logistics corridors; North America/EU import-dependent fabs | Long term (≥ 4 years) |
| Cadmium/lead regulatory compliance drift | -1.1% | EU regulatory hubs; Japan/South Korea electronics clusters | Medium term (2-4 years) |
| Colloidal-synthesis skilled talent deficit | -0.9% | North America core; EU R&D clusters; East Asia fabs | Long term (≥ 4 years) |
| Batch-to-batch encapsulation yield variance | -1.3% | Global manufacturing nodes; APAC contract manufacturers | Medium term (2-4 years) |
| Domestic-content and tariff compliance friction | -0.8% | North America core (US); allied trade-agreement partners | Short term (≤ 2 years) |
| Export-license and dual-use customs delays | -0.7% | China–US corridor; APAC logistics corridors; EU import terminals | Medium term (2-4 years) |
Geopolitical Impact Analysis
Ongoing Wars Disrupt Supply Chains and Raise Costs for the Perovskite Quantum Dots Market
The Perovskite Quantum Dots market is facing fresh geopolitical pressure as the Russia-Ukraine war continues and renewed conflict in the Middle East disrupts shipping, energy flows, and industrial supply chains. Perovskite quantum dots depend on specialty chemicals, halide salts, solvents, substrates, encapsulation materials, and precision equipment sourced through globally connected manufacturing networks. Higher fuel prices and longer freight routes can therefore raise production costs and delay laboratory, pilot-line, and commercial deliveries.
In July 2026, the United Nations reported that average ship transits through the Strait of Hormuz had fallen to about five per day, compared with nearly 130 before the war, a decline of more than 95%. UNCTAD also estimated that traded-goods prices rose about 5% in the second quarter of 2026, partly because of higher energy and transport costs linked to the disruption. These conditions can slow investment decisions for emerging perovskite quantum-dot applications in solar cells, displays, photodetectors, and advanced sensing.
At the same time, governments are pushing for safer domestic supply chains. In August 2025, the U.S. Department of Energy announced nearly $1 billion in planned funding to strengthen domestic critical-mineral and material processing, supporting longer-term supply resilience for advanced clean-energy technologies and reduce external sourcing risks.
Regional Analysis
Asia-Pacific remains the dominant regional market
In 2025, Asia-Pacific held a dominant position in the Perovskite Quantum Dots Market, capturing more than a 41.3% share and reaching approximately USD 0.4 billion. The region benefits from a strong solar manufacturing base, expanding optoelectronics research, and growing investment in next-generation photovoltaic materials.
- China added around 317 GW of photovoltaic capacity during 2025, taking total solar installations to about 1.2 TW by December. Solar generation also reached approximately 1.17 trillion kWh, rising 40% during the year. These developments provide a large commercialization base for perovskite quantum dots in solar cells, LEDs, sensors, and advanced display applications.
North America is expected to record the fastest growth as research laboratories and technology developers continue improving perovskite and quantum-dot performance for commercial applications. In April 2025, U.S. National Renewable Energy Laboratory researchers demonstrated perovskite cells with 26.1% initial laboratory efficiency, while another device maintained around 26% efficiency with only about 2% degradation after 2,100 hours of operation.
- The wider solar industry also provides a strong application environment. U.S. developers installed 12 GW of utility-scale solar capacity during the first half of 2025 and planned another 21 GW during the second half.
Key Regions and Countries Covered
- North America
- The US
- Canada
- Europe
- Germany
- France
- The UK
- Spain
- Italy
- Russia & CIS
- Rest of Europe
- APAC
- China
- Japan
- South Korea
- India
- ASEAN
- Rest of APAC
- Latin America
- Brazil
- Mexico
- Rest of Latin America
- Middle East & Africa
- GCC
- South Africa
- Rest of MEA
Key Players Analysis
Hunt Perovskite Technologies built its position around stable metal-halide perovskite materials for single-junction and tandem solar modules. The U.S. Department of Energy awarded the company $2.5 million, supported by $2 million in cost share, for slot-die-coated modules targeting efficiency above 20%. In 2021, HPT merged with 1366 Technologies to form CubicPV, which received $25 million in new funding.
Swift Solar is advancing lightweight perovskite tandem technology for higher-efficiency solar generation. In 2024, the company closed a $27 million Series A round to expand development and U.S. manufacturing. During 2025, Swift partnered with American Tower to evaluate its technology across a network of 42,000 U.S. communication sites. The company highlights perovskite-silicon tandem cell efficiencies around 34.8%, compared with 27.3% for record silicon cells, supporting its strategy to deliver roughly 30% more power from a similar installation footprint today.
Energy Materials Corporation focuses on high-speed roll-to-roll manufacturing for scalable perovskite photovoltaic products. Its GigaSpeed platform is designed to print all 7 solar-cell layers at speeds above 30 meters, or 100 feet, per minute. Earlier U.S. Department of Energy support included a $2 million award, followed by about $4 million in additional funding for manufacturing development. EMC states that its production model is designed to support solar deployment toward 75 TW by 2050 while reducing capital intensity and manufacturing bottlenecks.
UbiQD is one of the clearest commercial participants linking quantum dots with perovskite-based solar materials. In February 2025, it acquired substantially all assets of BlueDot Photonics, including perovskite quantum-cutting technology that could raise silicon-panel efficiency by up to 16%. In April 2025, UbiQD raised $20 million in Series B funding. A July 2025 First Solar supply agreement could lift production beyond 100 metric tons annually, while a further $6 million financing in November supported manufacturing equipment and facility expansion capacity.
The Major Players in the Industry
- Quantum Solutions
- Saule Technologies
- Oxford Photovoltaics
- Microquanta Semiconductor
- Solaronix
- Dyesol
- G24 Power Ltd.
- FrontMaterials Co. Ltd.
- Hunt Perovskite Technologies
- Swift Solar
- Greatcell Solar
- Energy Materials Corporation
- Heliatek GmbH
- NanoPhotonica
- UbiQD
- Other Key Players
Key Development
- In June 2026, Oxford PV partnered with Fraunhofer ISE to demonstrate 491-watt and 546-watt tandem modules, both reaching 25.6% efficiency. Oxford PV also held more than 400 granted patents by early 2026, strengthening its licensing and technology position.
- In January 2025, Quantum Solutions worked with AY Sensors on QDot™ CsPbBr₃ perovskite single crystals for next-generation X-ray and gamma-ray detectors. Tests showed detector linearity of R² = 0.9995 across an X-ray dose range of 0.08–33.60 μGy air s⁻¹, sensitivity above 2,000 μC Gy air⁻¹ cm⁻², and a detection limit of 11 nGy air s⁻¹ at 10 V.
Report Scope
| Report Features | Description |
|---|---|
| Market Value (2025) | USD 1.0 Bn |
| Forecast Revenue (2035) | USD 6.6 Bn |
| CAGR (2026-2035) | 20.7% |
| Base Year for Estimation | 2025 |
| Historic Period | 2020-2024 |
| Forecast Period | 2026-2035 |
| Report Coverage | Revenue Forecast, Market Dynamics, Competitive Landscape, Recent Developments |
| Segments Covered | By Type (Lead-based, Lead-Free), By Application (Solar Cells, Light-Emitting Diodes (LEDs), Photodetectors, Lasers, Others), and By End User Industry (Energy, Consumer Electronics, Healthcare, Others) |
| Regional Analysis | North America – The US & Canada; Europe – Germany, France, The UK, Spain, Italy, Russia & CIS, Rest of Europe; APAC– China, Japan, South Korea, India, ASEAN & Rest of APAC; Latin America– Brazil, Mexico & Rest of Latin America; Middle East & Africa– GCC, South Africa, & Rest of MEA |
| Competitive Landscape | Quantum Solutions, Saule Technologies, Oxford Photovoltaics, Microquanta Semiconductor, Solaronix, Dyesol, G24 Power Ltd., FrontMaterials Co. Ltd., Hunt Perovskite Technologies, Swift Solar, Greatcell Solar, Energy Materials Corporation, Heliatek GmbH, NanoPhotonica, UbiQD, Other Key Players |
| Customization Scope | Customization for segments, region/country-level will be provided. Moreover, additional customization can be done based on the requirements. |
| Purchase Options | We have three licenses to opt for: Single User License, Multi-User License (Up to 5 Users), Corporate Use License (Unlimited Users and Printable PDF) |





































