


Report Overview
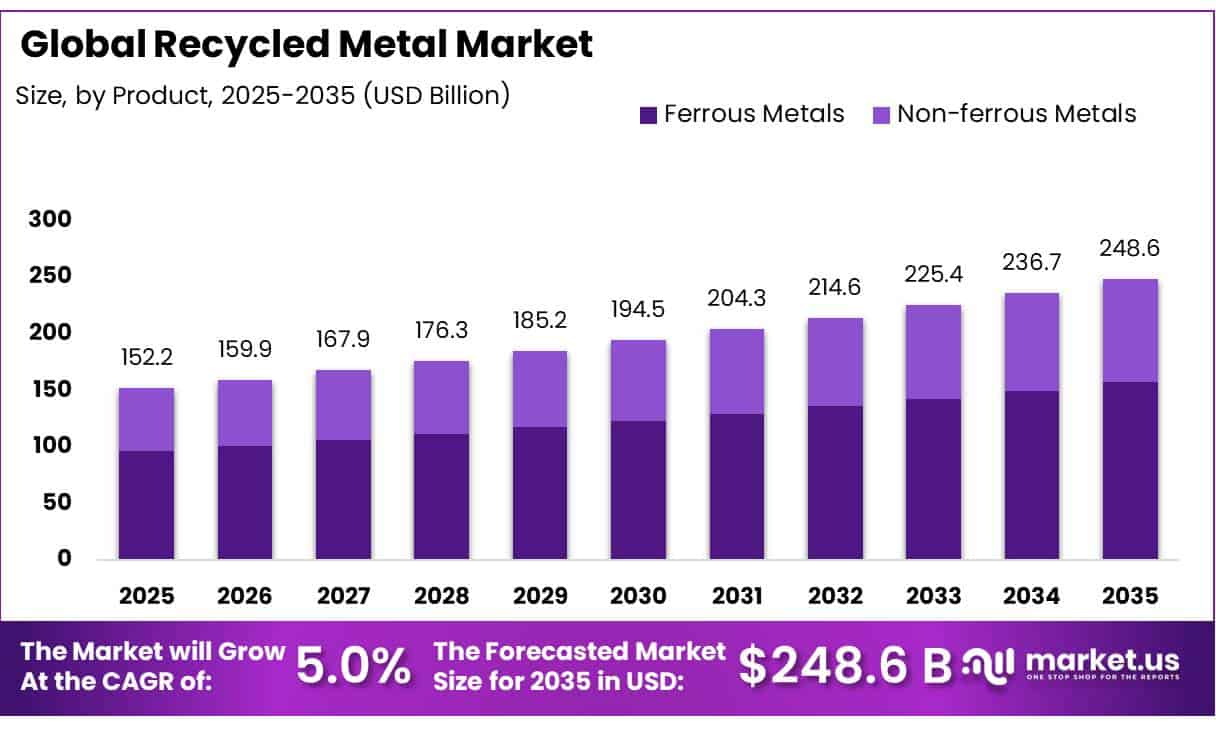
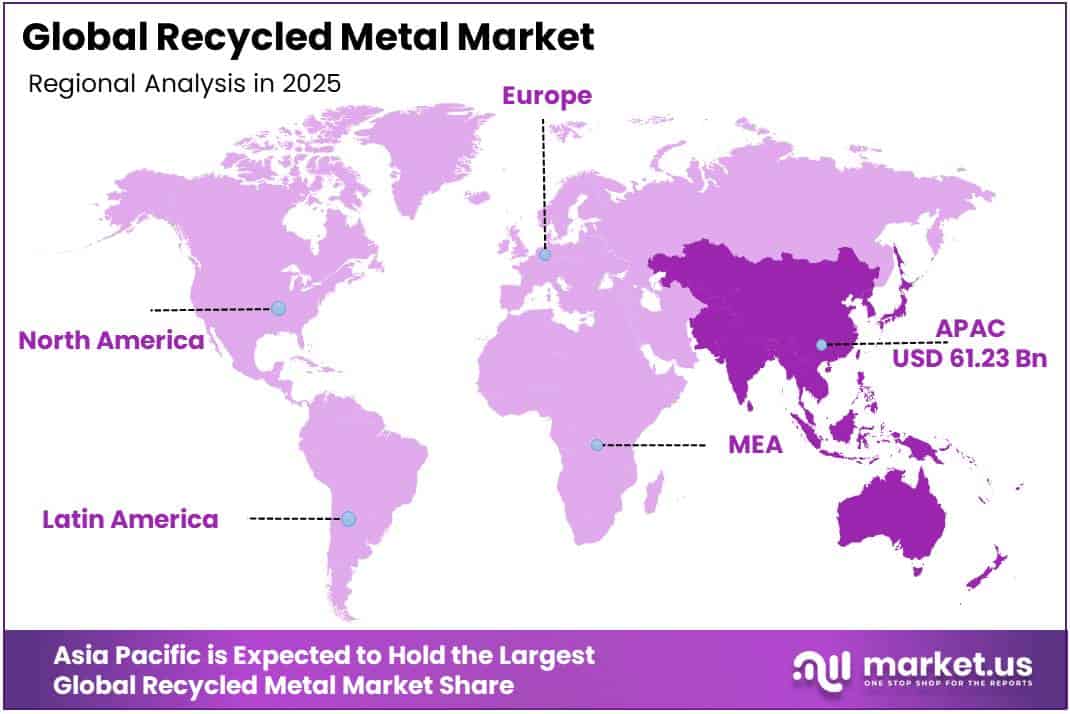
In 2025, the Global Recycled Metal Market was valued at USD 152.2 billion, and between 2026 and 2035, this market is estimated to register a CAGR of 5.0%, reaching about USD 248.6 billion by 2035. Asia Pacific held a dominant market position, capturing more than a 40.2% share, holding USD 61.23 billion in revenue.
The recycled metal industry is an important part of modern manufacturing because steel, aluminum, copper, lead and other recovered metals can return to production instead of being discarded.
- In 2025, U.S. apparent consumption of iron and steel scrap reached 57 million metric tons, while raw steel production totaled 82 million metric tons. The U.S. Geological Survey valued domestic iron and steel scrap purchases at $19.7 billion, showing the commercial importance of secondary metal feedstock.
Key Takeaways
- The global recycled metal market was valued at USD 152.2 billion in 2025.
- The global market is projected to grow at a CAGR of 5.0% and is estimated to reach USD 248.6 billion by 2035.
- On the basis of product, ferrous metals dominated the market, constituting 63.45% of the total market share.
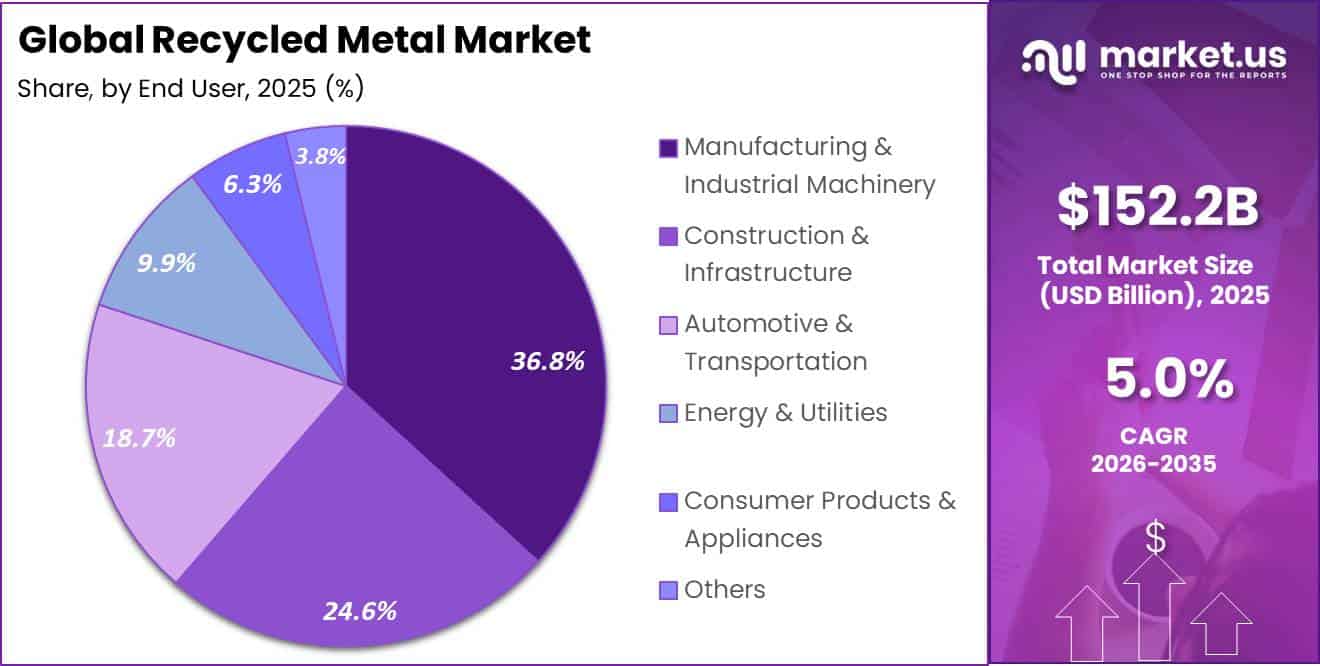
- Based on the end user, manufacturing & industrial machinery dominated the recycled metal market, with a substantial market share of around 36.78%.
- In 2025, Asia-Pacific was the most dominant region in the recycled metal market, accounting for 40.23% of the total market share.
Industrial activity is supported by established collection, sorting, shredding, processing and remelting networks. In 2025, the United States recovered about 3.6 million metric tons of aluminum from purchased scrap. Around 56% came from new manufacturing scrap and 44% from discarded aluminum products, while aluminum recovered from old scrap equaled about 28% of apparent consumption. Eurostat reported that the European Union exported 18.9 million tonnes of recyclable metals, equal to 52.1% of recyclable raw-material exports.
Decarbonization is a driver for recycled metals. The World Steel Association states that using one tonne of steel scrap can avoid about 1.5 tonnes of carbon dioxide emissions and the consumption of 1.4 tonnes of iron ore, 740 kilograms of coal and 120 kilograms of limestone. Its sustainability indicators show scrap-based electric arc furnace steel at 0.69 tonnes of carbon dioxide per tonne of crude steel, compared with 2.34 tonnes for the blast furnace-basic oxygen furnace route.
Government circular-economy policies are creating additional growth opportunities. The European Commission reports a European Union circular material use rate of 11.8% and aims to double it to 24% by 2030. Its planned Circular Economy Act is intended to expand the single market for secondary raw materials and stimulate recycled-material demand. Battery rules also require recycling efficiencies of 75% for lead-acid batteries and 65% for lithium-based batteries by the end of 2025, supporting future metal recovery.
Product Analysis
In 2025, Ferrous Metals held a dominant market position, capturing more than a 63.45% share. The segment remained central to recycled metal flows because steel and iron scrap are widely collected from vehicles, machinery, buildings, appliances, and manufacturing operations. Established recovery networks, strong steelmaking demand, and the ability to repeatedly process ferrous scrap supported its leading position across industrial recycling chains.
- In April 2026, according to the U.S. Geological Survey, aluminum recovered from scrap in December 2025 totaled 275,000 metric tons. Of this volume, 143,000 metric tons came from new scrap, while 132,000 metric tons came from old scrap. The figures provide a clear measure of active secondary-metal recovery in the non-ferrous supply chain.
Non-ferrous Metals are the fastest growing segment, supported by increasing recovery of aluminum, copper, lead, and other higher-value metals from vehicles, electronics, industrial equipment, packaging, and construction waste. Their strong reuse potential, lower material losses, and growing importance in electrification and lightweight manufacturing are encouraging recyclers and manufacturers to strengthen collection, separation, sorting, and secondary processing capacity across established industrial and consumer material recovery systems worldwide.
End User Analysis
Manufacturing & Industrial Machinery dominates with 36.78% through strong secondary metal demand
In 2025, Manufacturing & Industrial Machinery held a dominant market position, capturing more than a 36.78% share. The segment remained the leading end user because recycled steel, aluminum, copper, and other metals are widely used in machinery frames, tools, production equipment, components, and replacement parts. Manufacturers increasingly use secondary metals to support material efficiency, control input costs, and maintain reliable supplies for industrial production.
- In July 2026, according to the U.S. Census Bureau, machinery shipments reached $42.193 billion in June 2026, increasing by 1.7% from the previous month, while machinery new orders stood at $43.685 billion. The figures were published through the Manufacturers’ Shipments, Inventories, and Orders survey.
Construction & Infrastructure is the fastest growing segment, supported by continuing demand for recycled steel, aluminum, and other metals in buildings, bridges, roads, public works, and structural systems. Recycled metals offer builders an established material source for reinforcing products, structural sections, roofing, wiring, and infrastructure components. Rising investment in transport networks, public facilities, and urban development is strengthening opportunities for secondary metal suppliers serving construction projects across major global construction markets.
Key Market Segments
Product
- Ferrous Metals
- Steel Scrap
- Iron Scrap
- Cast Iron
- Non-ferrous Metals
- Aluminum
- Copper
- Lead
- Precious Metals
- Others
End User
- Manufacturing & Industrial Machinery
- Automotive & Transportation
- Construction & Infrastructure
- Energy & Utilities
- Consumer Products & Appliances
- Others
Driver Analysis
EAF steel conversion and scrap intensity
Electric-arc-furnace (EAF) conversion is the largest volume-side accelerator because it turns ferrous scrap from a residual by-product into a strategic metallic input: an EAF can use up to 100% scrap, while the blast-furnace/basic-oxygen-furnace route can normally absorb about 30%, making scrap availability, residual-metal control and yard logistics direct constraints on mill utilization and margin capture.
- Worldsteel estimates around 650 million tonnes of end-of-life steel scrap is generated annually, avoiding roughly 975 million tonnes of CO₂, yet current global steel demand of about 1.75 billion tonnes materially exceeds scrap availability; this scarcity supports structurally higher collection rates, long-term feedstock contracts, shredder investment and vertically integrated recycling models rather than purely spot-based trading.
The International Energy Agency (IEA) projects scrap’s share of steel metallic inputs rising from 33% in 2022 to 38% by 2030 and 40% by 2035; recyclers able to consistently supply low-copper, low-tin, furnace-ready grades can therefore earn a quality premium, while lower-grade processors face greater downgrading risk.
Drivers Impact Analysis
| Driver | (~) % Impact on CAGR | Geographic Relevance | Impact Timeline |
|---|---|---|---|
| EAF steel conversion and scrap intensity | +1.6 pp | North America, EU, India, MENA, ASEAN | Medium term (2–4 years) |
| Carbon-cost arbitrage and low-emission procurement | +1.3 pp | EU core, North America, Japan, South Korea | Short term (≤2 years) |
| Grid, EV and renewable-material demand | +1.1 pp | China, EU, North America, India, APAC | Medium term (2–4 years) |
| Scrap-retention rules and traceable trade | +0.9 pp | EU, UK, North America, Asia import hubs | Short term (≤2 years) |
| Automated sorting and high-purity recovery | +0.8 pp | North America, EU, Japan, South Korea, China | Medium term (2–4 years) |
| E-waste and battery circularity mandates | +0.7 pp | EU, China, North America, India | Long term (≥4 years) |
Restraint Analysis
Scrap Scarcity and Feedstock Competition
The core structural restraint is that demand for high-quality secondary metal is scaling faster than end-of-life scrap generation, particularly for low-residual ferrous grades, segregated aluminium alloys and high-conductivity copper; the IEA identifies limited scrap availability as a constraint on steel decarbonisation, while global crude-steel demand remains supported by industrial expansion in India and ASEAN. EAF capacity investment therefore does not automatically translate into recycled-metal volume growth: mills, foundries and traders compete for the same obsolete scrap pool, bid up collection prices and compress the processing spread between inbound scrap and furnace-ready output.
The issue is most acute in advanced economies where mature collection systems already capture substantial accessible material, leaving incremental volumes dependent on harder-to-recover demolition, vehicle and appliance streams; recyclers must absorb greater procurement, storage and working-capital costs before monetising sales. Strategic outcomes include longer-term feedstock contracts, direct sourcing from OEMs and demolition firms, and vertical integration, but independent spot-market processors face reduced throughput visibility and delayed expansion decisions.
Restraint Impact Analysis
| Restraint | (~) % Impact on CAGR Forecast | Geographic Relevance | Impact Timeline |
|---|---|---|---|
| Scrap scarcity and feedstock competition | -1.5 pp | EU, North America, Japan, South Korea, China | Medium term (2–4 years) |
| Mixed scrap and alloy contamination | -1.2 pp | India, ASEAN, Latin America, Africa, China | Medium term (2–4 years) |
| Metal-price and inventory volatility | -1.1 pp | Global; China, EU, North America | Short term (≤2 years) |
| Trade controls and shipment compliance | -0.9 pp | EU, UK, Türkiye, ASEAN, South Asia | Short term (≤2 years) |
| High CapEx, power and labor costs | -0.8 pp | EU, North America, Japan, South Korea | Medium term (2–4 years) |
| Battery/e-waste feedstock timing mismatch | -0.6 pp | EU, China, North America, India | Long term (≥4 years) |
Opportunity Analysis
Closed-Loop OEM Metal Contracts
Closed-loop supply is an opportunity not a present-market driver because most recyclers still sell mixed or standard grades through spot channels rather than securing multi-year access to manufacturing offcuts and guaranteed offtake of specification-grade secondary metal. A recycler that integrates collection bins, alloy segregation, toll conversion and material certification with automotive, appliance, packaging, cable or construction OEMs can convert volatile merchant revenue into contracted volumes with indexed pricing, potentially lifting EBITDA margin by an analyst-modeled 300–600 basis points through lower procurement leakage, reduced sorting loss and fewer intermediaries.
The opportunity is most immediate in aluminium, copper and high-grade steel, where source-segregated prompt scrap can bypass expensive mixed-scrap processing; it becomes strategically material as EU work on recycled-content calculation and verification for steel and aluminium advances in 2026. Commercial execution requires proprietary collection rights, grade-specific inventory discipline and contracts that share metal-price upside, but successful operators can capture a larger share of the value normally retained by brokers, primary smelters and OEM procurement teams.
Opportunity Impact Analysis
| Opportunity | (~) % Potential CAGR | Geographic Relevance | Execution Window |
|---|---|---|---|
| Closed-loop OEM metal contracts | +1.5 pp | EU, North America, Japan, South Korea | Medium term (2–4 years) |
| Certified recycled-content platform | +1.2 pp | EU core, UK, North America | Short term (≤2 years) |
| Battery black-mass flexibility | +1.1 pp | China, EU, North America, India | Long term (≥4 years) |
| Urban-mining consolidation roll-ups | +1.0 pp | India, ASEAN, Latin America, Africa | Medium term (2–4 years) |
| AI alloy-upgrading hubs | +0.9 pp | EU, North America, China, Japan | Medium term (2–4 years) |
| Decommissioning and grid recovery | +0.8 pp | North America, EU, China, India, Australia | Long term (≥4 years) |
Challenges Analysis
Feedstock Traceability Gaps
Traceability remains a persistent execution challenge because recycled-metal value chains connect collectors, demolition contractors, traders, yards, sorters, smelters, refiners and OEMs, yet material identity, contaminant history, alloy chemistry and chain-of-custody records are often lost at each hand-off; this does not stop existing spot sales, but it limits access to higher-margin aerospace, automotive, electrical and battery supply contracts. The commercial penalty is an analyst-modeled 5–15% discount to equivalent verified-grade material where processors cannot substantiate recycled content, source origin or composition, alongside longer customer qualification cycles and higher sampling costs.
The gap is becoming more material as the EU’s Digital Product Passport development covers iron and steel from 2026 and is intended to provide data on products, components and materials; companies must therefore integrate weighbridge data, spectrometer results, lot genealogy and customer certificates into interoperable records rather than treat compliance as a document-management exercise. The strategic response is a digital material-passport architecture tied to physical batch controls, third-party verification and customer ERP interfaces, which requires 2–4 years of data standardisation before it reliably improves pricing, contract win rates and inventory turns.
Challenges Impact Analysis
| Challenge | (~) % CAGR Friction | Geographic Relevance | Mitigation Horizon |
|---|---|---|---|
| Feedstock traceability gaps | -1.1 pp | EU, North America, APAC corridors | Medium term (2–4 years) |
| Alloy-complexity management | -1.0 pp | EU, China, Japan, North America | Long term (≥4 years) |
| Fragmented reverse logistics | -0.9 pp | India, ASEAN, Latin America, Africa | Medium term (2–4 years) |
| Skilled-operator shortage | -0.8 pp | North America, EU, Japan, South Korea | Medium term (2–4 years) |
| Battery fire-risk control | -0.7 pp | Global e-waste hubs, North America, EU | Long term (≥4 years) |
| Cross-border data interoperability | -0.6 pp | EU, UK, Türkiye, ASEAN | Short term (≤2 years) |
Geopolitical Impact Analysis
Trade Barriers and Resource Security Reshaping Recycled Metal Flows
Current geopolitical pressures are reshaping the recycled metal market through trade barriers, excess steel capacity, resource-security policies, and tighter control of scrap flows. In June 2026, the Organisation for Economic Co-operation and Development (OECD) reported that global steelmaking capacity reached 2,445 million tonnes in 2025, while excess capacity climbed to 640 million tonnes. This imbalance is affecting steel prices and recycled ferrous feedstock demand across producing regions.
- In April 2026, the White House strengthened Section 232 measures by applying a 50% tariff to the full customs value of many aluminum, steel, and copper products, while certain derivative products faced a 25% rate. These measures are encouraging manufacturers to reassess sourcing, processing, and use of domestically available secondary metals.
Europe is also moving to protect access to recyclable feedstock. In July 2025, the European Commission activated customs surveillance covering ferrous waste and scrap, aluminum, and copper because of concerns over scrap leakage to third countries. The system provides monthly trade information and can support targeted trade measures if scrap availability becomes insufficient for European industry.
Resource security is becoming more closely linked with recycling policy. The European Commission stated that waste lithium-ion batteries and black mass will be classified as hazardous waste in September 2026, after which exports to non-OECD countries will be prohibited. It also announced targeted measures for aluminum scrap and possible similar action for copper scrap, supporting more localized recovery while increasing regulatory complexity for international recycled-metal traders.
Regional Analysis
Asia-Pacific Leads with 40.23% Share and US$61.23 Billion
In 2025, Asia-Pacific held a dominant position in the Recycled Metal Market, capturing more than 40.23% share and generating USD 61.23 billion in revenue. The region benefits from steelmaking, automotive, machinery, construction, and electronics industries that generate volumes of recoverable ferrous and non-ferrous material.
- In July 2026, the Bureau of International Recycling reported that China consumed 50.64 million tonnes of recycled steel during the first quarter. Strong scrap collection networks, electric arc furnace capacity, and circular manufacturing practices continue supporting secondary-metal demand across Asian economies.
Latin America is the fastest growing region, supported by expanding scrap-processing infrastructure and circular-economy investment. In April 2025, Alacero reported that Aceros AZA invested US$26 million in a Chilean shredder designed to process 230,000 tonnes of scrap annually and produce more than 189,000 tonnes of fragmented ferrous material. The project strengthens recovery capacity and supports recycled-metal supply for steelmaking, construction, machinery, and transportation applications.
Key Regions and Countries Covered
- North America
- The US
- Canada
- Europe
- Germany
- France
- The UK
- Spain
- Italy
- Russia & CIS
- Rest of Europe
- APAC
- China
- Japan
- South Korea
- India
- ASEAN
- Rest of APAC
- Latin America
- Brazil
- Mexico
- Rest of Latin America
- Middle East & Africa
- GCC
- South Africa
- Rest of MEA
Key Players Analysis
Recycled metal manufacturers focus on expanding collection networks, processing efficiency, material purity, and closed-loop supply agreements to strengthen competitive positioning. In 2026, companies such as Novelis, Nucor, Kuusakoski Group, and Redwood Materials emphasized integrated recycling and secondary-material recovery. Novelis commissioned new equipment at its Latchford facility as part of a US$90 million expansion designed to add 85 kilotonnes of annual aluminum recycling capacity, reinforcing competition in high-quality recycled aluminum.
Competitive strategies also center on securing scrap feedstock and recovering higher-value metals from complex waste streams. Kuusakoski acquired the remaining 39% of SWEEEP Kuusakoski in May 2026, gaining full ownership of a facility that processes about 25% of mixed waste electrical and electronic equipment generated in the United Kingdom. Redwood Materials also maintains recovery rates above 95% for lithium, nickel, cobalt, and copper, while Nucor uses scrap as the primary input for electric arc furnace steelmaking.
Market Key Players
- Ace Green Recycling Inc.
- Asahi Holdings Inc.
- Batx Energies Private Limited
- Befesa S.A.
- European Metal Recycling Limited
- GFG Alliance
- Hensel Recycling GmbH
- Kuusakoski Group
- Lohum Cleantech Pvt Ltd
- Metaloop GmbH
- Nucor Corporation
- Novelis Inc
- Redwood Materials Inc.
- ScrapBees GmbH
- Other Key Players
Key Development
- In January 2026, Hensel Recycling GmbH entered a strategic partnership with Weber GmbH, with C. Hensel Holding and Hensel Recycling acquiring a stake in Weber. The collaboration focuses on combining technological expertise, automation, new market development, and circular-economy solutions.
- In June 2026, Redwood Materials Inc. expanded its partnership with General Motors across the full battery lifecycle. Redwood plans to deploy around 100 repurposed GM battery packs providing 1.5 MW/7.2 MWh of energy at a Michigan manufacturing plant, with projected lifetime electricity savings above US$3 million.
Report Scope
| Report Features | Description |
|---|---|
| Market Value (2025) | USD 152.2 Bn |
| Forecast Revenue (2035) | USD 248.6 Bn |
| CAGR (2026-2035) | 5.0% |
| Base Year for Estimation | 2025 |
| Historic Period | 2020-2024 |
| Forecast Period | 2026-2035 |
| Report Coverage | Revenue Forecast, Market Dynamics, Competitive Landscape, Recent Developments |
| Segments Covered | By Product (Ferrous Metals (Steel Scrap, Iron Scrap, Cast Iron) Non-ferrous Metals (Aluminum, Copper, Lead, Precious Metals, and Others)), By End User (Manufacturing & Industrial Machinery, Automotive & Transportation, Construction & Infrastructure, Energy & Utilities, Consumer Products & Appliances, and Others) |
| Regional Analysis | North America – The US & Canada; Europe – Germany, France, The UK, Spain, Italy, Russia & CIS, Rest of Europe; APAC– China, Japan, South Korea, India, ASEAN & Rest of APAC; Latin America– Brazil, Mexico & Rest of Latin America; Middle East & Africa– GCC, South Africa, & Rest of MEA |
| Competitive Landscape | Ace Green Recycling Inc., Asahi Holdings Inc., Batx Energies Private Limited, Befesa S.A., European Metal Recycling Limited, GFG Alliance, Hensel Recycling GmbH, Kuusakoski Group, Lohum Cleantech Pvt Ltd, Metaloop GmbH, Nucor Corporation, Novelis Inc., Redwood Materials Inc., ScrapBees GmbH, and Other Key Players. |
| Customization Scope | Customization for segments, region/country-level will be provided. Moreover, additional customization can be done based on the requirements. |
| Purchase Options | We have three licenses to opt for: Single User License, Multi-User License (Up to 5 Users), Corporate Use License (Unlimited Users and Printable PDF) |





































