


Report Overview
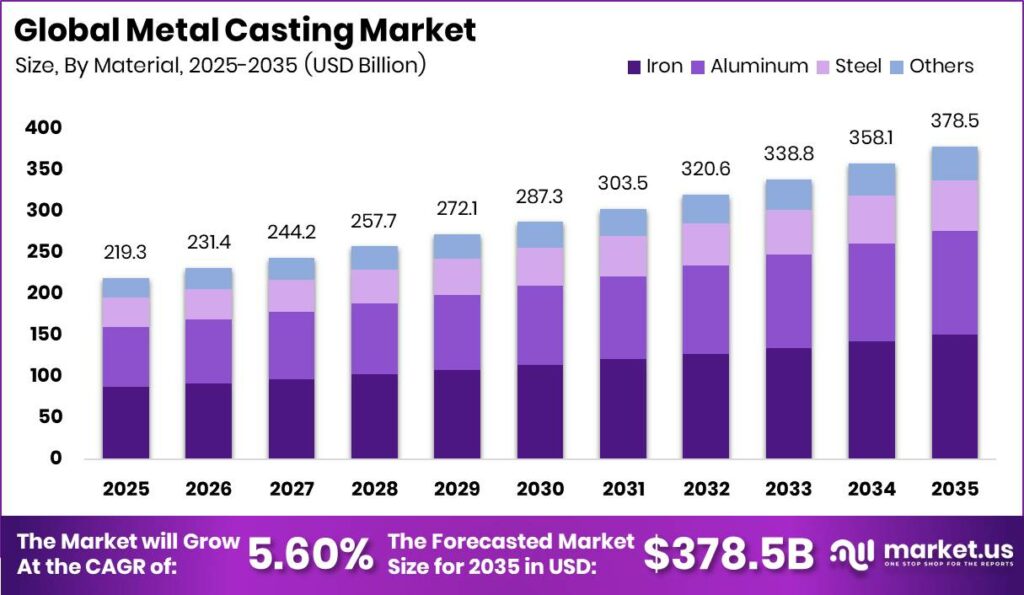
Global Metal Casting Market size is expected to be worth around USD 378.50 Billion by 2035 from USD 219.30 Billion in 2025, growing at a CAGR of 5.60% during the forecast period 2026 to 2035. This means foundries and metal buyers face a decade of steady, compounding demand rather than a short cycle spike. Therefore, capacity planning and long term supplier contracts carry more weight than short term price swings.
Metal casting covers the process of pouring molten metal into molds to form components used across automotive, industrial machinery, construction, and aerospace industries. The market structure spans material types such as iron, aluminum, steel, and other alloys, alongside distinct casting processes including sand casting, die casting, and investment casting. This means buyers select suppliers based on material and process fit rather than price alone.
Key Takeaways
- Global Metal Casting Market is valued at USD 219.30 Billion in 2025 and is projected to reach USD 378.50 Billion by 2035, at a CAGR of 5.60%.
- Iron dominates the material segment with a 39.80% share, while aluminum is the fastest growing material type.
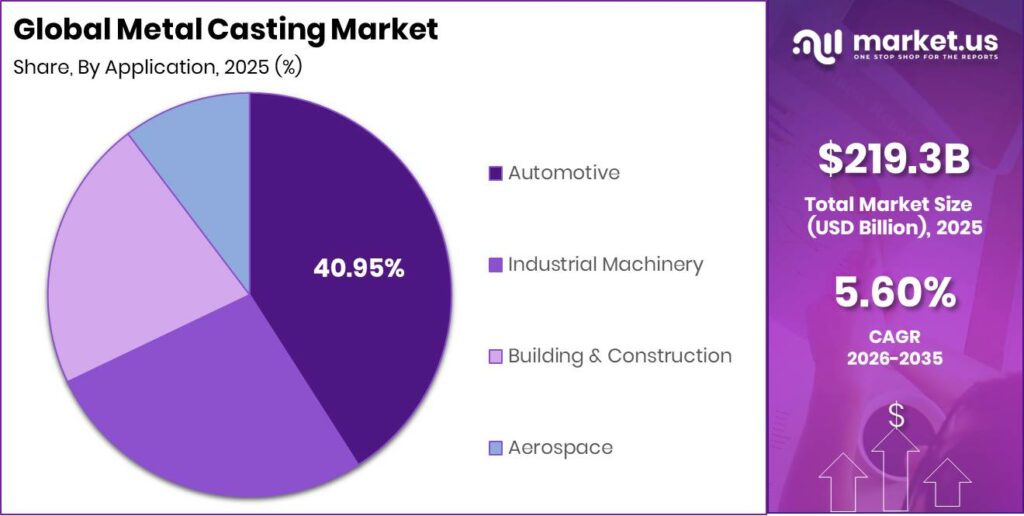
- Automotive leads the application segment with a 40.95% share.
- Sand casting leads the process segment with a 34.00% share, while die casting is the fastest growing process.
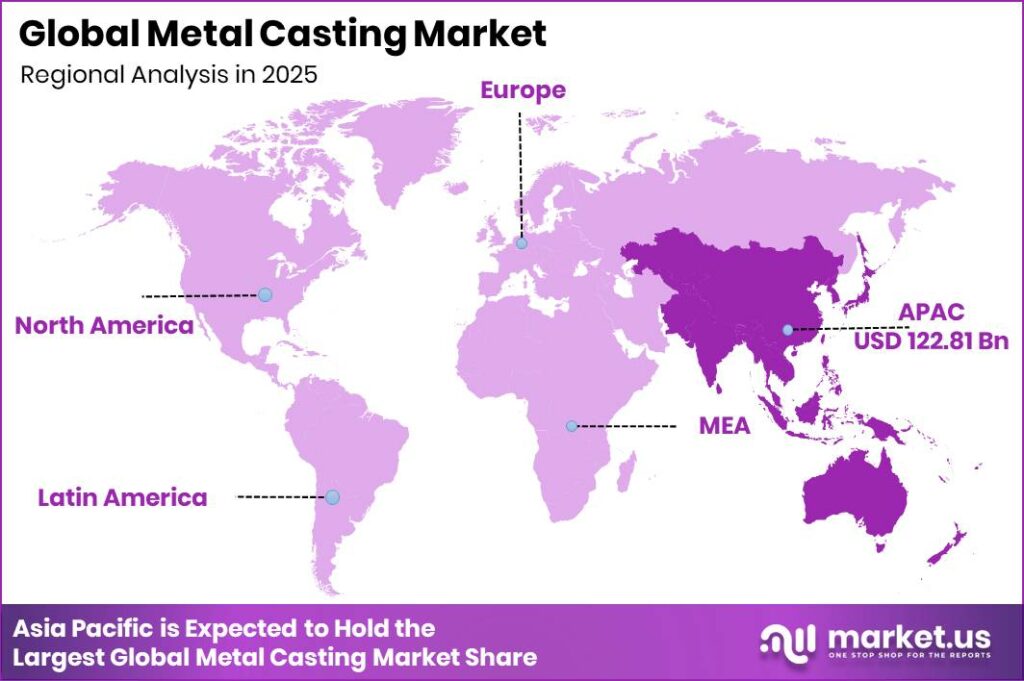
- Asia Pacific dominates the regional market with a 56.00% share, valued at USD 122.81 Billion.
North American foundries are directing capital toward modernization ahead of forecasted demand. According to the American Foundry Society, well over 90% of foundries were making capital investments in 2025, spending on plant modernization, automation, and expansion. This signals that suppliers are positioning for volume growth rather than reacting to it. Consequently, buyers negotiating contracts today face sellers with rising fixed cost bases baked into pricing.
This spending pattern strengthened further into 2026. As reported by the American Foundry Society, 95% of foundries were making capital investments in 2026, a direct indicator of continuing investment in production assets and process upgrades. However, the same survey found that 20% of foundries reported a sales decline over the preceding 90 days, quantifying near term demand softness even amid heavy investment. This creates a split market where capacity is expanding faster than short cycle orders, favoring buyers who can commit to longer contracts.
Material Analysis
Iron dominates with 39.80% due to low cost and high volume automotive use.
In 2025, Iron held a dominant market position in the By Material segment of Metal Casting Market, with a 39.80% share. The American Foundry Society projected a 1.9% increase in casting sales in 2025, a measured change in annual shipment activity tied heavily to ferrous pours. This scale keeps iron the default material for high tonnage engine blocks and structural parts. Buyers relying on iron benefit from mature supply chains but face slower innovation cycles than lighter alloy competitors.
Aluminum functions as the structural lightweighting alternative to iron across automotive and aerospace programs. AFS projected 4.2% casting sales growth in 2026, with 48% of that increase attributable to tonnage growth tied closely to aluminum die cast expansion. This tonnage driven growth signals real physical demand rather than pricing alone. Foundries investing in aluminum capacity now capture share ahead of slower moving iron only competitors.
Steel serves buyers needing higher strength to weight performance than iron in heavy machinery and construction applications. AFS attributed 52% of projected 2026 casting sales growth to pricing adjustments, separating the non-volume component from tonnage driven gains steel producers also capture. This pricing power reflects steel’s role in higher margin, specification driven orders. Suppliers positioning steel for engineered applications defend margin better than commodity sellers.
Other material types, including specialty and composite alloys, hold the remaining share collectively and serve niche performance requirements outside mainstream iron, aluminum, and steel demand.
Application Analysis
Automotive dominates with 40.95% due to heavy structural casting content per vehicle.
In 2025, Automotive held a dominant market position in the By Application segment of Metal Casting Market, with a 40.95% share. In June 2026, Fabri announced 13.5 Million in cumulative funding to scale its investment casting platform for aerospace and defense component manufacturing, showing capital is also flowing into adjacent application growth. This means automotive remains the anchor buyer even as investors fund parallel aerospace casting capacity.
Industrial Machinery buyers depend on casting for durable, high load components used in production equipment and heavy plant operations. This functional role keeps demand tied to broader industrial capital expenditure cycles rather than consumer trends. Machinery makers that lock in long term casting contracts reduce exposure to spot price volatility in metal inputs.
Building and Construction applications use castings for structural fittings, fixtures, and infrastructure components where durability outweighs weight sensitivity. This buyer behavior contrasts with automotive’s lightweighting priority, giving construction demand more price sensitivity than performance sensitivity. Suppliers serving this segment compete primarily on cost and delivery reliability.
Aerospace applications hold the remaining share and rely on precision, near net shape castings for flight critical components where quality certification matters more than unit cost.
Process Analysis
Sand Casting dominates with 34.00% due to low tooling cost for large parts.
In 2025, Sand Casting held a dominant market position in the By Process segment of Metal Casting Market, with a 34.00% share. A 2025 technical review reported defects fell from 20% to 5%, a 75% reduction, after numerical simulation modeled flow and solidification before production, an improvement widely applied to sand casting lines. This means sand casting operators adopting simulation tools cut rework cost significantly.
Die Casting is the fastest growing process, favored by buyers needing high precision, thin walled aluminum parts at volume. A 2025 high pressure die casting tooling case study reported a 52% reduction in scrap, lowering the scrap rate to 3.9% after applying additive manufactured tooling improvements, and cutting cleaning time to 7 minutes per shift, a 66% reduction. This efficiency gain lets die casters absorb cost pressure better than slower legacy lines.
Investment Casting holds the remaining share and serves buyers needing complex, high precision geometries for aerospace and defense parts where dimensional tolerance outweighs unit cost.
Key Market Segments
By Material
- Iron
- Aluminum
- Steel
- Others
By Application
- Automotive
- Industrial Machinery
- Building & Construction
- Aerospace
By Process
- Sand Casting
- Die Casting
- Investment Casting
Regional Analysis
Asia Pacific Dominates the Metal Casting Market with a Market Share of 56.00%, Valued at USD 122.81 Billion
Asia Pacific leads global casting demand through dense automotive and industrial manufacturing bases across China, Japan, South Korea, and India. In April 2026, Calderys commissioned a new steel casting fluxes and refractory manufacturing facility in Odisha, adding dedicated production capacity for foundry and steel casting applications through a greenfield investment. This means the region’s cost advantage is being paired with new specialty input capacity rather than relying purely on scale.
North America shows momentum through capital deployment confidence among foundry operators. As per our research, 72% of responding foundries described their 2026 economic outlook as positive, while 14% described it as negative. This confidence gap signals foundries are planning expansion even amid tariff uncertainty. Investors backing US capacity additions are positioning ahead of reshoring driven demand.
Key Regions and Countries
North America
- US
- Canada
Europe
- Germany
- France
- The UK
- Spain
- Italy
- Rest of Europe
Asia Pacific
- China
- Japan
- South Korea
- India
- Australia
- Rest of APAC
Latin America
- Brazil
- Mexico
- Rest of Latin America
Middle East and Africa
- GCC
- South Africa
- Rest of MEA
Market Dynamics
Market Opportunity Analysis - Aerospace linked and defense adjacent casting demand offers underexploited entry points
Aerospace applications hold the smallest share within the By Application segment, positioning it as an underexploited growth pocket compared to the automotive dominated demand base. This means new entrants targeting precision, near net shape aerospace castings face less incumbent density than the automotive segment. Therefore, investors backing specialized tooling for aerospace certification can capture share before larger foundries reallocate capacity.
Investment Casting sits as the smallest process category relative to sand casting and die casting, yet it serves the same high value aerospace and defense buyers seeking dimensional precision. This creates room for niche foundries to specialize without competing directly against high volume sand casting operators. By contrast, entrants chasing sand casting scale face established cost leaders already holding a third of process share.
The Middle East and Africa region carries no dominant share statistic in the data block, distinguishing it from Asia Pacific’s concentrated 56.00% hold. This signals lower competitive density in regional foundry capacity relative to Asia Pacific and North America. Instead, early entrants building regional supply relationships now avoid the crowded bidding environment already forming in Asia Pacific.
Technology and Innovation Landscape - Simulation and AI driven quality control cut scrap and defect rates across foundries
A 2025 technical review reported defects fell from 20% to 5%, a 75% reduction, after numerical simulation modeled flow and solidification behavior before production began. This means foundries can now predict quality problems before pouring metal. Manufacturers adopting simulation software cut rework cost and shorten qualification timelines for new parts.
Cooling channel design inside die casting side cores reduced scrap further to 0.5%, demonstrating the measurable quality impact of faster local solidification and thermal control. This shows thermal engineering has become a direct lever for cost reduction rather than a design detail. Investors funding tooling innovation capture margin gains competitors relying on standard tooling cannot match.
A 2025 Asia Foundry Congress paper reported foundry focused artificial intelligence deployments produced an average scrap reduction of 40% across completed projects. This signals AI backed defect detection is moving from pilot stage to measurable production impact. Foundries delaying AI adoption risk losing cost competitiveness to early adopters within a few production cycles.
Market Drivers
| Driver | (~) % Impact on CAGR Forecast | Geographic Relevance | Impact Timeline |
|---|---|---|---|
| EV lightweighting & aluminum substitution | +1.9% | Global; led by China, EU, North America | Short term (2 years or less) |
| Structural megacasting consolidation of body parts | +1.2% | North America, East Asia, Nordics | Medium term (2 to 4 years) |
| Industry 4.0 smart-foundry throughput gains | +0.9% | Global; concentrated in EU, Japan, US | Medium term (2 to 4 years) |
| Renewable-energy component casting demand | +0.8% | China, EU, India | Short term (2 years or less) |
| Semiconductor-fab & industrial CapEx reshoring | +0.6% | US, EU, India, SE Asia | Medium term (2 to 4 years) |
| Recycled-metal circular feedstock adoption | +0.5% | Global; strongest in EU | Long term (4 years or more) |
EV Lightweighting & Aluminum Substitution
Electric vehicles surpassed 20% of global new-car sales in 2025, per IEA Global EV Outlook tracking, and each battery-electric platform carries roughly 40 to 90 kg more cast aluminum content than an equivalent internal-combustion vehicle, per European Aluminium association shipment data. This mechanically expands foundry order books independent of unit-volume growth, shifting revenue away from low-margin commodity iron pours toward integrated, tooled aluminum programs where per-part value capture and net margins run several hundred basis points higher. The milestone ramp of dedicated die-cast lines at OEM plants across 2024 and 2025, reflected in aluminum-intensive product mix disclosures in automaker capital-expenditure filings, confirms the transition from job-shop casting to long-cycle, contract-locked supply that de-risks utilization.
This structural pivot toward high-pressure aluminum die castings is reshaping foundry business models by replacing ferrous stampings with higher-value integrated programs that lock in multi-year supply commitments. Foundries able to fund induction-melt and cold-chamber die-cast capital expenditure capture disproportionate share, per US Department of Energy IEDO industrial decarbonization assessments on melt-shop electrification, while legacy sand-only operations face compressing volumes and stranded ferrous capacity. As per our research, this aluminum substitution driver contributes an estimated +1.9% above the 5.60% baseline CAGR, making it the single largest positive force reshaping competitive positioning across the forecast period.
Market Restraints
| Restraint | (~) % Impact on CAGR Forecast | Geographic Relevance | Impact Timeline |
|---|---|---|---|
| Section 232 metals & derivative tariffs | -1.5% | US-facing trade; global exporters | Short term (2 years or less) |
| Elevated interest rates freezing foundry CapEx | -1.1% | Global; acute in emerging markets | Short term (2 years or less) |
| Energy-cost volatility & grid curtailment | -0.9% | EU, South Asia, Sub-Saharan Africa | Short term (2 years or less) |
| Environmental permitting & emissions caps | -0.6% | EU, North America, China Tier-1 | Medium term (2 to 4 years) |
| Foundry closures & capacity attrition | -0.5% | US, Western Europe, Japan | Medium term (2 to 4 years) |
Section 232 Metals & Derivative Tariffs
The US Department of Commerce and CBP moved to a full-customs-value basis effective April 6, 2026, imposing a 50% tariff on products made almost entirely of foreign steel or aluminum and a flat 25% rate on derivative products whose foreign metal content exceeds 15% by weight, per the White House proclamation and CBP guidance. This directly captures imported castings classified under HTSUS Chapters 73 and 76, creating a sudden landed-cost step-up that, layered atop the 50% base metals rate active since June 2025, prices non-US foundries out of American OEM bills of material. The commercial consequence is forced re-sourcing at a time when domestic melt capacity remains structurally constrained, compressing margins for exporters absorbing the duty to retain volume.
US buyers face delayed capital expenditure decisions while awaiting clarity on the melted-and-poured 95% US-origin threshold that qualifies for the reduced 10% duty tier, per CBP valuation rules under 19 U.S.C. § 1401a. Essential grid-equipment castings carry a capped rate of 15% only until end-2027 before reverting to 25%, leaving near-term order commitments frozen against an unresolved cost curve. As per our research, this restructured Section 232 regime represents the steepest restraint in the forecast period, deducting an estimated -1.5% from the baseline CAGR and concentrating the most severe impact on suppliers with high import intensity and limited domestic melting redundancy.
Market Challenges
| Challenge | (~) % CAGR Friction Drag | Geographic Relevance | Mitigation Horizon |
|---|---|---|---|
| Skilled foundry workforce deficit | -1.0% | US, Western Europe, Japan | Long term (4 years or more) |
| Silica sand & refractory input inflation | -0.7% | Global; India, China, US | Medium term (2 to 4 years) |
| Megacasting yield & scrap-rate friction | -0.6% | North America, East Asia | Medium term (2 to 4 years) |
| Decarbonization retrofit cost burden | -0.5% | EU, North America, China | Long term (4 years or more) |
| Aluminum & alloy price volatility | -0.5% | Global | Short term (2 years or less) |
Skilled Foundry Workforce Deficit
US Bureau of Labor Statistics establishment data shows foundry employment has fallen below 101,000 from a workforce that once exceeded 120,000, with attrition concentrated among workers over 55 retiring faster than apprenticeship pipelines can backfill. This pattern is echoed in European and Japanese foundry-association headcount surveys, confirming the labor erosion is a cross-regional structural condition rather than a localized cyclical event. Unfilled shifts cap effective plant utilization well below nameplate capacity, extend program lead times, and elevate scrap rates on manual-intensive pours, directly throttling the throughput gains that automation investment is designed to unlock.
The long-term corporate adjustment required involves a durable pivot toward robotic pouring, AI-driven defect detection, and reskilling investment, per US Department of Labor registered-apprenticeship tracking and DOE Manufacturing Extension Partnership workforce programs. This transition carries multi-year payback periods, requiring firms to absorb near-term training and automation capital expenditure while defending margin and competing for scarce mechatronics talent against higher-paying adjacent manufacturing verticals. As per our research, this structural labor pool erosion imposes an estimated -1.0% drag on maximum growth potential, making workforce capability a more binding constraint than capital availability for foundries targeting giga-press and advanced die-casting expansion.
Market Opportunities
| Opportunity | (~) % Potential CAGR Upside | Geographic Relevance | Execution Window |
|---|---|---|---|
| Gigacasting white-space scale-up | +2.1% | North America, East Asia, EU | Long term (4 years or more) |
| Aerospace & defense near-net-shape castings | +1.3% | US, EU, India | Medium term (2 to 4 years) |
| Additive-hybrid sand-mold monetization | +1.0% | EU, North America, Japan | Medium term (2 to 4 years) |
| Fragmented foundry M&A roll-up | +0.9% | US, Western Europe, India | Long term (4 years or more) |
| Low-carbon “green casting” premium tier | +0.7% | EU, North America | Medium term (2 to 4 years) |
Gigacasting White-Space Scale-Up
Single-shot casting of entire front and rear underbodies remains a nascent monetization model outside a handful of pioneers, with most OEM platforms yet to redesign body architecture around 6,000-to-9,000-tonne presses. Tesla and Volvo led early adoption, while broader Toyota, Ford, Nissan, and Hyundai programs slated from 2026 onward have not yet converted to committed foundry tonnage, per automaker investor-deck disclosures and public engineering roadmaps. Consolidating 70-plus stamped-and-welded parts into one to two castings can compress body-assembly cycle time by up to 30% and reduce per-vehicle structural cost by a low-double-digit percentage, per SAE and academic mega-casting production-system studies.
This unit-economic prize translates into gross-margin expansion of several hundred basis points for foundries that pre-invest in giga-press capacity and vacuum-die metallurgy ahead of confirmed demand. Capturing this opportunity requires deliberate, capital-intensive positioning, since first movers lock in multi-year platform contracts and proprietary alloy know-how that late entrants cannot readily replicate, per US Department of Energy advanced-manufacturing assessments on large-format aluminum casting. As per our research, converting this currently dormant total addressable market into durable share can add an estimated +2.1% above the baseline CAGR, representing the largest single untapped upside in the forecast period.
Key Company Insights
Alcoa Corporation holds a structural advantage as a large scale aluminum producer feeding directly into die casting supply chains, positioning it to benefit as aluminum substitution accelerates across automotive lightweighting programs. This scale advantage limits smaller aluminum suppliers from competing on volume pricing, though rising tariff costs on cross border metal flows create margin risk for its export exposed operations.
ThyssenKrupp AG operates across diversified industrial and steel casting applications, giving it exposure to both automotive and heavy machinery demand cycles rather than a single end market. This diversification reduces cyclical risk but increases exposure to global steel pricing volatility and tightening emissions permitting rules across its main operating regions.
Key Players
- Alcoa Corporation
- ThyssenKrupp AG
- Bharat Forge Limited
- Norsk Hydro ASA
- Arconic Inc.
- Nemak
- Kobe Steel, Ltd.
- Georg Fischer AG
- Waupaca Foundry, Inc.
- Precision Castparts Corp. (PCC)
- Endurance Technologies Limited
- American Axle & Manufacturing Holdings, Inc.
- Zynq Foundry
- Aisin Seiki Co., Ltd.
- Bühler AG
Recent Developments
- February 2026: Bharat Forge Limited subsidiary JS Auto Cast secured a 300 crore equity investment from Premji Invest to expand ferrous casting capacity and pursue sector acquisitions.
- March 2026: Dynacast acquired Platinadora Baja, expanding its integrated manufacturing capabilities with metal finishing, zinc die casting, aluminium die casting, and downstream assembly operations.
- April 2026: Mumford Metal Casting was acquired by an undisclosed strategic buyer, strengthening consolidation in the aluminium die casting segment across automotive, heavy truck, defense, agriculture, and industrial components.
Geopolitical Impact Analysis
According to the World Trade Organization, global merchandise trade growth has slowed as tariff barriers rise, and the US Section 232 regime now applies a 50% tariff on products made almost entirely of foreign steel or aluminum, alongside a 25% rate on derivatives exceeding 15% foreign metal content. This directly raises landed costs for imported castings entering the United States. Therefore, foundries outside qualifying origin thresholds face reduced access to American automotive and industrial buyers.
As reported by the World Bank, commodity price volatility continues to affect industrial input costs, and aluminum supply chains remain sensitive to energy price swings across major producing regions. This connects directly to die casting operators who depend on stable aluminum feedstock pricing for tooling investment decisions. Consequently, foundries facing volatile input costs delay capacity expansion until tariff and pricing clarity improves.
Report Scope
| Report Features | Description |
|---|---|
| Market Value (2025) | USD 219.30 Billion |
| Forecast Revenue (2035) | USD 378.50 Billion |
| CAGR (2026-2035) | 5.60% |
| Base Year for Estimation | 2025 |
| Historic Period | 2020-2024 |
| Forecast Period | 2026-2035 |
| Report Coverage | Revenue Forecast, Market Dynamics, Market Opportunity Analysis, Technology and Innovation Landscape, Competitive Landscape, Recent Developments |
| Segments Covered | By Material (Iron, Aluminum, Steel, Others), By Application (Automotive, Industrial Machinery, Building & Construction, Aerospace), By Process (Sand Casting, Die Casting, Investment Casting) |
| Regional Analysis | North America (US and Canada), Europe (Germany, France, The UK, Spain, Italy, and Rest of Europe), Asia Pacific (China, Japan, South Korea, India, Australia, and Rest of APAC), Latin America (Brazil, Mexico, and Rest of Latin America), Middle East and Africa (GCC, South Africa, and Rest of MEA) |
| Competitive Landscape | Alcoa Corporation, ThyssenKrupp AG, Bharat Forge Limited, Norsk Hydro ASA, Arconic Inc., Nemak, Kobe Steel Ltd., Georg Fischer AG, Waupaca Foundry Inc., Precision Castparts Corp., Endurance Technologies Limited, American Axle & Manufacturing Holdings Inc., Zynq Foundry, Aisin Seiki Co. Ltd., Bühler AG |
| Customization Scope | Customization for segments, region / country-level will be provided. Additional customization can be done based on requirements. |
| Purchase Options | We have three licenses to opt for: Single User License | Multi-User License (Up to 5 Users) | Corporate Use License (Unlimited User and Printable PDF) |





































