


Report Overview
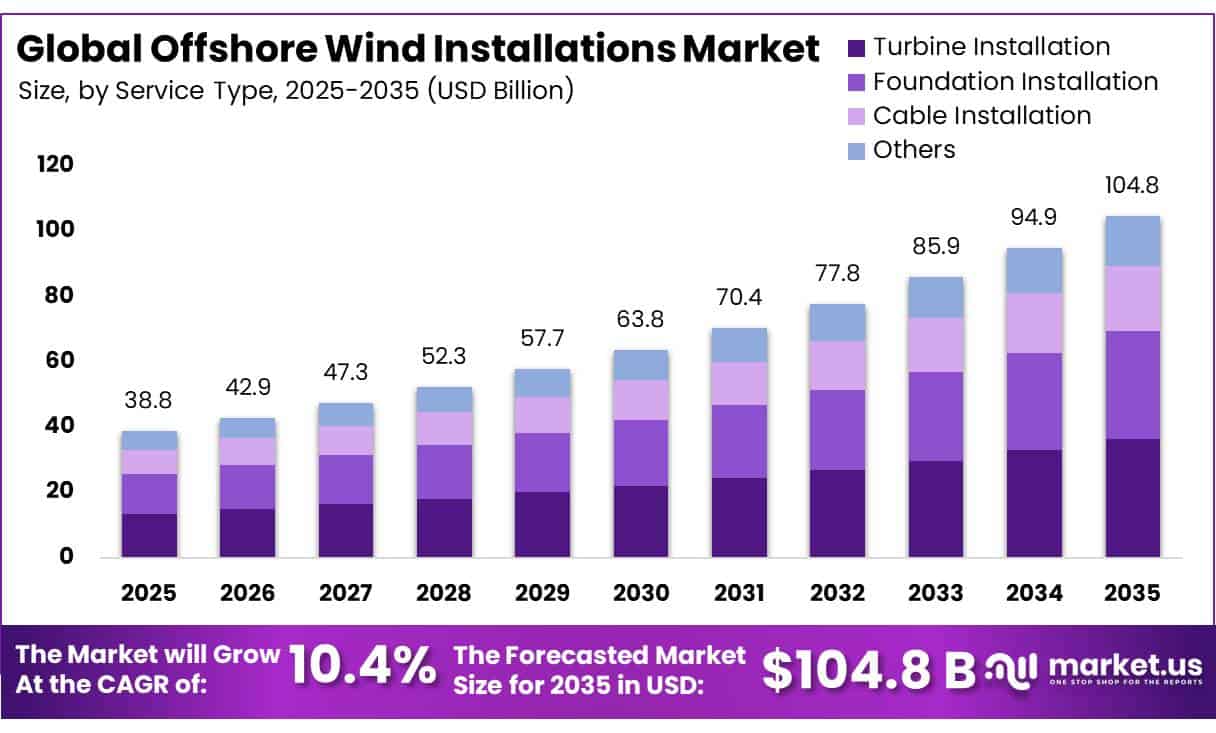
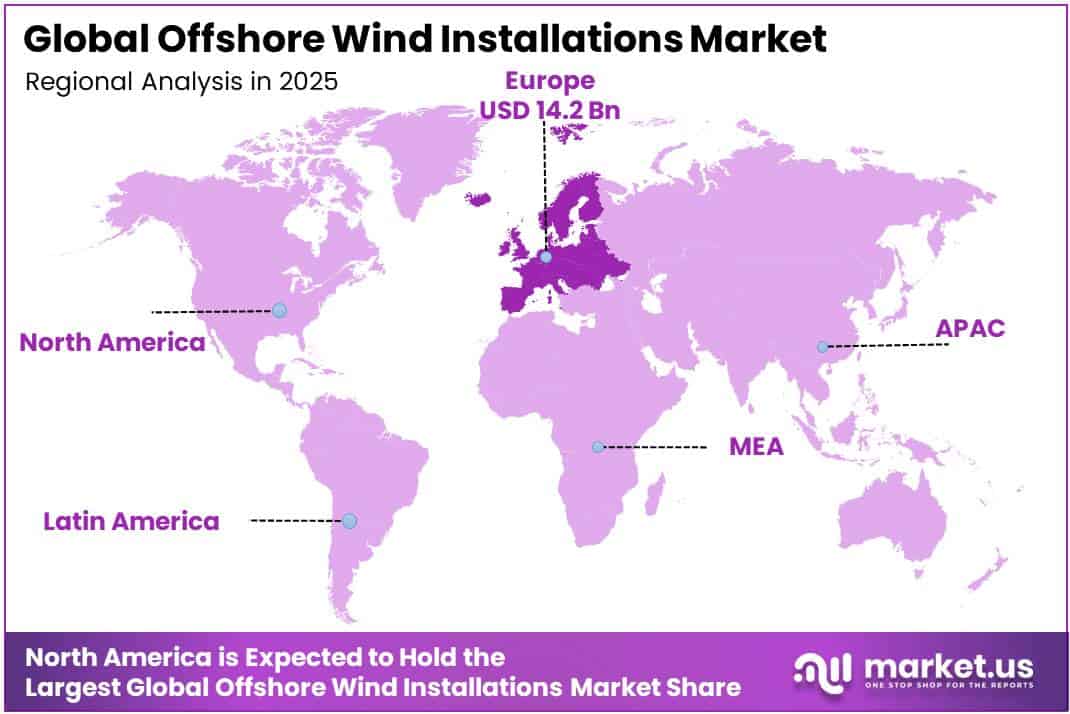
In 2025, the Global Offshore Wind Installations Market was valued at USD 38.8 billion, and between 2026 and 2035, this market is estimated to register a CAGR of 10.4%, reaching about USD 104.8 billion by 2035. In 2025, Europe led the market, achieving over 36.6% share with a revenue of USD 14.2 billion.
Offshore wind installations are becoming an important part of the global renewable energy industry because offshore locations generally offer stronger and more stable wind conditions than land-based sites.
- According to the Global Wind Energy Council, 2026, around 9.3 GW of new offshore wind capacity was connected during 2025, increasing cumulative global capacity to approximately 92.5 GW. This operating capacity could generate electricity equal to the annual consumption of nearly 102 million households, highlighting the sector’s increasing contribution to energy security and low-carbon electricity supply.;
Key Takeaways
- The Global Offshore Wind Installations Market was valued at USD 38.8 billion in 2025.
- The market is projected to grow at a CAGR of 10.4% and is estimated to reach USD 104.8 billion by 2035.
- On the basis of service type, Turbine Installation dominated the market, constituting 34.7% of the total market share.
- Based on the location, Shallow Water dominated the market, with a substantial market share of around 43.7%.
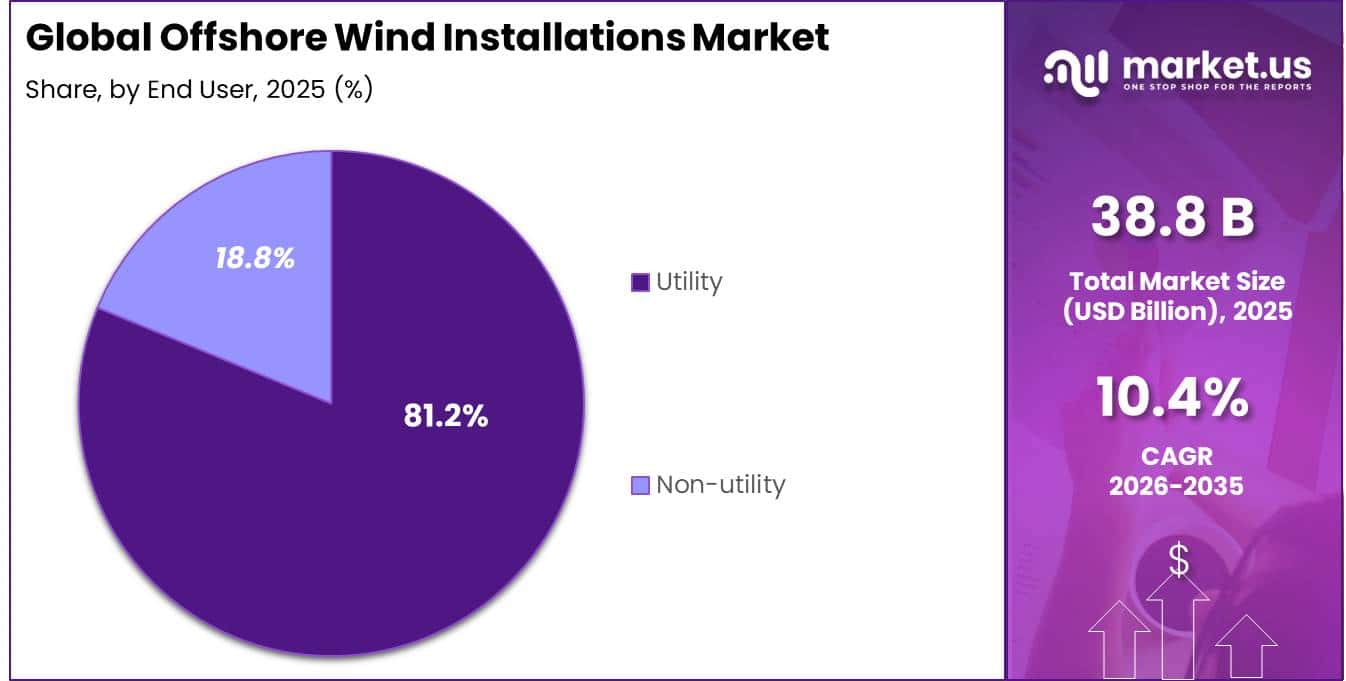
- Based on the end user, Utility led the market, comprising 81.2% of the total market.
- In 2025, Europe was the most dominant region in the market, accounting for 36.6% of the total global consumption.
Government renewable energy targets remain a major driving factor for offshore wind installations. According to the European Commission, 2024, European Union member states established combined offshore renewable energy ambitions of 86–89 GW by 2030, 259–261 GW by 2040 and 356–366 GW by 2050. These targets are supporting coordinated maritime planning, cross-border electricity networks and offshore energy hubs. They also provide long-term visibility for turbine manufacturers, cable suppliers, engineering companies, utilities and institutional investors.
- According to the UK Government, 2025, approximately GBP 900 million was allocated for fixed-bottom offshore wind and GBP 180 million for floating offshore wind under the seventh Contracts for Difference allocation round. The government also established an administrative strike price of GBP 113 per MWh for conventional offshore wind. Such mechanisms improve revenue certainty, although developers continue to face high financing costs, construction inflation and supply-chain pressures.
The medium-term outlook remains positive, but project growth may vary across regions. According to the International Energy Agency, 2025, approximately 140 GW of additional offshore wind capacity could be installed between 2025 and 2030. Annual installations are expected to increase from 9.2 GW in 2024 to more than 37 GW by 2030. However, the agency lowered its offshore wind forecast by 27% because of policy uncertainty, project cancellations, higher equipment costs and weak auction participation. Faster permitting and timely grid connections will therefore remain essential.
- According to the U.S. Department of Energy, 2025, the Floating Offshore Wind Shot aims to reduce floating wind energy costs by more than 70%, reaching USD 45 per MWh by 2035, while supporting the deployment of 15 GW of floating offshore wind capacity. These developments are expected to create long-term opportunities for installation vessels, ports, component suppliers, engineering firms and operations and maintenance service providers.
Service Type Analysis
Turbine Installation Dominates the Market with a 34.7% Share Due to Growing Demand for Large Offshore Wind Projects
In 2025, Turbine Installation held a dominant market position, capturing more than a 34.7% share. The segment remained central to offshore wind construction because turbine erection requires specialised vessels, heavy-lift cranes, trained marine crews and accurate component handling. Developers increasingly prefer experienced installation contractors that can manage larger nacelles, towers and rotor blades while reducing weather-related delays.
- In April 2025, the UK government approved the Rampion 2 offshore wind project with a planned capacity of 1.2 GW and up to 90 offshore turbines. This project highlights the large volume of turbine transportation, lifting, assembly and commissioning work expected from newly approved wind farms. Growing turbine sizes and tighter project schedules are also encouraging investment in advanced installation vessels and port infrastructure.
Foundation Installation is the fastest-growing segment. Growth is supported by offshore wind projects moving into deeper waters and more difficult seabed conditions. Larger turbines require stronger monopiles, jackets, gravity-based structures and floating foundations that can withstand heavy wind and wave loads. Foundation work is also becoming more specialised because each offshore site has different soil, water-depth and environmental requirements. Developers are therefore increasing spending on seabed surveys, piling equipment, corrosion protection and floating-platform engineering.
Location Analysis
Shallow Water Leads with a 43.7% Share Due to Easier Fixed-Bottom Installation
In 2025, shallow water held a dominant market position, capturing more than a 43.7% share. Its leadership was supported by the wide use of fixed-bottom foundations, which offer established construction methods, simpler seabed anchoring and lower installation complexity compared with floating systems. Ports, vessels and foundation suppliers are also more prepared to handle projects located in accessible water depths.
- The European Commission reported that the EU connected 916 MW of offshore wind capacity during 2025, while floating projects accounted for only 30 MW. This deployment pattern indicates that bottom-fixed projects, including those developed in shallow-water locations, continued to form the main base of commercial offshore wind construction.
Deep water is the fastest growing segment. In 2025, developers increasingly considered deeper offshore locations because they provide access to large wind-resource areas that cannot be developed through conventional seabed-fixed foundations. Growth is being supported by improvements in floating platforms, mooring systems, dynamic cables and turbine designs that can operate farther from the coast. Deep-water projects also allow developers to explore areas with stronger and more consistent winds while reducing competition for near-shore space. The segment is expected to gain momentum as floating wind projects move from demonstration stages toward commercial-scale installation and specialized port and vessel infrastructure becomes more widely available.
End User Analysis
Utility end users lead the offshore wind installations market with an 81.2% share due to strong grid-scale project development.
In 2025, Utility held a dominant market position, capturing more than an 81.2% share. Utility companies remained the main end users because offshore wind farms are generally developed as large, grid-connected power projects supported by government auctions, regulated contracts, and long-term electricity procurement agreements. Utilities also have stronger access to capital for turbines, foundations, offshore substations, export cables, and grid connections.
- In January 2026, the UK government secured 8.4 GW of offshore wind capacity through its renewable energy auction, enough to supply the equivalent of more than 12 million homes. This large procurement volume shows how utility-backed projects continue to drive offshore wind installation activity.
Non-utility is the fastest growing segment. In 2025, the segment gained momentum as industrial companies, port operators, technology businesses, and other large electricity consumers explored direct participation in offshore wind projects. Corporate power purchase agreements and merchant electricity arrangements allow these users to secure cleaner power while improving long-term energy cost visibility. Growth also comes from companies working with offshore wind developers through joint investments and dedicated electricity supply contracts.
Key Market Segments
By Service Type
- Turbine Installation
- Foundation Installation
- Cable Installation
- Others
By Location
- Shallow Water
- Deep Water
- Transitional Water
By End User
- Utility
- Non-utility
Driver Analysis
Net‑zero and offshore capacity targets (EU, UK, China, India)
Government‑anchored net‑zero and offshore wind deployment targets are the single largest structural driver of offshore wind installations, converting long‑term climate commitments into concrete gigawatt‑scale build‑out trajectories and investment pipelines. The International Renewable Energy Agency (IRENA) shows global offshore wind capacity at about 83 GW in 2024, with pathways that require scaling to around 2,000 GW by 2050 to remain aligned with Paris climate goals, implying a multi‑decadal installed base growth of 24x and necessitating double‑digit annual additions.
Parallel country and regional targets hard‑wire this into planning: India’s Ministry of New and Renewable Energy (MNRE) has set a specific 30 GW offshore wind installation target by 2030 within a broader 500 GW renewable target, with India’s total wind capacity already rising from 21.04 GW in March 2014 to 56.09 GW in March 2026 (2.66x) and recording its highest‑ever annual wind addition of 6.05 GW in 2025–26.
In Europe, UK “Clean Power 2030” goals and an operational offshore fleet that, together with China, already accounts for ~70% of the global ~92 GW offshore base by mid‑2026 anchor multi‑year pipelines where EnergyPulse forecasts operational offshore capacity reaching ~230 GW by 2030, with 15.5 GW consented and 10.4 GW under active construction in just the first half of 2026.
Strategically, the existence of quantified offshore targets in EU, UK, China, and India increases visibility on the annual tender volume, reduces demand risk, and supports a higher leverage of supply‑chain fixed assets, which in turn adds an estimated 2.5 percentage points to the underlying global offshore installations CAGR through 2030–2035 by compressing project lead times and increasing annual commissioned capacity relative to a policy‑neutral baseline.
Driver Impact Analysis
| Driver | (~) % Impact on CAGR Forecast | Geographic Relevance | Impact Timeline |
|---|---|---|---|
| Net-zero and offshore capacity targets (EU, UK, China, India) | +2.5% | EU core, UK, China, India | Medium term (2–4 years) |
| Auction/VGF and CfD support frameworks | +1.8% | EU core, UK, India, selective APAC | Short–Medium term (≤ 4 years) |
| Turbine scaling to 18–20 MW and installation productivity gains | +1.2% | China, EU North Sea cluster, US Atlantic | Medium–Long term (≥ 3–4 years) |
| Grid, transmission, and seabed planning reforms | +0.9% | EU core, UK, US, China | Medium term (2–4 years) |
| Floating offshore wind commercialization and deep-water deployment | +1.3% | EU Atlantic, Mediterranean, Japan, South Korea, US West, India potential | Long term (≥ 4 years) |
| Global wind deployment momentum and OEM supply-chain normalization | +0.8% | Global, led by China, EU, India | Short–Medium term (≤ 4 years) |
Restraint Analysis
Vessel, foundation and cable installation bottlenecks
Vessel, foundation and cable installation bottlenecks represent a hard physical cap on annual offshore wind installation volumes, with current global installation vessel fleets and manufacturing lines engineered for roughly 40–50 GW per year while policy visions outside China call for around 80 GW per year by 2030, necessitating up to 27 billion USD in incremental supply chain investment by 2026 according to government-cited analytical work. Fixed-bottom foundation bottlenecks in Europe are projected to emerge from 2026 onwards, and floating foundation constraints from around 2029, driven by limited yards capable of fabricating XXL monopiles and jackets, as well as the small number of heavy-lift turbines installation vessels that can handle rotor diameters exceeding 15 MW-class turbines.
In numerical terms, a 10–15% shortfall in practical installation capacity versus auctioned volumes can easily suppress realized installation CAGR by 2–3 percentage points; here we model a conservative -2.2 percentage point drag, accounting for vessel dry-dock cycles, seasonal weather windows that compress installation campaigns into 6–8 month windows, and cable manufacturing plants running at above 90% utilization with lead times stretching to 18–24 months for high-voltage subsea cables needed for large offshore hubs. Operationally, day rates for offshore installation vessels can spike by 20–40% during peak seasons, raising installation cost per MW by 5–10% and eroding EPC margins that were originally modeled at 8–10% EBITDA, sometimes pushing projects near breakeven when combined with other cost pressures.
For developers, this forces phased commissioning, higher contingency budgets, and more complex portfolio scheduling to avoid stacking multiple projects on the same constrained supply base, delaying revenue ramp-up and pushing cash flow breakeven points out by 1–3 years in North Sea, APAC corridors, and US East Coast projects reliant on limited specialized fleets
Restraint Impact Analysis
| Restraint | (~) % Impact on CAGR Forecast | Geographic Relevance | Impact Timeline |
|---|---|---|---|
| Grid connection and permitting delays | -2.5% | EU core, North America, UK | Medium term (2-4 years) |
| Vessel, foundation and cable installation bottlenecks | -2.2% | EU North Sea, APAC corridors, US East Coast | Medium term (2-4 years) |
| Cost inflation and financing stress | -2.0% | Global ex-China, OECD coastal | Short to medium term (≤ 4 years) |
| Policy uncertainty and auction redesign risk | -1.8% | EU, UK, India, emerging APAC | Medium to long term (≥ 3-5 years) |
| Local content and supply chain localization constraints | -1.5% | US, EU, India | Long term (≥ 4 years) |
| Environmental, maritime, and community opposition | -1.2% | EU, US, selected APAC | Medium term (2-4 years) |
Opportunity Analysis
OEM-led installation and O&M roll-up platforms
An OEM-led installation and O&M roll-up platform constitutes a monetization pivot beyond today’s fragmented ecosystem of EPC contractors, marine installation firms, and independent service providers, where unit economics are constrained by sub‑scale fleets and uncoordinated maintenance windows; global offshore additions of ~9.3 GW in 2025 bringing total installed capacity to ~92.3 GW highlight rapid growth, but the market remains operationally siloed by project and geography.
If one or more leading turbine OEMs consolidate installation and long-term O&M across 25–35 GW of offshore assets via M&A of regional installers and service firms particularly in the EU, UK, and China coastal markets already hosting >75 GW of offshore capacity they can drive 8–12% CAPEX savings on installation and 15–20% OPEX reduction via condition-based maintenance, multi‑farm campaigns, and shared spare‑parts pools.
This roll-up model could push project IRRs up by 150–250 bps and support an incremental 1.8 percentage points CAGR upside for offshore installations, as lower all‑in LCOE expands bankable project pipelines beyond current National Electricity Plan trajectories for example, India’s plan to reach 57–66% renewable share of capacity by early 2030s gives a policy floor but not an optimized cost curve, leaving room for cost‑driven volume expansion.
Opportunity Impact Analysis
| Opportunity | (~) % Potential CAGR Upside | Geographic Relevance | Execution Window |
|---|---|---|---|
| Hybrid offshore wind-to-hydrogen hubs | +2.5% | EU, UK, India, APAC coastal | Medium term (2-4 years) |
| OEM-led installation and O&M roll-up platforms | +1.8% | EU core, North Sea, China coastal | Medium term (2-4 years) |
| Port-led offshore logistics and fabrication clusters | +1.6% | India, Southeast Asia, Latin America | Long term (≥ 4 years) |
| Digitalized installation-as-a-service (IaaS) models | +1.4% | Global tier-1 developers | Short term (≤ 2 years) |
| Cross-border power export via offshore corridors | +2.2% | North Sea, Baltic, India–ASEAN | Long term (≥ 4 years) |
| Repowering and life-extension of first-gen offshore fleets | +1.1% | EU pioneers, China coastal | Medium term (2-4 years) |
Challenges Analysis
Port and vessel bottlenecks
Port and vessel bottlenecks constitute a structural constraint on installation throughput because current heavy-lift and jack‑up vessel availability in mature basins is sized for roughly 50–60 percent of the announced auction and pipeline volumes through 2030, translating into average waiting times of 90–150 days per project for suitable installation assets in congested European and US East Coast corridors, and multi‑season delays for new markets such as India where port upgrade programs are only now being scoped in official supply chain and logistics reports.
This friction manifests in port load‑out capacity gaps many candidate ports can only handle nacelles and blades up to roughly 10–12 MW class, while 15–18 MW turbines are now standard, requiring dredging to deeper drafts, quay strengthening to bear 15–20 tonne/m² loads, and storage yards expanded by 20–30 hectares per GW of annual throughput, all of which push capex per port into the 300–500 million USD band and elongate construction timelines to 3–5 years per site.
On the vessel side, the global fleet of purpose‑built offshore wind installation vessels is under 100 units, while meeting decarbonization trajectories implies installing 25–35 GW per year globally by the early 2030s, meaning average vessel utilization above 85 percent and little slack for weather, maintenance, or refits; this elevates day rates by an estimated 20–30 percent over 2020 levels and adds 4–6 percent to turbine and foundation installation CAPEX.
The resulting operational friction drags achievable market CAGR by around 1.8 percentage points because each year 5–10 percent of planned capacity slides into subsequent years due to bottlenecks in loading windows, transit slots, and weather‑sensitive crane operations, forcing developers to adopt multi‑port logistics chains, staggered pre‑assembly strategies, and long‑term vessel charters of 5–10 years to secure fleet access, while governments accelerate port designation, fast‑track dredging permits, and co‑fund quay reinforcement to lift annual installation throughput per hub from roughly 0.7–1.0 GW today toward 1.5–2.0 GW over the next decade.
Challenges Impact Analysis
| Challenge | (~) % CAGR Friction Drag | Geographic Relevance | Mitigation Horizon |
|---|---|---|---|
| Port and vessel bottlenecks | -1.8% | EU/North Sea, US East Coast, India pilot hubs | Long term (≥ 4 years) |
| HV grid and subsea cable delays | -1.5% | EU regulatory hubs, UK, US Northeast, East Asia | Medium term (2-4 years) |
| Skilled offshore workforce gap | -1.3% | Global OEM clusters, EU, US, APAC build-out zones | Long term (≥ 4 years) |
| OEM and component supply strain | -1.2% | China export corridors, EU manufacturing belts, India | Medium term (2-4 years) |
| Multi-agency permitting drag | -1.0% | US federal waters, India coastal blocks, EU coastal states | Long term (≥ 4 years) |
| Met-ocean data and site uncertainty | -0.8% | Emerging markets (India, SE Asia, LatAm), new deepwater sites | Medium term (2-4 years) |
Geopolitical Impact Analysis
War Risks Raise Costs and Security Pressure Across Offshore Wind Installations
Ongoing conflicts in Ukraine and the Middle East are placing pressure on the offshore wind installation market. Attacks and military tension around sea routes are increasing insurance premiums, fuel expenses, vessel security requirements, and delivery times for turbines, foundations, cables, and installation equipment.
- Red Sea disruption is important because many components move between Asian factories and European project sites. UNCTAD reported that Suez Canal tonnage remained 70% below 2023 levels in May 2025, showing how conflict-driven rerouting continues to weaken shipping reliability.
The Russia-Ukraine war has also changed how governments view offshore wind assets. Wind farms, export cables, substations, and interconnectors are treated as critical infrastructure that requires surveillance, cybersecurity, and faster repair capacity. In June 2026, the European Commission announced €5.8 million for regional cable hubs and a €40 million call to strengthen submarine cable repair capability. These measures may support long-term market confidence, but they also add security and compliance costs during project development.
Regional Analysis
Europe Leads Offshore Wind Installations Market
The offshore wind installations market shows a two-speed regional structure, with Europe leading commercial value while Asia Pacific records the strongest capacity expansion. Mature procurement systems, established turbine suppliers, specialized ports, installation vessels, and cross-border grid planning support Europe’s revenue position. Asia Pacific gains momentum from China’s manufacturing scale, large coastal projects, and emerging activity in Taiwan and South Korea. Globally, 9.3 GW of offshore wind capacity was connected in 2025, lifting cumulative installations to 92.5 GW. This expanding base is creating sustained demand for turbine erection, foundations, cables, substations, transport vessels, and long-term offshore construction services worldwide over time.
- In 2025, Europe held the dominant position in the offshore wind installations market, capturing more than a 36.6% share and generating approximately USD 14.2 billion. The region benefits from experienced developers, dependable auction frameworks, established component manufacturing, and dense North Sea infrastructure.
- GWEC reported that Europe commissioned nearly 2 GW of offshore wind capacity during 2025 and exceeded 38 GW in cumulative installations, representing 42% of global offshore capacity. The European Commission further recorded about 21.6 GW of installed offshore wind capacity within the EU, including 916 MW newly connected during 2025, mainly in Germany and France across nearby markets.
Asia Pacific is the fastest-growing regional segment, supported mainly by China’s rapid project delivery, integrated turbine supply chain, competitive equipment costs, and extensive coastal development zones. In 2025, China connected 6.6 GW of new offshore wind capacity, the highest annual addition worldwide for the eighth consecutive year. Its cumulative offshore wind fleet reached 48.4 GW by year-end, equal to 52% of the global market. Taiwan and South Korea also commissioned new projects, broadening regional installation activity beyond mainland China. Continued policy auctions, floating wind development, domestic vessel construction, and stronger transmission investment are expected to sustain demand across Asia Pacific.
Key Regions and Countries Covered
- North America
- The US
- Canada
- Europe
- Germany
- France
- The UK
- Spain
- Italy
- Russia & CIS
- Rest of Europe
- APAC
- China
- Japan
- South Korea
- India
- ASEAN
- Rest of APAC
- Latin America
- Brazil
- Mexico
- Rest of Latin America
- Middle East & Africa
- GCC
- South Africa
- Rest of MEA
Key Players Analysis
Nordex SE remains a major wind-turbine installation and service specialist, although its current portfolio is concentrated on onshore rather than offshore turbines. In 2025, the group generated approximately EUR 7.6 billion in sales, employed more than 11,100 people, and had commissioned over 64 GW across more than 40 markets. Its experience in turbine delivery, project installation, turnkey construction, and long-term servicing provides transferable execution capabilities, but the company remains less directly positioned in offshore wind than specialist manufacturers serving developers.
Hyundai Motor Group participates in offshore wind mainly through Hyundai Engineering & Construction and Hyundai Engineering & Steel Industries. In August 2025, Hyundai E&C signed an offshore-wind cooperation agreement with Hanwha Ocean covering project participation, construction, investment, and shared use of wind-turbine installation vessels. The construction affiliate, founded in 1947, has secured more than USD 100 billion in overseas projects, while its steel-structure affiliate, founded in 2001, has developed government-supported offshore wind foundation installation technology for challenging marine infrastructure projects.
Zhejiang Windey, operating as Windey Energy Technology Group, is expanding its offshore wind position through large-turbine platforms, project development, and specialized research. Its offshore portfolio includes the 9 MW Sea Harrier and 16–18 MW Sea Eagle platforms, while a 16 MW Sea Eagle prototype was successfully hoisted in January 2025. Windey reported revenue exceeding RMB 22.198 billion in 2024 and ranked among the global top three for new installed capacity, supporting continued investment in deep-sea and floating wind technologies globally.
The Major Players in The Industry
- General Electric
- Vestas
- Shanghai Electric Wind Power Equipment Co.
- Siemens Gamesa
- Doosan Heavy Industries and Construction
- Hitachi
- Rockwell Automation
- Nordex SE
- Hyundai Motor Group
- Schneider Electric
- Zhejiang Windey Co.
- Taiyuan Heavy Industry Co.
- Other Key Players
Key Development
- In May 2026, General Electric’s offshore wind selected Scotland’s Maraen Port of Nigg to support the installation of Haliade-X turbines for Dogger Bank B and C. The full 3.6 GW development includes 190 units of 13 MW turbines and 87 units of 14 MW turbines
- In May 2025, Shanghai Electric Wind Power Equipment signed an equipment supply agreement with CGN Shengsi worth RMB 651.42 million, covering wind turbine generators, auxiliary equipment, spare parts and installation support. The contract included RMB 596.21 million for core equipment and RMB 55.21 million for optional parts and technical services.
Report Scope
| Report Features | Description |
|---|---|
| Market Value (2025) | USD 38.8 Bn |
| Forecast Revenue (2035) | USD 104.8 Bn |
| CAGR (2026-2035) | 10.4% |
| Base Year for Estimation | 2025 |
| Historic Period | 2020-2024 |
| Forecast Period | 2026-2035 |
| Report Coverage | Revenue Forecast, Market Dynamics, Competitive Landscape, Recent Developments |
| Segments Covered | By service type (Turbine Installation, Foundation Installation, Cable Installation, Others), By location (Shallow Water, Deep Water, Transitional Water), and By end user (Utility, Non-utility). |
| Regional Analysis | North America – The US & Canada; Europe – Germany, France, The UK, Spain, Italy, Russia & CIS, Rest of Europe; APAC– China, Japan, South Korea, India, ASEAN & Rest of APAC; Latin America– Brazil, Mexico & Rest of Latin America; Middle East & Africa– GCC, South Africa, & Rest of MEA |
| Competitive Landscape | General Electric, Vestas, Shanghai Electric Wind Power Equipment Co., Siemens Gamesa, Doosan Heavy Industries and Construction, Hitachi, Rockwell Automation, Nordex SE, Hyundai Motor Group, Schneider Electric, Zhejiang Windey Co., Taiyuan Heavy Industry Co., Other Key Players |
| Customization Scope | Customization for segments, region/country-level will be provided. Moreover, additional customization can be done based on the requirements. |
| Purchase Options | We have three licenses to opt for: Single User License, Multi-User License (Up to 5 Users), Corporate Use License (Unlimited Users and Printable PDF) |





































