


Report Overview
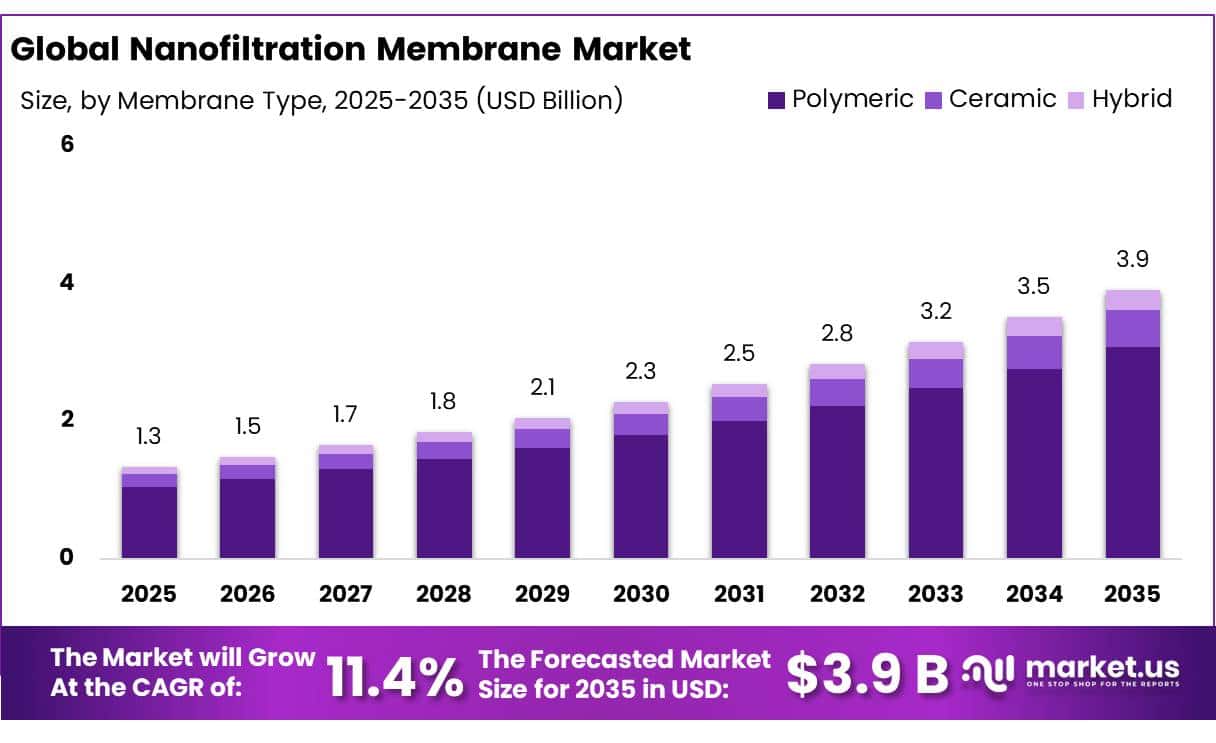
In 2025, the Global Nanofiltration Membrane Market was valued at USD 1.3 billion, and between 2026 and 2035, this market is estimated to register a CAGR of 11.4%, reaching about USD 3.9 billion by 2035.
Nanofiltration membranes are increasingly recognized as a critical solution for selective water purification, positioned between ultrafiltration and reverse osmosis in performance. Their ability to remove divalent and multivalent ions while preserving monovalent salts has driven adoption across municipal and industrial sectors, particularly in regions facing water scarcity.
The Asia Pacific region leads deployment due to rapid urbanization, industrialization, and regulatory emphasis on water quality, with municipalities and textile, pharmaceutical, and food & beverage industries integrating nanofiltration for water reuse and effluent compliance. Manufacturers focus on technological advancements, including hybrid polymeric-ceramic and thin-film composite membranes, and the integration of nanofiltration with multi-stage treatment systems to optimize efficiency and extend membrane life.
However, high capital and maintenance requirements, coupled with supply chain sensitivities amid geopolitical tensions, present challenges. Emerging industrial wastewater reuse applications and modular, energy-efficient solutions offer opportunities for broader adoption while supporting sustainability and regulatory compliance globally.
Key Takeaways
- The global nanofiltration membrane market was valued at USD 1.3 billion in 2025.
- The global market is projected to grow at a CAGR of 11.4% and is estimated to reach USD 3.9 billion by 2035.
- On the basis of membrane type, polymeric nanofiltration membranes dominated the market, constituting 78.5% of the total market share.
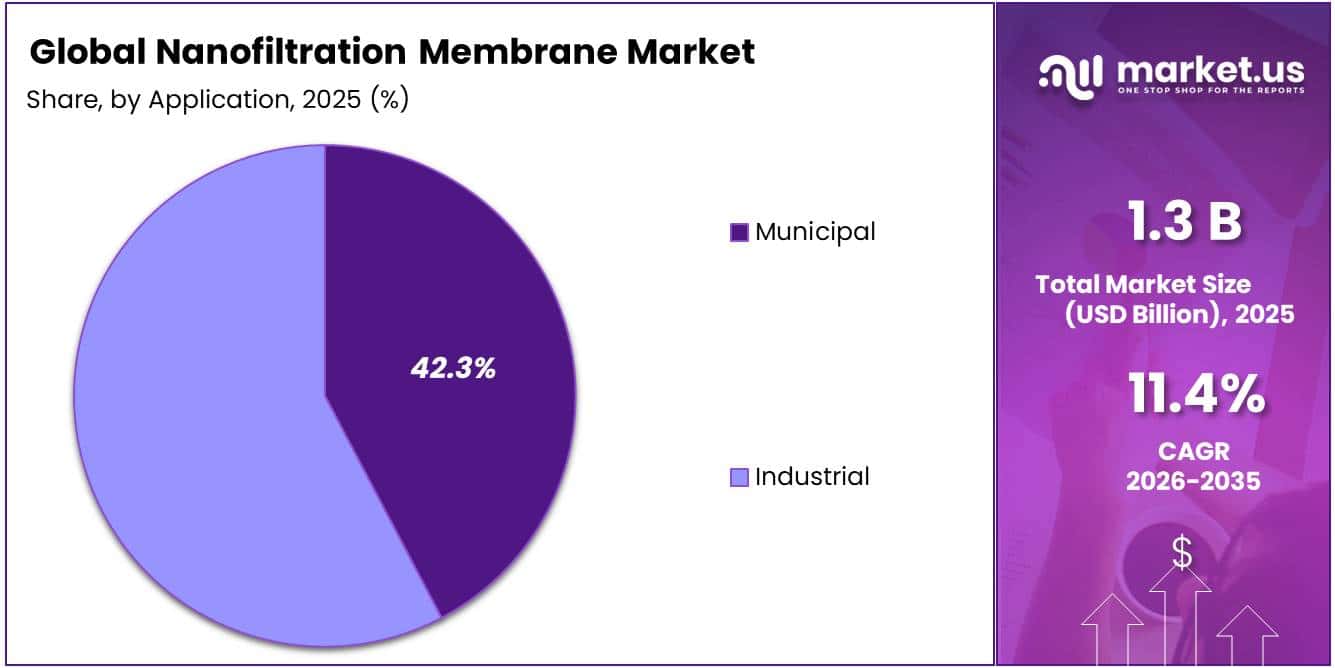
- Among the applications, industrial uses held a major share in the nanofiltration membrane market, 57.7% of the market share.
- Among the membrane module configurations, spiral wound is the most considerable within the market, accounting for around 55.6% of the revenue.
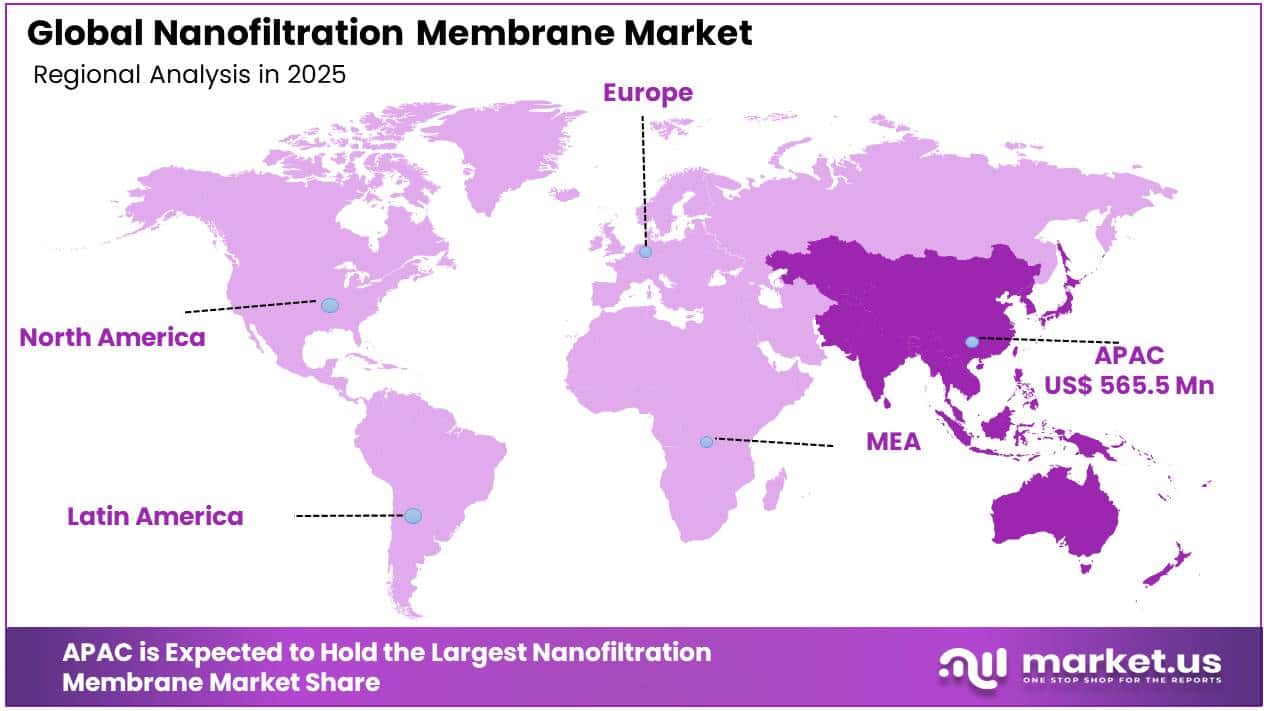
- In 2025, the Asia Pacific was the most dominant region in the nanofiltration membrane market, accounting for 43.5% of the total global consumption.
Membrane Type Analysis
Polymeric Nanofiltration Membranes are a Prominent Segment in the Market.
Polymeric membranes represent the dominant segment in the nanofiltration market, accounting for 78.5% of total deployment. Their widespread adoption is driven by a combination of cost-effectiveness, chemical versatility, and operational efficiency. These membranes offer high selectivity for divalent and multivalent ions while maintaining significant water flux, making them suitable for both municipal water treatment and industrial applications such as textiles, pharmaceuticals, and food & beverage processing.
Polymeric membranes are available in multiple configurations, including spiral wound and hollow fiber, allowing modular installation and ease of maintenance. Their compatibility with pre-treatment technologies and adaptability to various feedwater qualities enhance longevity and performance. Furthermore, ongoing research into thin-film composite polymeric membranes has improved anti-fouling properties and chemical resistance, reinforcing their position as the preferred choice for large-scale water purification and wastewater reuse projects globally.
Membrane Module Configuration Analysis
Spiral Wound Held a Major Share of the Nanofiltration Membrane Market.
Spiral wound membrane modules dominate the nanofiltration market, accounting for 55.6% of total installations. Their prevalence is attributed to their compact design, high packing density, and adaptability across a range of water treatment applications. These modules are particularly suitable for municipal water purification and industrial processes where space optimization and scalability are critical. The configuration allows feed water to pass uniformly across membrane surfaces, enhancing ion rejection efficiency and minimizing pressure drops.
Spiral wound modules are compatible with polymeric, ceramic, and hybrid membranes, facilitating integration into multi-stage treatment systems such as ultrafiltration–nanofiltration–reverse osmosis sequences. Ease of maintenance, ability to perform periodic chemical cleaning, and modular replacement options further strengthen their operational appeal, making spiral wound modules the preferred choice for large-scale and high-volume water treatment projects worldwide.
Application Analysis
Nanofiltration Membranes Are Mostly Utilized for Industrial Uses.
Industrial applications account for 57.7% of nanofiltration membrane utilization, reflecting strong demand for water treatment solutions across sectors such as textiles, pharmaceuticals, chemicals, and food & beverage processing. Nanofiltration membranes are employed to remove divalent and multivalent ions, hardness, and other contaminants from process water while enabling partial recovery and reuse, which is critical for meeting operational efficiency and environmental compliance standards.
In textile manufacturing, nanofiltration facilitates effluent recycling and dye removal, while pharmaceutical and chemical industries rely on precise water quality to maintain product integrity. The versatility of membrane configurations, including spiral wound and hollow fiber modules, supports integration into multi-stage treatment systems. Moreover, increasing industrial emphasis on sustainability and regulatory adherence has accelerated the deployment of nanofiltration technologies, positioning industrial applications as the leading driver of market adoption globally.
Key Market Segments
By Membrane Type
- Polymeric
- Ceramic
- Hybrid
By Membrane Module Configuration
- Spiral Wound
- Tubular
- Hollow Fiber
- Plate & Frame
- Others
By Application
- Municipal
- Industrial
Driver Analysis
Water Scarcity and Reuse Scale-Up
Water scarcity is the largest structural demand driver because it converts wastewater from a disposal stream into a dependable process-water asset: roughly half of the global population experiences severe water scarcity for at least part of the year, while agriculture, industry and municipal uses account for about 70%, just under 20% and about 12% of freshwater withdrawals, respectively. The treatment gap remains commercially material—42% of household wastewater was not safely treated in 2022, equivalent to about 113 billion m³ discharged with inadequate or no treatment, and only 27% of reported industrial wastewater was safely treated across the limited 22-country dataset.
Against this backdrop, the World Bank estimates that potable and industrial reuse could expand eightfold to 430 million m³/day by 2040, sustaining approximately 14% annual capacity growth and unlocking as much as US$340 billion of investment. NF captures value as the selective polishing stage between ultrafiltration and RO: it removes hardness, multivalent ions and dissolved organics while permitting fit-for-purpose mineral passage, supporting higher recovery and lower concentrate volumes than indiscriminate full desalination.
This shifts utility and industrial procurement from one-off membrane purchases toward multi-year design-build-operate, membrane-replacement and performance-guarantee contracts; China’s cities already used more than 22 billion m³ of recycled water in 2025, while India’s AMRUT 2.0 seeks recycled water equal to 20% of city demand and 40% of industrial demand at state level. The estimated +2.4 percentage-point CAGR uplift is therefore concentrated in APAC and MENA reuse corridors, with EU and U.S. drought-exposed basins contributing through advanced municipal polishing and decentralized industrial reuse.
Drivers Impact Analysis
| Driver | (~) % Impact on CAGR | Geographic Relevance | Impact Timeline |
|---|---|---|---|
| Water scarcity and reuse scale-up | +2.4 pp | APAC core; MENA; EU; U.S. Southwest | Short term (≤2 years) |
| PFAS and micropollutant limits | +1.7 pp | EU core; North America; East Asia | Short term (≤2 years) |
| High-purity industrial water demand | +1.4 pp | China; Taiwan; South Korea; U.S.; India; EU | Medium term (2–4 years) |
| Lower-energy selective separation | +1.1 pp | Global; strongest in high-power-cost markets | Short term (≤2 years) |
| Lithium and metals recovery | +0.8 pp | China; Australia; Chile; Argentina; U.S.; EU | Long term (≥4 years) |
| Public funding and reuse mandates | +0.7 pp | U.S.; EU; India; China; GCC | Medium term (2–4 years) |
Restraint Analysis
Fouling and Lifecycle OPEX
Fouling and scaling impose the largest near-term drag because organic matter, colloids, biofilm and sparingly soluble salts progressively reduce normalized permeate flux, increase pressure demand, alter rejection and shorten membrane life; the 2025 technical literature still identifies fouling, the permeability–selectivity trade-off and inadequate chemical stability as NF’s three principal bottlenecks, while full-scale economic research covering four NF and three RO installations confirms that fouling creates measurable plant-level costs rather than merely laboratory performance loss.
NF generally operates at about 3.5–16 bar and commercial elements can reject 90–98% of salts containing divalent anions, but this concentration mechanism raises local saturation at the membrane surface and makes the headline low-pressure advantage conditional on feed pretreatment, recovery and cleaning discipline. As a modeled 2026 operating case, a 10,000 m³/day installation losing 15% of design flux must either sacrifice 1,500 m³/day of output or add roughly 18% effective membrane area to restore capacity; if electricity, pretreatment, cleaning chemicals and replacement elements raise the treatment cost by only US$0.08–0.15/m³, annual cash OPEX rises by approximately US$0.29–0.55 million at full utilization.
Commercial maintenance evidence indicates that cleaning can move from roughly US$0.50–1.00 per 1,000 gallons in a well-run system to as much as US$4.00 when operation is poor, while fouling can raise broader operating costs by 50–100% in severe cases. Frequent clean-in-place cycles also consume production hours, wastewater capacity and acids, caustic or biocide, and aggressive cleaning accelerates polyamide degradation, creating a feedback loop between higher chemical spend and earlier replacement.
Restraint Impact Analysis
| Restraint | (~) % Impact on CAGR | Geographic Relevance | Impact Timeline |
|---|---|---|---|
| Fouling and lifecycle OPEX | -2.1 pp | Global; APAC industrial core | Short term (≤2 years) |
| Concentrate disposal burden | -1.6 pp | North America; EU; inland APAC; MENA | Medium term (2–4 years) |
| High CapEx and weak cost recovery | -1.3 pp | India; Southeast Asia; Africa; Latin America | Medium term (2–4 years) |
| Selectivity–flux trade-off | -1.0 pp | Global; specialty separations | Long term (≥4 years) |
| Substitution by mature treatments | -0.9 pp | North America; EU; Japan; GCC | Short term (≤2 years) |
| Durability and scale-up gap | -0.7 pp | Global; chemical and mining corridors | Long term (≥4 years) |
Opportunity Analysis
Solvent-Resistant NF Platforms
Organic-solvent nanofiltration (OSN) is an adjacent white space—not a baseline water-treatment driver—because it shifts NF from removing aqueous contaminants into replacing or debottlenecking thermal separations in pharmaceuticals, fine chemicals, edible oils and semiconductor-solvent recovery, where incumbent distillation and chromatography still dominate despite high energy and solvent consumption. The commercial entry point is hybridization rather than full plant replacement: OSN can pre-concentrate a stream by removing 70–90% of its solvent at roughly 10–40 bar before a smaller distillation finishing step, with reported hybrid energy savings of 37–77%; solvent recovery in an ideal integrated process can reduce fresh-solvent demand by as much as 90%, while separation operations account for approximately 60% of API-production energy in cited pharmaceutical analysis.
A modeled plant processing 10,000 tonnes/year of solvent can therefore recover 7,000–9,000 tonnes; at an illustrative avoided purchase-and-disposal value of US$800–1,200/tonne, the gross annual value pool is US$5.6–10.8 million before membrane replacement and polishing costs. Value capture should come through solvent-specific membrane libraries, paid feasibility screening, pilot rental and performance contracts priced per tonne recovered—not commodity element sales—allowing suppliers to target 35–50% gross margins and 12–24-month customer paybacks when solvent value and thermal duty are high.
Execution requires chemical stability across polar aprotic and non-polar solvents, pharmaceutical validation, explosion-safe skids and reliable multistage cascade simulation; however, success would open budgets outside municipal water procurement and lift revenue per square metre substantially. The estimated +1.9-percentage-point upside is therefore contingent on 2026–2030 conversion of validated OSN pilots into repeatable product platforms across U.S./EU/Japanese drug and specialty-chemical clusters and Chinese/Indian manufacturing corridors.
Opportunity Impact Analysis
| Opportunity | (~) % Potential CAGR | Geographic Relevance | Execution Window |
|---|---|---|---|
| Solvent-resistant NF platforms | +1.9 pp | North America; EU; Japan; China; India | Medium term (2–4 years) |
| Resource-recovery membranes | +1.6 pp | China; Australia; EU; Americas | Medium term (2–4 years) |
| Modular NF-as-a-Service | +1.3 pp | India; Southeast Asia; MENA; U.S. | Short term (≤2 years) |
| Hollow-fiber direct NF | +1.1 pp | EU core; North America; APAC cities | Medium term (2–4 years) |
| Circular food and textile processing | +0.9 pp | EU; China; India; Bangladesh; Türkiye | Short term (≤2 years) |
| Digital lifecycle monetization | +0.7 pp | North America; EU; Japan; GCC | Short term (≤2 years) |
Challenges Analysis
Feedwater Performance Variability
NF’s defining advantage charge and size-selective transport also creates a persistent operating challenge because rejection is not a fixed catalogue property: membrane charge changes with feed pH, ionic strength and ion identity, and polyamide studies show rejection rising between pH 4.5 and 9.0 before NaCl rejection can decline above pH 9 as charged groups and Donnan exclusion change. Mixed-salt behavior can become counterintuitive at pH 3 or 10, including negative rejection of H+ or OH and associated permeate/concentrate pH shifts, while commercial seawater testing at the same 17.7-bar pressure found Na and Cl rejection spanning approximately 10–20% for loose NF to 40–70% for tighter products even as sulfate rejection generally exceeded 95–99%.
This variability does not stop projects, but it forces feed-specific pilot campaigns, conservative recovery, blending and chemical control: in a modeled 10,000 m³/day system, a 10% seasonal permeance loss removes 1,000 m³/day unless pressure, area or runtime increases, and restoring output with a 12% pump-energy penalty at 0.8 kWh/m³ adds about 350 MWh/year. Long-duration industrial evidence illustrates the exposure—a yeast-wastewater pilot’s permeate output fell from 2,300 to 1,250 L/day, a 46% decline, while COD retention shifted from 86% to 92%, showing that product quality and throughput can move in opposite directions.
Vendors must therefore build regional feed libraries, dynamic process models, online conductivity/UV/TOC monitoring and adaptive cleaning controls, while contracts need feed envelopes and normalized-performance clauses rather than unconditional guarantees. The continuing engineering and warranty burden creates an estimated -1.4-percentage-point friction drag, strongest in variable textile, mining, landfill-leachate and coastal feeds across APAC and MENA, with normalization requiring more than four years of multi-season field data.
Challenges Impact Analysis
| Challenge | (~) % CAGR Friction | Geographic Relevance | Mitigation Horizon |
|---|---|---|---|
| Feedwater Performance Variability | -1.4 pp | Global; industrial APAC; MENA | Long term (≥4 years) |
| Skilled Operator Deficit | -1.1 pp | North America; EU; India; GCC | Long term (≥4 years) |
| Pilot-to-Scale Translation | -0.9 pp | Global innovation hubs | Medium term (2–4 years) |
| Fragmented Validation Standards | -0.7 pp | EU; North America; APAC exports | Medium term (2–4 years) |
| Materials Compliance Uncertainty | -0.6 pp | EU core; global exporters | Medium term (2–4 years) |
| Climate-Driven Feed Volatility | -0.5 pp | MENA; U.S. West; Southern EU; APAC | Long term (≥4 years) |
Geopolitical Impact Analysis
Geopolitical Influences on Global Nanofiltration Deployment and Supply Chains.
Geopolitical tensions, including trade restrictions and sanctions, have affected global supply chains for critical materials used in nanofiltration membranes. A study by the U.S. Department of Commerce in 2023 reported that restrictions on imports of specialty polymers and thin-film composite materials from certain countries have led to extended lead times for membrane production, impacting installation schedules in municipal and industrial facilities.
Similarly, the European Commission highlighted that reliance on imported ceramic powders for high-durability membranes exposes EU water infrastructure projects to supply volatility. Shipping disruptions associated with geopolitical conflicts have increased transport times by 20-30% for bulk chemical inputs, according to the United Nations Conference on Trade and Development (UNCTAD, 2023), complicating maintenance and expansion of multi-stage water treatment facilities.
Industrial examples include wastewater reuse initiatives in India and desalination plants in the Middle East, where delays in membrane module delivery affected operational planning and water recovery timelines. Additionally, fluctuations in natural gas and electricity prices, reported by the U.S. Energy Information Administration, have increased operational costs for pressure-driven membrane systems, as pumping and pretreatment are energy-intensive. These factors collectively underscore the sensitivity of nanofiltration deployment to geopolitical instability.
Regional Analysis
Asia Pacific Held the Largest Share of the Global Nanofiltration Membrane Market.
In 2025, the Asia Pacific dominated the global nanofiltration membrane market, holding about 43.5% of the total global consumption. The region represents a significant concentration of nanofiltration membrane deployment, driven by rapid industrialization, urbanization, and water stress. The United Nations World Water Development Report 2023 stated that over 1.5 billion people in the region live under high water stress, prompting extensive adoption of advanced water treatment technologies.
In India, the Central Water Commission documented that more than 600 urban centers face chronic freshwater shortages in 2022, leading municipal authorities to implement nanofiltration in wastewater reuse and desalination pretreatment projects. In addition, industrial usage is pronounced in the textile and pharmaceutical sectors. For instance, Gujarat’s textile clusters utilize nanofiltration to recycle up to 70% of process water, as per the Ministry of Environment, Forest, and Climate Change. The combination of regulatory enforcement, high water demand, and industrial activity positions the Asia Pacific as a leading hub for nanofiltration membrane adoption.
Key Regions and Countries Covered
- North America
- The US
- Canada
- Europe
- Germany
- France
- The UK
- Spain
- Italy
- Russia & CIS
- Rest of Europe
- APAC
- China
- Japan
- South Korea
- India
- ASEAN
- Rest of APAC
- Latin America
- Brazil
- Mexico
- Rest of Latin America
- Middle East & Africa
- GCC
- South Africa
- Rest of MEA
Key Players Analysis
Manufacturers of nanofiltration membranes primarily focus on innovation, operational efficiency, and geographic expansion to strengthen their competitive position. Technological advancements, such as developing hybrid polymeric-ceramic membranes and thin-film composite membranes with enhanced anti-fouling and chemical resistance, are central to improving performance and durability. Companies invest in optimizing manufacturing processes to reduce energy consumption and extend membrane lifespan, enabling cost-efficient operations for end-users.
Strategic collaborations with municipal authorities and industrial facilities facilitate customized solutions for specific water quality challenges, including wastewater reuse and partial desalination. Additionally, expanding production facilities and service networks across high-demand regions, such as the Asia Pacific and the Middle East, ensures timely supply and after-sales support. Emphasis on regulatory compliance, pilot testing, and membrane lifecycle management further differentiates manufacturers and strengthens their market presence.
The Major Players in The Industry
- DuPont Water Solutions
- Toray Industries, Inc.
- Hydranautics (Nitto Denko Corporation)
- Koch Separation Solutions
- Veolia Water Technologies
- SUEZ Water Technologies & Solutions
- Alfa Laval AB
- GEA Group AG
- Pentair plc (X-Flow)
- NX Filtration
- LG Chem
- Asahi Kasei Corporation
- Synder Filtration, Inc.
- Microdyn-Nadir GmbH
- Vontron Technology Co., Ltd.
- Parker Hannifin Corporation
- Applied Membranes, Inc.
- Other Key Players
Key Development
- In July 2023, DuPont commercially launched its DuPont FilmTec LiNE-XD and LiNE-XD HP nanofiltration membrane elements, its first products for lithium brine purification, providing high lithium passage from chloride-rich brines with strong selectivity over divalent metals.
- In December 2025, Toray Industries, Inc. developed a scalable, high-durability, high-selectivity nanofiltration membrane capable of efficiently recovering high-purity lithium from recycled automotive lithium-ion batteries, significantly improving yields compared to conventional recycling methods.
Report Scope
| Report Features | Description |
|---|---|
| Market Value (2025) | US$1.3 Bn |
| Forecast Revenue (2035) | US$3.9 Bn |
| CAGR (2026-2035) | 11.4% |
| Base Year for Estimation | 2025 |
| Historic Period | 2020-2024 |
| Forecast Period | 2026-2035 |
| Report Coverage | Revenue Forecast, Market Dynamics, Competitive Landscape, Recent Developments |
| Segments Covered | By Membrane Type (Polymeric, Ceramic, and Hybrid), By Membrane Module Configuration (Spiral Wound, Tubular, Hollow Fiber, Plate & Frame, and Others), By Application (Municipal and Industrial) |
| Regional Analysis | North America – The US & Canada; Europe – Germany, France, The UK, Spain, Italy, Russia & CIS, Rest of Europe; APAC– China, Japan, South Korea, India, ASEAN & Rest of APAC; Latin America– Brazil, Mexico & Rest of Latin America; Middle East & Africa– GCC, South Africa, & Rest of MEA |
| Competitive Landscape | DuPont Water Solutions, Toray Industries, Inc., Hydranautics (Nitto Denko Corporation), Koch Separation Solutions, Veolia Water Technologies, SUEZ Water Technologies & Solutions, Alfa Laval AB, GEA Group AG, Pentair plc (X-Flow), NX Filtration, LG Chem, Asahi Kasei Corporation, Synder Filtration, Inc., Microdyn-Nadir GmbH, Vontron Technology Co., Ltd., Parker Hannifin Corporation, Applied Membranes, Inc., and Other Players. |
| Customization Scope | Customization for segments, region/country-level will be provided. Moreover, additional customization can be done based on the requirements. |
| Purchase Options | We have three licenses to opt for: Single User License, Multi-User License (Up to 5 Users), Corporate Use License (Unlimited Users and Printable PDF) |





































