
Quick Navigation
Report Overview
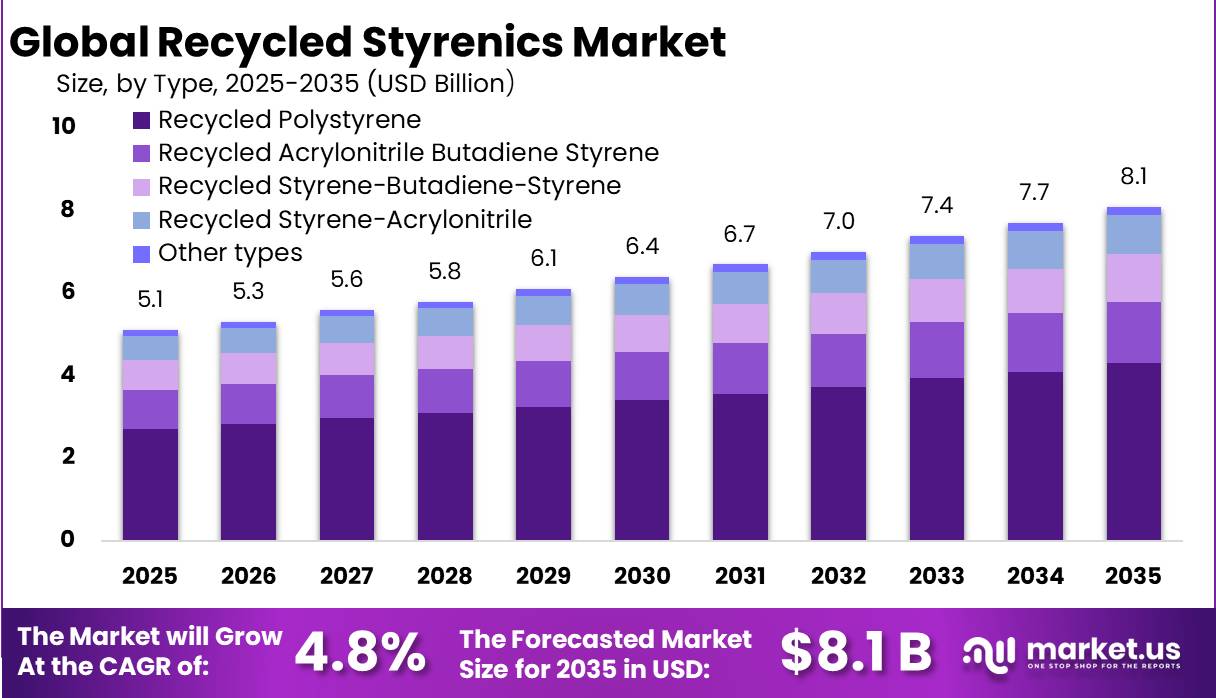
The Global Recycled Styrenics Market size is expected to be worth around USD 8.1 Billion by 2035, from USD 5.1 Billion in 2025, growing at a CAGR of 4.8% during the forecast period from 2026 to 2035. In 2025, Asia-Pacific held a dominant market position, capturing more than a 37.60% share, holding USD 1.9 Billion revenue.
Recycled styrenics are gaining industrial relevance as manufacturers seek lower-carbon alternatives to virgin ABS, polystyrene and EPS for packaging, construction insulation, electronics, automotive components and agricultural plastic applications. Global plastics production exceeds 400 million tonnes annually, while 19–23 million tonnes of plastic waste leak into aquatic ecosystems each year, creating strong pressure for circular material systems. The sector is gaining importance because global plastics use reached 435 million tonnes in 2020, while only 9% of plastic waste is recycled globally, showing a large gap for circular materials.
Industrial demand is supported by large waste streams and low recycling penetration. OECD states that plastic production, use and waste could rise 70% by 2040 without stronger policy action, while its global ambition scenario indicates recycled plastics could reach 41% market share by 2060 if coordinated policies are implemented. France also removed its national styrenic packaging ban in 2025 to align with EU Regulation 2025/40, giving styrenic packaging producers more regulatory clarity.
Key growth drivers include plastic-waste regulation, brand-owner recycled-content targets, lower carbon product demand and the need to reduce landfill. UNEP reported that more than 400 million tonnes of plastic are produced every year, while 19–23 million tonnes leak into aquatic ecosystems annually, pushing governments and companies toward circular plastics. The U.S. EPA also shows the opportunity clearly: only 13.6% of plastic containers and packaging waste was recycled in 2018, while more than 69% was landfilled.
Agriculture also strengthens the addressable opportunity. FAO reported that agricultural value chains used 12.5 million tonnes of plastic products in plant and animal production and 37.3 million tonnes in food packaging in 2019; crop and livestock sectors used 10 million tonnes, fisheries and aquaculture 2.1 million tonnes, and forestry 0.2 million tonnes. Policy is a key driver. In the EU, plastic packaging waste reached 16.16 million tonnes in 2022, of which 6.58 million tonnes or 40.7% was recycled. EU packaging rules are pushing all packaging to be recyclable by 2030, creating demand for recycled-content polymers and improved sorting, compounding and certification systems.
BASF SE is positioned through its styrenics value chain, which includes styrene monomers, polystyrene and EPS under Styropor® and Neopor®. In March 2025, BASF and partners introduced Neopor® F 5 Mcycled™, a graphite EPS granulate containing 10% recycled material from mechanically recycled EPS waste, with future intent to use EPS off-cuts from construction sites.
Key Takeaways
- Recycled Styrenics Market size is expected to be worth around USD 8.1 Billion by 2035, from USD 5.1 Billion in 2025, growing at a CAGR of 4.8%.
- Recycled Polystyrene (rPS) held a dominant market position, capturing more than a 53.20% share of the recycled styrenics market.
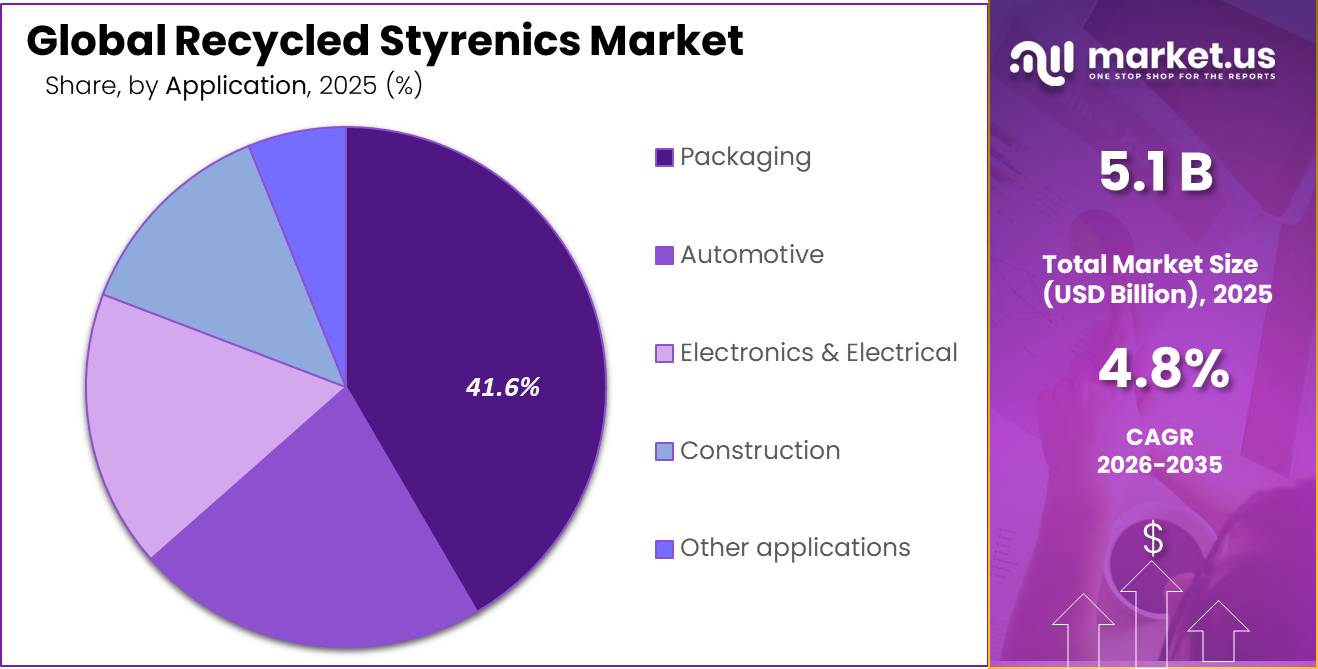
- Packaging held a dominant market position, capturing more than a 41.60% share of the recycled styrenics market.
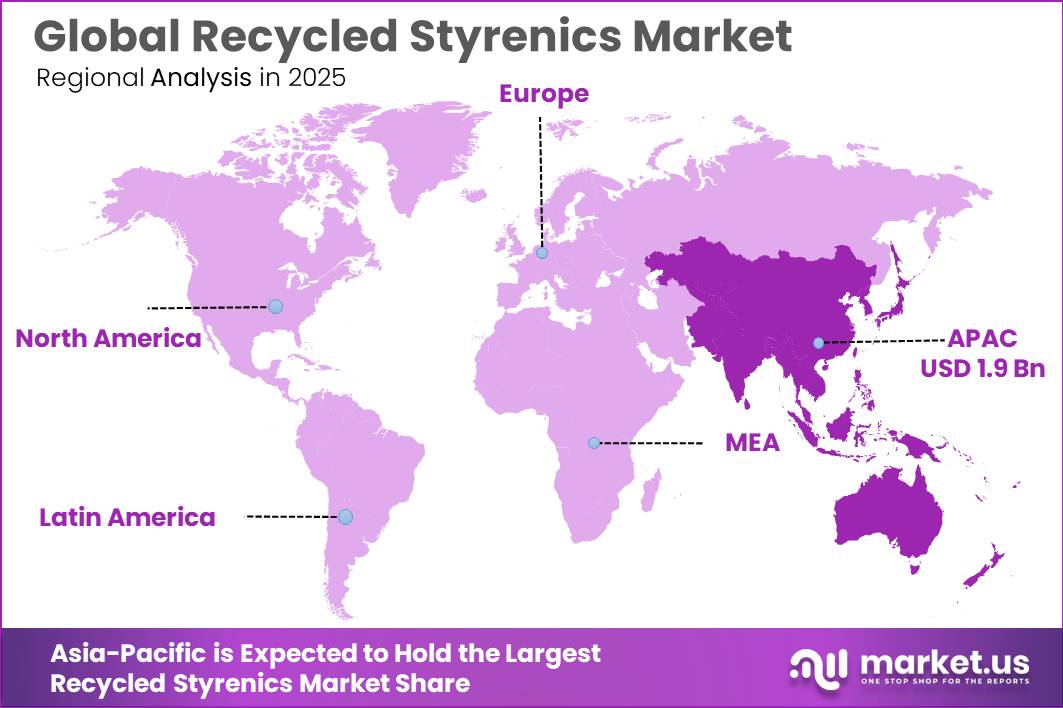
- Asia-Pacific held the dominant position in the global recycled styrenics market, accounting for 37.60% of the total market share and reaching a value of USD 1.9 Billion.
By Type Analysis
Recycled Polystyrene (rPS) dominates with 53.20% share due to increasing demand for sustainable plastic recovery and wider use across manufacturing industries.
In 2025, Recycled Polystyrene (rPS) held a dominant market position, capturing more than a 53.20% share of the recycled styrenics market by type. This leading position was mainly supported by the growing focus on plastic circularity, increasing collection and processing of post-consumer polystyrene waste, and stronger demand for recycled materials across packaging, consumer goods, and industrial applications. Manufacturers continued to adopt rPS as a practical alternative to virgin polystyrene because it helps reduce raw material dependency while supporting environmental goals.
By Application Analysis
Packaging dominates with 41.60% share driven by rising use of recycled materials and growing demand for sustainable packaging solutions.
In 2025, Packaging held a dominant market position, capturing more than a 41.60% share of the recycled styrenics market by application. The segment maintained its leading role due to the increasing use of recycled styrenic materials in protective packaging, food containers, consumer product packaging, and lightweight transport solutions. Businesses continued to shift toward recycled content as sustainability targets became more important across supply chains and packaging design decisions.
Key Market Segments
By Type
- Recycled Polystyrene (rPS)
- Recycled Acrylonitrile Butadiene Styrene (rABS)
- Recycled Styrene-Butadiene-Styrene (rSBS)
- Recycled Styrene-Acrylonitrile (rSAN)
- Other types
By Application
- Packaging
- Automotive
- Electronics & Electrical (E&E)
- Construction
- Other applications
Emerging Trends
Circular Food Packaging and Higher Recycled Content Targets are Emerging as a Major Trend
One of the latest trends shaping the recycled styrenics market is the growing move toward circular packaging systems and increased use of recycled content in food and consumer packaging. Packaging manufacturers and food-related industries are redesigning products to keep materials in use for longer and reduce dependence on virgin plastics. This trend is creating new opportunities for recycled styrenics, especially in packaging formats where lightweight performance and material recovery are becoming equally important.
According to the OECD, global plastic waste reached 353 million tonnes, while only 9% of plastic waste was ultimately recycled. Packaging remains one of the largest contributors to plastic consumption and waste generation worldwide. At the same time, recycled content policies are becoming more common across industries and government programs to improve material circularity and reduce environmental pressure.
Advanced Recycling and Packaging Recovery Systems are Improving Material Availability
Another important trend in the recycled styrenics market is the expansion of advanced recycling systems and stronger packaging recovery infrastructure. Companies are investing in improved sorting, cleaning, and processing technologies to recover more usable plastic and produce better-quality recycled material suitable for industrial and packaging use.
According to the European Parliament, the European Union generated 16.16 million tonnes of plastic packaging waste in 2022, and 6.58 million tonnes, equal to 40.7%, was recycled. These numbers show how stronger collection and recycling systems are increasing material availability and encouraging greater use of recycled plastics across manufacturing sectors.
Drivers
Rising Packaging Waste and Recycling Pressure is Driving Demand for Recycled Styrenics
One of the strongest growth drivers for the recycled styrenics market is the increasing pressure to reduce plastic waste generated by packaging and consumer industries. Packaging remains one of the largest users of styrenic materials because of its lightweight structure, low cost, and protective performance. However, the growing volume of discarded packaging has pushed industries and governments to look for better recycling solutions.
According to OECD data, global plastic waste reached 353 million tonnes, and nearly 40% of this waste came from packaging-related applications. At the same time, only 9% of plastic waste was successfully recycled worldwide, showing a large gap between plastic use and material recovery. These numbers have increased attention on recycled polymers such as recycled styrenics, which allow industries to recover value from post-consumer waste instead of relying fully on virgin plastic production.
Government Circular Economy Initiatives and Recycling Targets are Supporting Market Expansion
Government-led recycling programs and circular economy policies are creating long-term support for recycled styrenics across multiple industries. Many national and regional authorities are moving beyond waste collection and are encouraging higher recycled material usage in manufacturing and packaging systems.
According to the European Parliament, the recycling rate of plastic packaging waste in Europe increased from 25.2% in 2005 to 40.7% in 2022. This steady improvement reflects stronger collection systems, recycling investments, and policy support aimed at reducing dependence on virgin plastics. These initiatives are encouraging manufacturers to increase the use of recycled raw materials, including recycled styrenic products.
Restraints
Limited Collection and Low Recycling Rates Continue to Restrict Recycled Styrenics Growth
One of the major restraining factors for the recycled styrenics market is the limited collection and recovery of plastic waste, especially for polystyrene-based materials used in packaging and food-related applications. Although recycled styrenics support circular material use, the supply of recyclable feedstock remains inconsistent across many regions. Collection systems are often unable to separate styrenic plastics efficiently, which reduces the volume of material available for recycling.
According to the OECD Global Plastics Outlook, global plastic waste reached 353 million tonnes, yet only 9% was recycled. More than 50% was sent to landfill while nearly 19% was incinerated. These figures show the challenge faced by recycling industries in securing enough quality waste material for processing. Food packaging applications add another layer of complexity because contamination from food residue often lowers recovery efficiency and increases sorting costs.
Food Contact Regulations and Material Quality Challenges Limit Wider Adoption
Another important challenge for the recycled styrenics market is meeting strict quality and safety requirements for food and consumer packaging applications. Recycled materials intended for food-related uses must comply with detailed regulations regarding contamination control, traceability, and material performance. These requirements often increase processing costs and limit the amount of recycled content that manufacturers can use.
According to the European Environment Agency, packaging accounts for around 40% of plastic demand in Europe, making food and consumer packaging one of the largest application areas. However, maintaining recycled material quality at industrial scale remains difficult because collected waste streams frequently contain mixed plastics and impurities. To address this issue, governments and regulatory bodies continue investing in circular economy programs and improved recycling standards.
Opportunity
Expanding Use of Recycled Content in Food Packaging Creates New Growth Opportunities
One of the strongest growth opportunities for the recycled styrenics market is the increasing use of recycled materials in food and consumer packaging. Packaging companies and food-related industries are under growing pressure to reduce waste, improve circularity, and increase recycled content in everyday products. This shift is opening new opportunities for recycled styrenics, especially in secondary packaging, protective packaging, and selected non-direct food contact applications.
According to the European Environment Agency, packaging represents nearly 40% of total plastic demand in Europe, making it one of the largest end-use sectors for recycled materials. At the same time, the European Union has introduced packaging and waste reduction initiatives that encourage higher use of recycled content and better recycling systems. These policy changes are creating stronger demand for recovered plastic streams and supporting investment in recycling technologies.
Government Circular Economy Programs and Better Recycling Infrastructure Support Market Expansion
Another major opportunity for recycled styrenics comes from public investment and government-led circular economy programs focused on improving plastic recovery and reuse. Countries across different regions are increasing support for recycling infrastructure, waste sorting, and material recovery to reduce landfill dependence and strengthen domestic recycling capacity.
According to the OECD, global plastic use has doubled over the last two decades to around 460 million tonnes annually. At the same time, only 9% of plastic waste is recycled globally. This large recovery gap creates significant room for recycled materials, including styrenics, to expand through improved collection and recycling systems.
Regional Insights
Asia-Pacific dominated the Recycled Styrenics Market with a 37.60% share, reaching USD 1.9 Billion due to expanding recycling capacity and strong packaging demand
In 2025, Asia-Pacific held the dominant position in the global recycled styrenics market, accounting for 37.60% of the total market share and reaching a value of USD 1.9 Billion. The region’s leadership was supported by its large manufacturing base, rising plastic recovery activities, and growing demand for recycled materials across packaging, consumer goods, electronics, and industrial applications. Countries across the region continued strengthening recycling networks and investing in circular economy practices to reduce dependence on virgin plastics.
The packaging industry remained one of the strongest contributors to regional demand, supported by increasing consumption of packaged goods and expanding urban populations. Growing awareness around plastic waste management also encouraged industries to increase recycled content usage in production. Several countries in Asia-Pacific introduced initiatives focused on improving waste collection, sorting efficiency, and recycling infrastructure, creating a more stable supply of recyclable feedstock.
Key Regions and Countries Insights
- North America
- US
- Canada
- Europe
- Germany
- France
- The UK
- Spain
- Italy
- Rest of Europe
- Asia Pacific
- China
- Japan
- South Korea
- India
- Australia
- Rest of APAC
- Latin America
- Brazil
- Mexico
- Rest of Latin America
- Middle East & Africa
- GCC
- South Africa
- Rest of MEA
Key Players Analysis
BASF SE remains an important participant in the recycled styrenics market through its focus on circular materials, recycled feedstock integration, and advanced polymer production capabilities. The company operates in more than 90 countries and serves customers across packaging, automotive, construction, and consumer industries. BASF generated approximately €68.9 billion in annual sales in 2025 and continued expanding its sustainable product portfolio.
LG Chem Ltd continues to strengthen its position in recycled styrenics through sustainable material development and expansion of recycled polymer applications. The company operates manufacturing and business networks across major global regions and supports industries including packaging, electronics, and automotive. In 2025, LG Chem recorded annual revenue exceeding KRW 48 trillion.
Trinseo LLC plays a notable role in the recycled styrenics market through its portfolio of styrenic solutions and circular material initiatives. The company supports customers across approximately 60 countries and focuses on engineered materials, plastics, and latex solutions. In 2025, Trinseo reported annual sales of around USD 3.5 billion.
Top Key Players Outlook
- BASF SE
- LG Chem Ltd
- Trinseo LLC
- AmSty
- ALPLA
- Chevron Corporation
- Eni S.p.A
- INEOS Styrolution
- MBA Polymers
- SABIC
- Americas Styrenics LLC
Recent Industry Developments
In 2025, Chevron Corporation’s role in the recycled styrenics sector was mainly linked through its 50% ownership in Chevron Phillips Chemical, which holds 50% of Americas Styrenics alongside Trinseo. Americas Styrenics operates 7 production facilities and supplies polystyrene and styrene across the Americas, giving Chevron indirect exposure to recycled styrenics.
Report Scope
| Report Features | Description |
|---|---|
| Market Value (2025) | USD 5.1 Bn |
| Forecast Revenue (2035) | USD 8.1 Bn |
| CAGR (2026-2035) | 4.8% |
| Base Year for Estimation | 2025 |
| Historic Period | 2020-2024 |
| Forecast Period | 2026-2035 |
| Report Coverage | Revenue Forecast, Market Dynamics, Competitive Landscape, Recent Developments |
| Segments Covered | By Type (Recycled Polystyrene (rPS), Recycled Acrylonitrile Butadiene Styrene (rABS), Recycled Styrene-Butadiene-Styrene (rSBS), Recycled Styrene-Acrylonitrile (rSAN), Other types), By Application (Packaging, Automotive, Electronics And Electrical (E&E), Construction, Other applications) |
| Regional Analysis | North America – US, Canada; Europe – Germany, France, The UK, Spain, Italy, Rest of Europe; Asia Pacific – China, Japan, South Korea, India, Australia, Singapore, Rest of APAC; Latin America – Brazil, Mexico, Rest of Latin America; Middle East & Africa – GCC, South Africa, Rest of MEA |
| Competitive Landscape | BASF SE, LG Chem Ltd, Trinseo LLC, AmSty, ALPLA, Chevron Corporation, Eni S.p.A, INEOS Styrolution, MBA Polymers, SABIC, Americas Styrenics LLC |
| Customization Scope | Customization for segments, region/country-level will be provided. Moreover, additional customization can be done based on the requirements. |
| Purchase Options | We have three licenses to opt for: Single User License, Multi-User License (Up to 5 Users), Corporate Use License (Unlimited User and Printable PDF) |


