
Quick Navigation
Market Overview
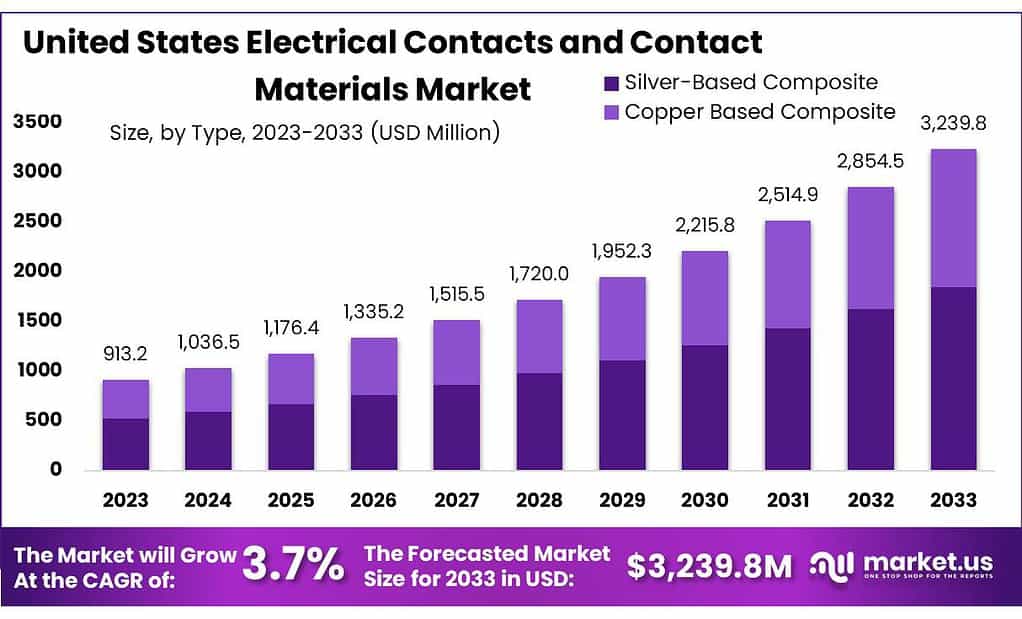
The United States Electrical Contacts and Contact Materials Market size is expected to be worth around USD 3239.8 Mn by 2033, from USD 913.2 Mn in 2023, growing at a CAGR of 3.7% during the forecast period from 2023 to 2033.
The United States Electrical Contacts and Contact Materials Market refers to the industry involved in the design, manufacturing, and distribution of electrical contacts and contact materials used in various electrical devices and components.
This market encompasses a wide range of materials and components crucial for the efficient transmission of electrical current, including but not limited to alloy-based contacts, silver-based contacts, and other contact materials.
Electrical contacts are essential components found in switches, relays, connectors, and other electrical devices, ensuring reliable and efficient electrical conductivity. The market is influenced by factors such as technological advancements, demand from various end-use industries, and the evolving landscape of electrical applications.
By Type
In 2023, Copper Composite emerged as the leading type in the United States Electrical Contacts and Contact Materials market, capturing over 54.2% of the share. This indicates that a significant portion of the market demand was driven by copper-based composite materials for electrical contacts.
Copper-based composite materials are valued for their excellent electrical conductivity, thermal conductivity, and mechanical properties, making them suitable for a wide range of electrical applications. These materials are commonly used in electrical contacts for various devices and equipment, including switches, relays, connectors, and circuit breakers.
One key advantage of copper-based composite materials is their cost-effectiveness compared to silver-based composites. Copper is more abundant and less expensive than silver, making copper-based materials a preferred choice for applications where cost efficiency is a primary consideration.
Copper-based composite materials offer good corrosion resistance and durability, ensuring reliable performance and longevity in demanding electrical environments. These materials are also highly customizable, allowing manufacturers to tailor their properties to meet specific application requirements, such as conductivity levels, wear resistance, and thermal stability.
By Application
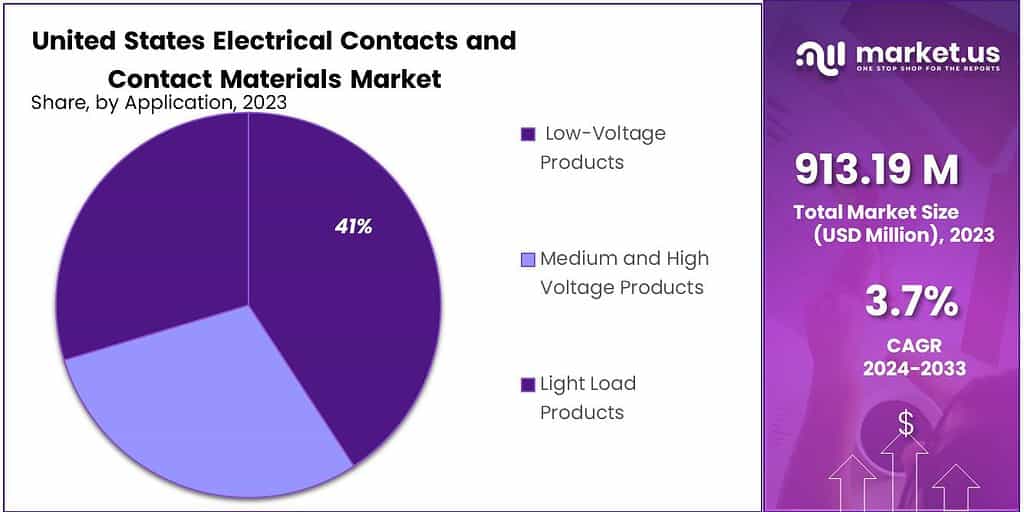
In 2023, Low-Voltage Products emerged as the leading application segment in the United States Electrical Contacts and Contact Materials market, capturing more than a 43% share. This indicates that a significant portion of the market demand was driven by the use of electrical contacts and contact materials in low-voltage products.
Low-voltage products encompass a wide range of electrical devices and equipment operating at voltages below 1000 volts, including switches, sockets, circuit breakers, and control panels. These products are commonly used in residential, commercial, and industrial applications for powering lighting systems, appliances, and electronic devices.
One key factor contributing to the dominance of low-voltage products is their widespread use in everyday electrical applications. From household appliances to industrial machinery, low-voltage products play a crucial role in powering various systems and equipment, driving consistent demand for electrical contacts and contact materials.
Additionally, the increasing adoption of automation and smart technologies in homes, buildings, and industries further fuels the demand for low-voltage products, as these systems often require reliable electrical contacts for efficient operation and control.
By End-Use
In 2023, the United States Electrical Contacts and Contact Materials market saw a diverse range of end-uses, with Automotive emerging as the dominant sector. Automotive applications captured the largest share of the market, reflecting the extensive use of electrical contacts and contact materials in vehicles for various functions like ignition systems, lighting, and control panels.
The Electronics sector also played a significant role in the market, representing a key end-use for electrical contacts and contact materials. In the electronics industry, these components are essential for ensuring reliable connections and electrical conductivity in devices such as computers, smartphones, and consumer electronics.
Power Generation constituted another major end-use segment, encompassing the use of electrical contacts and contact materials in power generation equipment such as generators, turbines, and transformers. These components are crucial for transmitting and distributing electricity efficiently and safely in power generation facilities.
Furthermore, the Aerospace and Defense sector represented a notable portion of the market, relying on electrical contacts and contact materials for applications in aircraft, spacecraft, military vehicles, and defense systems. These components play a critical role in ensuring the performance, reliability, and safety of electrical systems in aerospace and defense applications.
Key Market Segments
By Type
- Silver-Based Composite
- Copper Based Composite
By Application
- Low-Voltage Products
- Medium and High Voltage Products
- Light Load Products
By End-use
- Automotive
- Electronics
- Power Generation
- Aerospace and Defense
- Others
Drivers
One significant driver in the United States Electrical Contacts and Contact Materials Market is the rapid technological advancements in various industries. As industries such as automotive, electronics, aerospace, and defense continue to evolve, there’s an increasing demand for more efficient, reliable, and durable electrical components. This drives the need for advanced electrical contacts and contact materials that can withstand higher voltages, currents, and operating temperatures while ensuring consistent performance and reliability.
Another key driver is the growing demand for electric vehicles (EVs) and hybrid vehicles in the automotive industry. As the automotive sector transitions towards cleaner and more sustainable transportation solutions, there’s a rising need for electrical contacts and contact materials used in EV components such as battery management systems, electric motors, and charging infrastructure. This surge in demand for EV-related components is expected to fuel the growth of the electrical contacts and contact materials market in the automotive sector.
The increasing adoption of automation and smart technologies across industries is driving the demand for electrical contacts and contact materials. In sectors such as manufacturing, energy, and telecommunications, automation and smart technologies require reliable electrical connections to enable seamless communication, data transmission, and control.
This drives the need for high-quality electrical contacts and contact materials that can facilitate efficient and reliable electrical connections in automated systems. The expanding renewable energy sector, particularly solar and wind power generation, is contributing to the growth of the electrical contacts and contact materials market.
As countries strive to reduce their reliance on fossil fuels and transition towards cleaner energy sources, there’s a growing demand for electrical contacts and contact materials used in renewable energy systems such as solar panels, wind turbines, and energy storage systems. This presents significant opportunities for manufacturers of electrical contacts and contact materials to cater to the needs of the renewable energy sector.
Restraints
One notable restraint in the United States Electrical Contacts and Contact Materials Market is the increasing competition from alternative technologies. As industries continue to explore and adopt alternative solutions such as wireless communication and solid-state electronics, there’s a growing challenge for traditional electrical contacts and contact materials.
These alternative technologies offer advantages such as reduced maintenance requirements, lower energy consumption, and enhanced reliability, posing a threat to the market share of traditional electrical contacts and contact materials. The volatility in raw material prices presents a significant restraint for manufacturers in the electrical contacts and contact materials market.
Many of the materials used in the production of electrical contacts, such as copper, silver, and precious metals, are subject to price fluctuations due to factors such as supply-demand dynamics, geopolitical tensions, and currency fluctuations. This volatility in raw material prices can impact manufacturing costs, profit margins, and pricing strategies, posing challenges for manufacturers in managing their production costs and maintaining competitiveness in the market.
Another key restraint is the increasing regulatory requirements and environmental regulations governing the use of materials in electrical contacts and contact materials. Regulatory compliance involves ensuring that materials used in electrical contacts meet stringent safety, environmental, and quality standards set by regulatory authorities.
Compliance with these regulations requires significant investments in testing, certification, and quality assurance processes, adding to the overall production costs and operational complexity for manufacturers. The complexity and precision required in the manufacturing process of electrical contacts and contact materials pose challenges for manufacturers.
Producing high-quality electrical contacts and contact materials involves intricate processes such as machining, plating, and heat treatment, which require specialized equipment, skilled labor, and strict quality control measures. Any deviations or defects in the manufacturing process can result in substandard products, leading to quality issues, customer dissatisfaction, and potential legal liabilities.
Opportunities
Despite the challenges, the United States Electrical Contacts and Contact Materials Market present several promising opportunities for growth and development. One significant opportunity lies in the increasing adoption of electric vehicles (EVs) and renewable energy technologies.
As the automotive industry shifts towards electric and hybrid vehicles, there’s a growing demand for advanced electrical contacts and contact materials used in EV components such as battery management systems, electric motors, and charging infrastructure.
Similarly, the expansion of renewable energy sources such as solar and wind power generation creates opportunities for electrical contacts and contact materials in renewable energy systems such as solar panels, wind turbines, and energy storage systems.
The ongoing digitalization and automation across industries present significant opportunities for electrical contacts and contact materials manufacturers. Industries such as manufacturing, energy, telecommunications, and transportation are increasingly adopting automation and smart technologies, driving the demand for reliable electrical connections in automated systems.
This creates opportunities for manufacturers to develop innovative electrical contacts and contact materials that can withstand the rigors of automation and enable seamless communication, data transmission, and control. The increasing emphasis on sustainability and energy efficiency presents opportunities for manufacturers to develop eco-friendly and energy-efficient electrical contacts and contact materials.
With growing awareness about environmental issues and the need to reduce carbon emissions, there’s a demand for materials that minimize energy consumption, reduce waste, and enhance the overall sustainability of electrical systems. Manufacturers can capitalize on this trend by innovating new materials, processes, and technologies that align with sustainability goals and offer environmental benefits.
Challenges
The United States Electrical Contacts and Contact Materials Market faces several challenges that impact its growth and development. One significant challenge is the increasing competition from alternative technologies. As industries explore and adopt alternative solutions such as wireless communication, solid-state electronics, and contactless technologies, there’s a growing threat to traditional electrical contacts and contact materials.
These alternative technologies offer advantages such as reduced maintenance requirements, lower energy consumption, and enhanced reliability, posing a challenge for traditional electrical contacts and contact materials to maintain their market share. The volatility in raw material prices represents a significant challenge for manufacturers in the electrical contacts and contact materials market.
Many of the materials used in the production of electrical contacts, such as copper, silver, and precious metals, are subject to price fluctuations due to factors such as supply-demand dynamics, geopolitical tensions, and currency fluctuations. This volatility in raw material prices can impact manufacturing costs, profit margins, and pricing strategies, posing challenges for manufacturers in managing their production costs and maintaining competitiveness in the market.
Another key challenge is the increasing regulatory requirements and environmental regulations governing the use of materials in electrical contacts and contact materials. Regulatory compliance involves ensuring that materials used in electrical contacts meet stringent safety, environmental, and quality standards set by regulatory authorities.
Compliance with these regulations requires significant investments in testing, certification, and quality assurance processes, adding to the overall production costs and operational complexity for manufacturers. The complexity and precision required in the manufacturing process of electrical contacts and contact materials pose challenges for manufacturers.
Producing high-quality electrical contacts and contact materials involves intricate processes such as machining, plating, and heat treatment, which require specialized equipment, skilled labor, and strict quality control measures. Any deviations or defects in the manufacturing process can result in substandard products, leading to quality issues, customer dissatisfaction, and potential legal liabilities.
Key States Covered in this Report
- Texas
- Montana
- Kansas
- Nebraska
- South Dakota
- New Mexico
- North Dakota
- Oklahoma
- Colorado
- Iowa
- Wyoming
- Missouri
- Illinois
- Arizona
- Minnesota
- California
- Oregon
- Indiana
- Washington
- Wisconsin
- Arkansas
- Ohio
- Kentucky
- Idaho
- Tennessee
- Utah
- Mississippi
- Georgia
- Florida
- Michigan
- North Carolina
- Alabama
- Louisiana
- Virginia
- Pennsylvania
- New York
- Nevada
- South Carolina
- West Virginia
- Maryland
- Maine
- Vermount
- Hawaii
- Alaska
- New Jersey
- Delaware
- Massachusetts
- New Hampshire
- Connecticut
- Rhode Island
Key Players Analysis
The United States Electrical Contacts and Contact Materials market boast a robust landscape, characterized by key players who significantly influence its dynamics. Among these major contributors are companies that excel in manufacturing electrical contacts and contact materials, shaping the market’s trajectory.
Маrkеt Кеу Рlауеrѕ
- DODUCO
- Umicore
- Toshiba
- Chugai Electric
- Tanaka
- Heesung
- MATERION
- MITSUBISHI Material
Report Scope
| Report Features | Description |
| Market Value (2023) | USD 913.2 Mn |
| Forecast Revenue (2033) | USD 3239.8 Mn |
| CAGR (2024-2032) | 3.7% |
| Base Year for Estimation | 2023 |
| Historic Period | 2018-2022 |
| Forecast Period | 2024-2033 |
| Report Coverage | Revenue Forecast, Market Dynamics, COVID-19 Impact, Competitive Landscape, Recent Developments |
| Segments Covered | By Type(Silver-Based Composite, Copper Based Composite), By Application(Low-Voltage Products, Medium and High Voltage Products, Light Load Products), By End-use(Automotive, Electronics, Power Generation, Aerospace and Defense, Others) |
| State Wise Analysis | Texas, Montana, Kansas, Nebraska, South Dakota, New Mexico, North Dakota, Oklahoma, Colorado, Iowa, Wyoming, Missouri, Illinois
Arizona, Minnesota, California, Oregon, Indiana, Washington, Wisconsin, Arkansas, Ohio, Kentucky, Idaho, Tennessee, Utah, Mississippi, Georgia, Florida, Michigan, North Carolina, Alabama, Louisiana, Virginia, Pennsylvania, New York, Nevada, South Carolina, West Virginia, Maryland, Maine, Vermount, Hawaii, Alaska, New Jersey, Delaware, Massachusetts, New Hampshire, Connecticut, Rhode Island |
| Competitive Landscape | DODUCO, Umicore, Toshiba, Chugai Electric, Tanaka, Heesung, MATERION, MITSUBISHI Material |
| Customization Scope | Customization for segments, region/country-level will be provided. Moreover, additional customization can be done based on the requirements. |
| Purchase Options | We have three licenses to opt for: Single User License, Multi-User License (Up to 5 Users), Corporate Use License (Unlimited User and Printable PDF) |


