
Quick Navigation
Market Overview
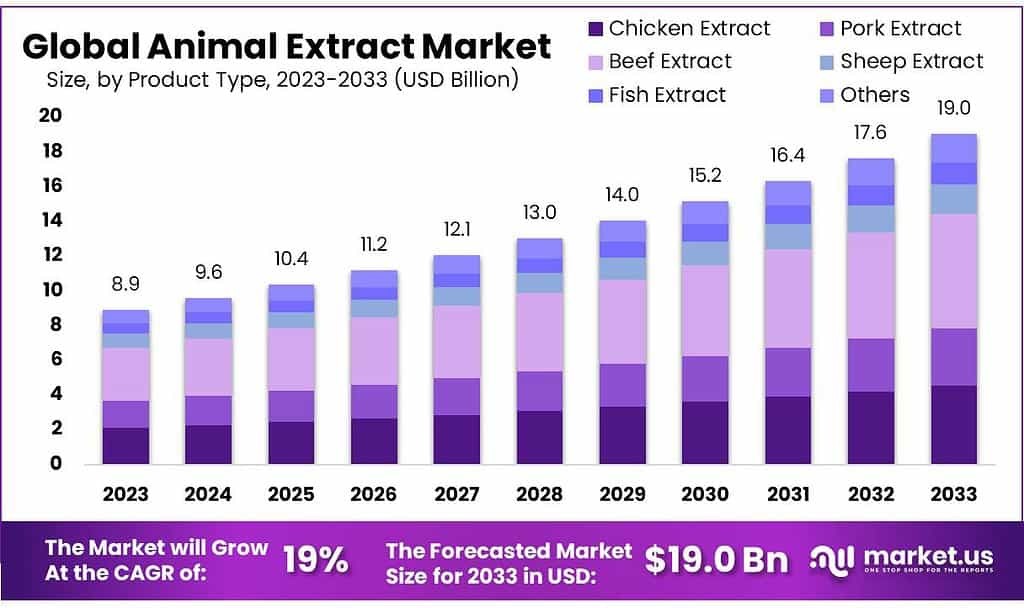
Animal Extract Market size is expected to be worth around USD 19.0 Billion by 2033, from USD 8.9 Billion in 2023, growing at a CAGR of 7.9% during the forecast period from 2023 to 2033.
The term “Animal Extract Market” generally refers to the market associated with the production, processing, and trade of various substances derived from animals for various purposes.
These extracts can be obtained from different parts of animals, including tissues, organs, glands, or fluids, and they find applications in various industries such as food and beverages, pharmaceuticals, cosmetics, and more. It’s important to note that the term is broad and encompasses a diverse range of products.
Key Takeaways
- Strong Market Growth: The Animal Extract Market is projected to grow at a CAGR of 7.9%, reaching USD 19.0 Billion by 2033 from USD 8.9 Billion in 2023.
- Beef Extract Dominance: Beef Extract held 34.6% of the market share in 2023 due to its rich flavor and popularity.
- Diverse Animal Extracts: Besides beef, chicken, pork, sheep, and fish extracts offer unique flavors for culinary experimentation.
- Mechanical Grinding Prevalence: Mechanical Grinding dominated with over 60.7% market share in 2023, preserving natural flavors.
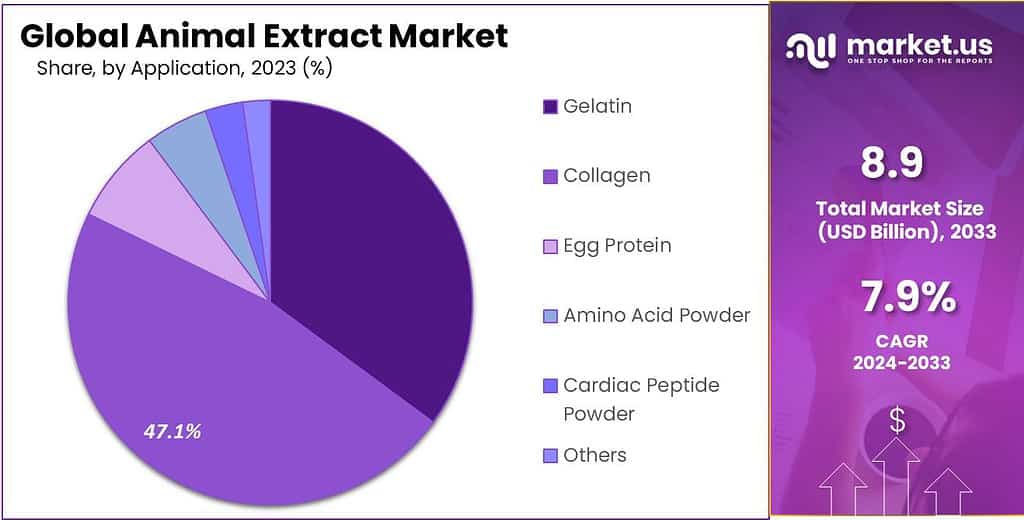
- Collagen’s Market Share: Collagen led with 47.1% market share in 2023, driven by health-focused products.
- Food and Beverage Leadership: Food and Beverage Industry led with 40.7% market share in 2023.
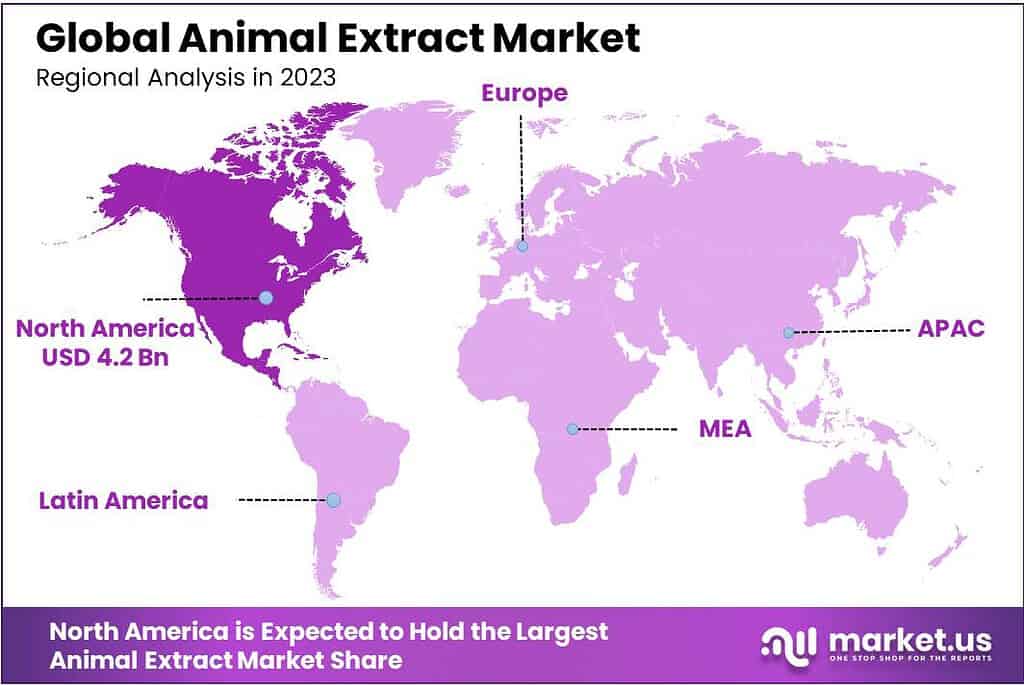
- Regional Analysis: North America held 46.7% market share in 2023, while Asia Pacific saw rapid growth due to China’s collagen trend.
By Product Type
In the dynamic landscape of the Animal Extract market, Beef Extract has asserted its dominance in 2023, capturing an impressive 34.6% market share. This reflects the widespread preference for beef-derived extracts, indicating its popularity among consumers and food industry professionals.
The versatile nature of Beef Extract contributes to its market stronghold. Beef extract is famous for its rich and tasty flavor, and chefs use it in many types of cooking to make food more delicious. People find it not only in restaurants but also in food factories where they make packaged foods. Many households also use beef extract to make their home-cooked meals more flavorful.
Even though beef extract is on top, it’s important to remember that there are many other types of animal extracts out there. Chicken, pork, sheep, and fish extracts are also important in different cooking styles. They bring their unique flavors to dishes, and people enjoy experimenting with these different tastes. So, while beef extract is popular, there’s a variety of animal extracts that people use for different flavors in their cooking.
As the culinary landscape continues to evolve and consumers explore diverse tastes, the market dynamics for animal extracts may witness shifts, creating opportunities and challenges for different types of extracts. In conclusion, Beef Extract’s dominance in 2023 highlights its current popularity, but the market remains dynamic and responsive to changing consumer preferences.
The interplay between various animal extracts will shape the future trajectory of the Animal Extract market, making it an interesting space to watch for culinary trends and evolving tastes.
By Technology
In the dynamic landscape of the Animal Extract market, the year 2023 witnessed the ascendancy of Mechanical Grinding as the predominant technology, capturing an impressive market share exceeding 60.7%. This technology, characterized by its mechanical processes, plays a pivotal role in extracting essential components from a variety of animal sources.
The dominance of Mechanical Grinding underscores its efficacy and straightforward approach in breaking down animal tissues to obtain desired extracts. Mechanical Grinding’s prominence reflects its widespread adoption and acceptance within the animal extract industry.
People really like Mechanical Grinding because it keeps the natural flavors of animal extracts intact. This method fits well with what consumers want nowadays – they appreciate genuine and natural flavors in their food. So, Mechanical Grinding is seen as a trustworthy and useful technology, playing a big part in making the Animal Extract market more lively and growing.
As the market continues to evolve, the sustained dominance of Mechanical Grinding reaffirms its position as a cornerstone technology, shaping the trajectory of the Animal Extract industry. Its efficiency, coupled with the ability to cater to the diverse demands of consumers, positions Mechanical Grinding as a driving force behind the market’s resilience and continual expansion.
By Application
In the dynamic landscape of the Animal Extract market, Collagen emerged as the frontrunner in 2023, capturing an impressive market share exceeding 47.1%. This dominance underscores the extensive utilization of Collagen across diverse applications within the market.
Collagen’s significance extends to various products, including gelatin, egg protein, amino acid powder, cardiac peptide powder, and more. Its versatility makes it a sought-after ingredient, contributing to its pivotal role in the Animal Extract sector. People like Collagen in the market. This is because a lot of folks are now choosing things that are good for their health.
Collagen is in many products that focus on health. This makes Collagen an important factor in how the market is changing. It shows that more people are making choices that are good for their well-being. This is part of a bigger movement where consumers are choosing things that are good for their health in their everyday lives.
Collagen’s dominant market position suggests its resilience and adaptability in catering to evolving consumer demands. The multifaceted nature of Collagen, spanning different applications, underscores its versatility and importance, indicating its potential to maintain a significant role in the Animal Extract market’s growth trajectory in the coming years.
By End Use Industry
In 2023, the Food and Beverage Industry took the lead in the Animal Extract market, securing a significant 40.7% share. The Food and Beverage Industry takes the lead in the Animal Extract market, showcasing how widely animal extracts are used in cooking. They bring rich flavors and unique profiles to many dishes, making them key ingredients in creating diverse and tasty culinary experiences for people.
Apart from cooking, animal extracts are also vital in the Microbiological Culture Media segment. While this segment doesn’t have the top position, it is crucial for providing the necessary components for microbiological studies and research. Animal extracts act as valuable nutrients in creating culture media, helping in the growth and study of microorganisms in laboratories.
In the Pharmaceutical sector, animal extracts are crucial for making medicines and pharmaceutical products. They are used in various applications, including creating drugs, vaccines, and other therapeutic formulations. The fact that the Pharmaceutical industry depends on animal extracts highlights how important they are in advancing healthcare and medicine. The Pet Food Industry is a crucial part of the Animal Extract market.
Pet owners care a lot about their animals, and this has led to a growing demand for high-quality pet food that includes essential nutrients like animal extracts. People want the best and healthiest options for their pets, contributing to the rise in demand for animal extracts in the pet food sector.
Even though the Food and Beverage Industry holds the top position, the diverse uses of animal extracts in these different segments show how versatile and essential they are. From supporting scientific research to playing a role in healthcare and pet care, animal extracts have become vital in various fields. The Animal Extract market keeps changing based on what consumers in different industries need and prefer.
Key Market Segments
By Product Type
- Chicken Extract
- Pork Extract
- Beef Extract
- Sheep Extract
- Fish Extract
- Others
By Technology
- Mechanical Grinding
- Industrial Microbial Enzyme
By Application
- Gelatin
- Collagen
- Egg Protein
- Amino Acid Powder
- Cardiac Peptide Powder
- Others
By End-User
- Food And Beverage Industry
- Microbiological Culture Media
- Pharmaceutical
- Pet Food Industry
Drivers
The Animal Extract Market is growing a lot, and different things are making it happen. One big reason is that people want natural and real flavors in their food and drinks. So, they use extracts from animals like beef, chicken, pork, and fish to make the food taste better. This is making the Animal Extract Market bigger because more people want these flavors in what they eat.
Another reason for the market’s growth is that people care more about being healthy. Collagen is a kind of animal extract that is good for health. It is used in things like dietary supplements, skincare products, and foods that have health benefits. Since many people want to be healthier, the demand for collagen is going up, and this is helping the Animal Extract Market to get bigger.
The pharmaceutical industry needs animal extracts to make medicines, vaccines, and other therapeutic products. This helps in making advancements in healthcare. The link between animal extracts and new developments in medicines is making the market grow. The Animal Extract Market is growing because people care about what they feed their pets.
Pet owners want high-quality food with good nutrients from animal extracts for their animals. This shows a bigger trend towards better and healthier options in the pet care world. In conclusion, the Animal Extract Market is doing well because people like certain flavors in their food, they want to be healthy, the pharmaceutical industry uses these extracts, and there’s a higher demand for good pet food. All these things are making the Animal Extract Market important in different industries.
Restraints
While the Animal Extract Market is flourishing, it faces certain challenges that impact its continued growth. While the Animal Extract Market is doing well, it faces some challenges that can affect its continued success. One big challenge is that more people are thinking about the environment and animals. This means some are choosing plant-based options instead of traditional animal extracts.
This shift in choice can impact the demand for animal extracts. Money-related things are also a challenge. Sometimes, the cost of making animal extracts can change a lot, and there can be problems with getting the materials needed. This can make it tough for companies, and it might not be steady for the market. Dealing with these challenges will be important for the Animal Extract Market to keep growing and be successful in a world where things are always changing.
Moreover, regulatory considerations and standards pose complexities for the industry. Adhering to evolving regulations related to animal welfare, food safety, and environmental impact requires additional efforts and investments, influencing the overall market dynamics. Successfully addressing these restraints will be crucial for the Animal Extract Market to adapt to changing consumer preferences, economic fluctuations, and regulatory landscapes, ensuring its sustained relevance and growth in a competitive environment.
Opportunities
There are great chances for the Animal Extract Market to grow and improve. One big opportunity comes from the rising interest in alternative and eco-friendly sources for animal extracts. People are becoming more aware of ethical and environmental concerns, so they prefer plant-based alternatives.
Companies in the Animal Extract Market can explore new and sustainable ways to get extracts, matching the worldwide trend towards eco-friendly choices. Working together and forming partnerships is another way for the Animal Extract Market to grow.
Companies can team up with other businesses in food or pharmaceuticals. By working together, they can create special products that meet the needs of different customers. This not only helps companies reach more customers but also lets them explore new areas and markets. It’s about coming up with new ideas and products by working together.
In the changing Animal Extract Market, using new technologies can be a big chance for companies. Things like automation and smart solutions can help make production faster and better for the environment. Companies that use these technologies can stay ahead and take advantage of the changing market.
Challenges
In the world of the Animal Extract Market, some challenges need attention for steady growth. One important challenge comes from people caring more about where products come from. They are more aware of ethical and environmental issues linked to animal-derived products. Because of this, some are choosing plant-based options instead.
This shift in what people prefer is a challenge for traditional animal extracts, affecting how much people want them and how much of the market they have. Economic factors add to the difficulties for the Animal Extract Market. Changes in costs and disruptions in the supply chain can make things uncertain for manufacturers. The ups and downs in prices and the availability of raw materials create a changing environment.
To navigate this, businesses need to be adaptable and plan strategically. Navigating these challenges will require the industry to embrace innovation and explore alternative sourcing methods aligned with sustainability goals. Additionally, fostering strategic collaborations within and beyond the industry can open avenues for addressing these challenges and ensuring a resilient and prosperous future for the Animal Extract Market.
Regional Analysis
North America’s 46.7% market share in 2023, the animal extract market is a globally rising tide lifting all boats. Europe boasts green giants like Gelita and a focus on sustainable sourcing. Asia Pacific surges with the fastest growth, fueled by China’s collagen craze and local players like Eastsun.
Latin America joins the collagen party, while Africa and the Middle East hold untapped potential. Sustainability, personalization, and technological advancements like bio-fermentation weave a diverse market tapestry, promising an even more vibrant global picture in the years to come.
Key Regions and Countries
- North America
- US
- Canada
- Mexico
- Europe
- Germany
- UK
- France
- Italy
- Russia
- Spain
- Rest of Europe
- APAC
- China
- Japan
- South Korea
- India
- Rest of Asia-Pacific
- South America
- Brazil
- Argentina
- Rest of South America
- MEA
- GCC
- South Africa
- Israel
- Rest of MEA
Key Players Analysis
As of the latest available information, the Animal Extract Market features several key players contributing significantly to its dynamics. Leading companies in this market are involved in the extraction, processing, and distribution of a diverse range of animal-derived products catering to various industries. These players often demonstrate a global presence and engage in strategic initiatives such as mergers, acquisitions, collaborations, and product innovations to maintain a competitive edge.
Маrkеt Кеу Рlауеrѕ
- Unilever PLC.
- Lauridsen Group Inc.
- Novozymes A/S
- Colin Ingredients SAS
- Elite Flavor Bioengineering Co. Ltd.
- Creative Enzymes
- Carnad A/S
- Nikken Foods Co., Ltd.
- Crescent Biotech
- LIS France SA
- DuPont de Nemours, Inc.
- Koninklijke DSM N.V.
- BASF SE
- Amano Enzyme Inc.
Report Scope
| Report Features | Description |
|---|---|
| Market Value (2023) | USD 8.9 Bn |
| Forecast Revenue (2033) | USD 19.0 Bn |
| CAGR (2023-2032) | 7.9% |
| Base Year for Estimation | 2023 |
| Historic Period | 2018-2022 |
| Forecast Period | 2024-2033 |
| Report Coverage | Revenue Forecast, Market Dynamics, Competitive Landscape, Recent Developments |
| Segments Covered | By Product Type(Chicken Extract, Pork Extract, Beef Extract, Sheep Extract, Fish Extract, Others), By Technology(Mechanical Grinding, Industrial Microbial Enzyme), By Application(Gelatin, Collagen, Egg Protein, Amino Acid Powder, Cardiac Peptide Powder, Others), By End-User(Food And Beverage Industry, Microbiological Culture Media, Pharmaceutical, Pet Food Industry) |
| Regional Analysis | North America – The US, Canada, & Mexico; Western Europe – Germany, France, The UK, Spain, Italy, Portugal, Ireland, Austria, Switzerland, Benelux, Nordic, & Rest of Western Europe; Eastern Europe – Russia, Poland, The Czech Republic, Greece, & Rest of Eastern Europe; APAC – China, Japan, South Korea, India, Australia & New Zealand, Indonesia, Malaysia, Philippines, Singapore, Thailand, Vietnam, & Rest of APAC; Latin America – Brazil, Colombia, Chile, Argentina, Costa Rica, & Rest of Latin America; Middle East & Africa – Algeria, Egypt, Israel, Kuwait, Nigeria, Saudi Arabia, South Africa, Turkey, United Arab Emirates, & Rest of MEA |
| Competitive Landscape | Nitto Denko Corporation, Von Roll Holding AG, Cottrell Paper Company Inc., Teijin Limited, Delfortgroup AG, Yantai Metastar Special Paper Co. Ltd., Miki Tokushu Paper Mfg. Co. Ltd., Weidmann Electrical Technology AG, 3M Company, ABB, Dow, DuPont Inc. |
| Customization Scope | Customization for segments, region/country-level will be provided. Moreover, additional customization can be done based on the requirements. |
| Purchase Options | We have three licenses to opt for: Single User License, Multi-User License (Up to 5 Users), Corporate Use License (Unlimited User and Printable PDF) |
Frequently Asked Questions (FAQ)
Animal Extract Market Size is expected to be worth around USD 19.0 Billion by 2033, from USD 8.9 Billion in 2023
Unilever PLC., Lauridsen Group Inc. , Novozymes A/S, Colin Ingredients SAS, Elite Flavor Bioengineering Co. Ltd., Creative Enzymes, Carnad A/S, Nikken Foods Co., Ltd., Crescent Biotech, LIS France SA, DuPont de Nemours, Inc., Koninklijke DSM N.V., BASF SE, Hansen Holding A/S, Amano Enzyme Inc.,


