
Quick Navigation
Report Overview
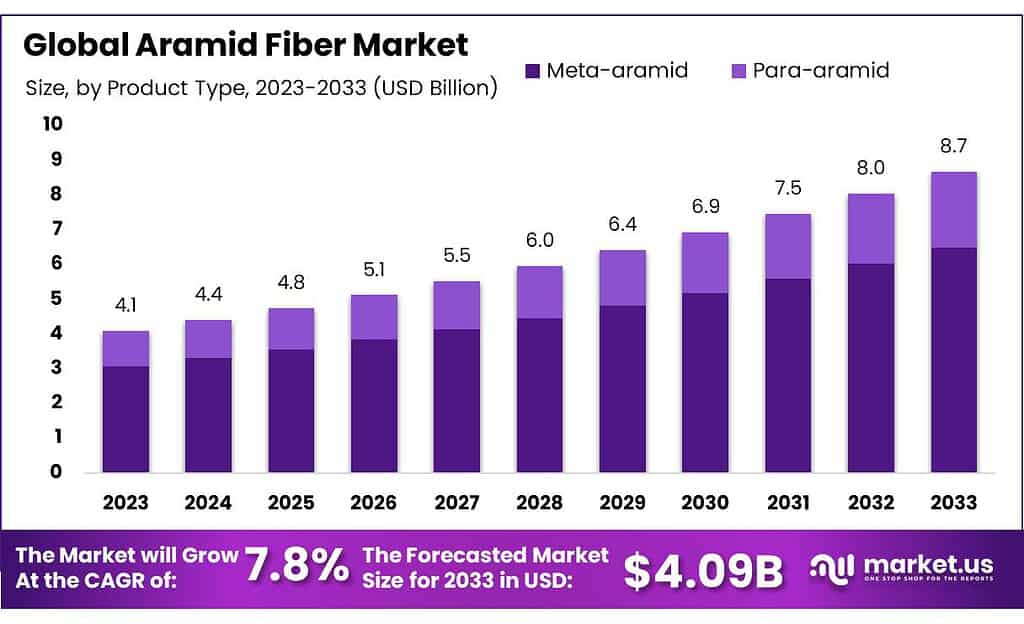
The global aramid fiber market size is expected to be worth around USD 10.4 billion by 2033, from USD 4.9 billion in 2023, growing at a CAGR of 7.8% during the forecast period from 2023 to 2033.
Market growth is expected to be driven by rising demand from different industries, including oil and gas, manufacturing, and healthcare.
Note: Actual Numbers Might Vary In Final Report
Key Takeaways
- Market Growth Projection: The aramid fiber market is expected to grow significantly, reaching around USD 10.4 billion by 2033 from USD 4.9 billion in 2023, indicating a CAGR of 7.8%.
- Product Dominance: Para-aramid fibers held a significant share in 2021 and are expected to maintain a 75.1% share between 2023-2032 due to their exceptional properties like strength-to-weight ratio, chemical resistance, and flame resistance.
- Applications and Usage: Aramid fibers find extensive usage in security and protection (expected to grow at 35.5%), aerospace components due to their strength, and in frictional materials like brake pads. They also serve in replacing asbestos due to their resilience under high temperature and pressure.
- Market Drivers: They are increasingly replacing traditional materials like steel in various industries due to their lightweight nature, thermal, and chemical resistance. They are seen as a potential alternative in the automotive and construction sectors.
- Market Challenges: Despite their advantages, aramid fibers pose environmental challenges as they are non-biodegradable. Their complex production process also contributes to high production costs.
- Opportunities: The growing demand for homeland security and the need for advanced protective equipment are driving the market forward.
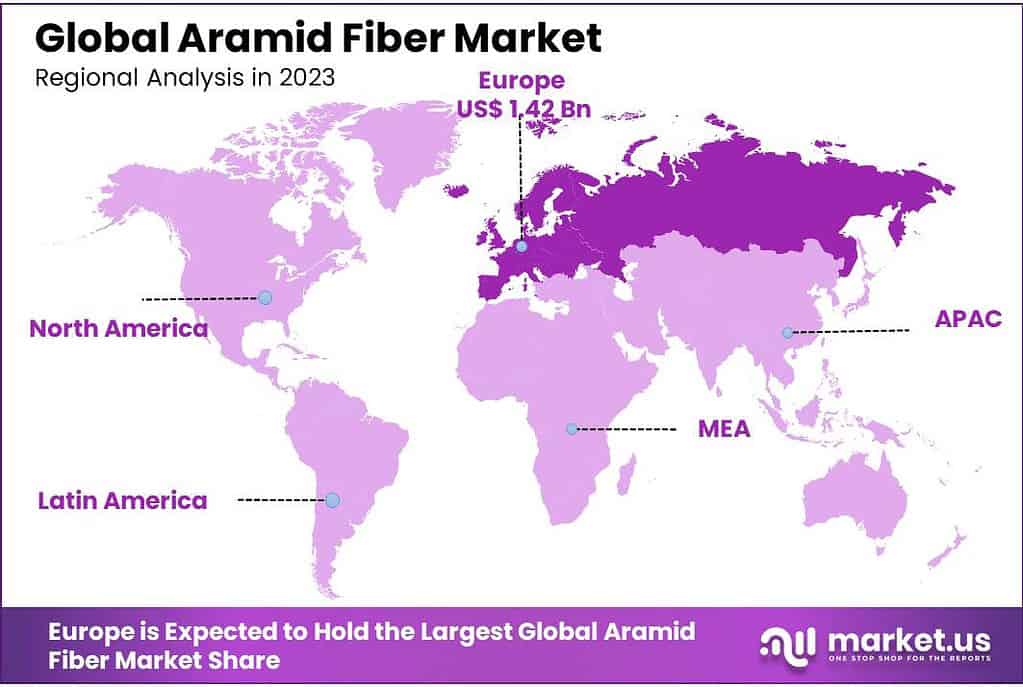
- Regional Analysis: Europe is projected to grow significantly, while rising military spending in China and India, coupled with investments in construction and healthcare sectors, will contribute to market growth in these regions.
- Key Players and Developments: Companies like DuPont, Teijin Limited, and Toray Industries are prominent players. Recent developments include innovations in manufacturing technologies and substantial investments in increasing production capacities.
Product Analysis
Para-aramid products dominated the aramid fiber market in 2021 and are expected to show a revenue- Share of 75.1% between 2023-2032. Segment growth is expected to be aided by the segment’s excellent strength-to-weight ratio, modulus behavior, and high tensile strength over the forecast period.
This product has excellent ballistic properties, including a low elongation-to-break, high chemical resistance, and heat and flame resistance, as well as outstanding ballistic properties. It is anticipated that this will fuel its demand during the forecast period. It is expected that its high cut resistance, good chemical resistance, and other applications, including aerospace, security, protection, and frictional materials, will increase its consumption.
Wet spinning technology is used to manufacture meta-aramid fiber. This involves spinning the fiber in a chemical solution and then forming semi-crystalline products. This product is able to withstand extreme tensile stresses when exposed to flames or temperatures up to 400 degrees Celsius, making it suitable for high-temperature applications.
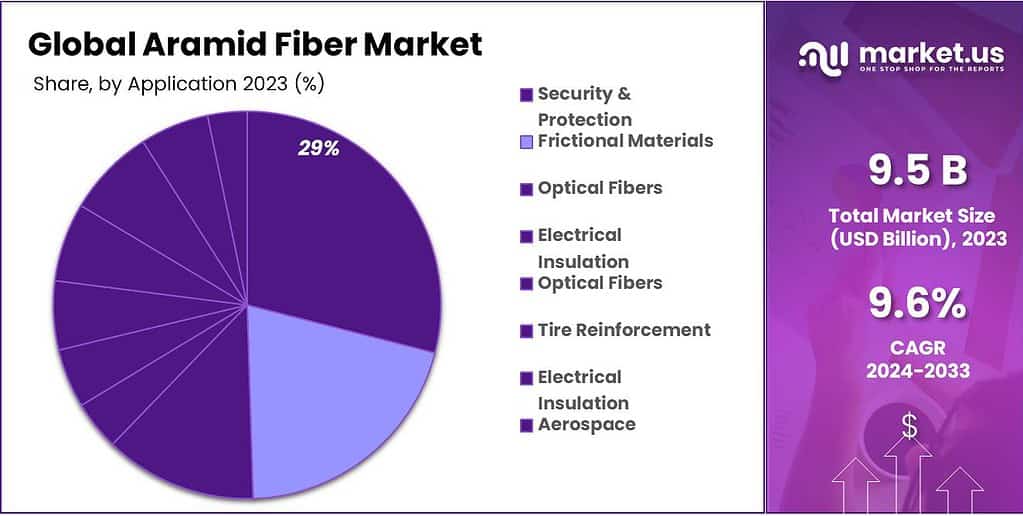
Application Analysis
Security and protection accounted for the largest market share. It is expected to grow at 35.5% revenue-based from 2023-2032. The growth of this application segment is expected to be aided by the increased use of bullet-resistant and protective clothing, as well as stab-resistant products like helmets and gloves.
Aerospace components like the primary wing structure, landing gear doors, fuselage structure, and leading and tailing edge panels are increasingly made from aramid fiber. High product consumption is expected due to the product’s superior strength, impact resistance and low weight.
Aramid fibers can be used to replace asbestos in sealing and friction products. The product can also be used to reinforce friction products like brake pads or clutch plates. They are also used in high-temperature/pressure hoses, seals, gaskets, and seals. Market growth is expected to be aided by this product over the forecast period.
Other applications include composites, filtration, and ropes and cables. Product adoption is encouraged by their key benefits, including low density, high strength and resistance to impact and abrasion, chemical resistance and resistance to thermal decay.
Note: Actual Numbers Might Vary In Final Report
Key Market Segmentation
By Product
- Meta-aramid
- Para-aramid
By Application
- Frictional Materials
- Security & Protection
- Optical Fibers
- Electrical Insulation
- Tire Reinforcement
- Aerospace
- Rubber Reinforcement
- Other applications
Drivers
Potential alternative for steel and asbestos
Aramid fibers have gained traction in the automotive industry as they replace steel in components like gaskets and brake pads. This shift is fueled by the considerable weight difference between steel and aramid fiber. The lightweight nature of aramid fibers reduces vehicle weight, enhancing speed and lowering fuel consumption. Moreover, their superior thermal and chemical resistance makes aramid fibers a more suitable alternative to steel.
In the building and construction sector, aramid fibers are also displacing steel and asbestos in materials such as ceiling and structural composites. Their ability to endure high temperatures and pressures without degradation, coupled with remarkable strength, positions them as a secure substitute for asbestos. This substitution holds particular significance due to the health risks linked to asbestos exposure, prompting many countries to impose bans or restrictions on asbestos products owing to a rising number of asbestos-related fatalities.
Restraints
Non-biodegradable nature of aramid fibers
Aramid fibers offer exceptional properties suitable for diverse industrial applications, yet they present environmental challenges.
Their resistance to biodegradation raises concerns regarding disposal, potentially causing pollution by accumulating in landfills and obstructing drainage systems. Moreover, the inhalation of dust from cut aramid fibers can lead to respiratory issues, emphasizing the necessity of careful handling.
Opportunities
Growing demand for homeland security
The security and protection sector plays a crucial role in the application of aramid fibers. Amid rising global conflicts, there’s an amplified need for heightened safety measures, especially for military personnel.
This necessitates more advanced weaponry and personal protective equipment (PPE), thereby propelling the growth of the aramid fiber market.
Challenges
High cost of production
In contrast to traditional materials such as steel or aluminum, the production process of aramid fibers is notably complex, necessitating substantial investments in technology, machinery, and raw material supply. This intricacy, coupled with research and development expenses, poses a challenge to the growth of the aramid fiber market.
Fluctuations in fuel prices directly impact production costs, while increased expenses for raw materials, energy, fuel, and transportation intensify cost pressures. Nevertheless, advancements in manufacturing technologies tailored for aramid fibers and the achievement of economies of scale are expected to gradually reduce costs in the final products over time.
Regional Analysis
The European market is expected to grow at 34.9% on a revenue basis by 2032. Industry growth is expected to be fueled by the increasing number of renovation activities in the region and strict regulations regarding the security of workers in various industries.
Due to increasing geopolitical tensions, rising military spending in major economies like China and India is expected to provide growth opportunities for this product. In addition to rising investment in the construction, manufacturing, and healthcare sectors, product demand is expected to increase over the forecast period.
The American National Standards Institute (ANSI), which is responsible for protecting personnel protective equipment, will likely fuel the demand to produce protective gloves, helmets, and clothing. This will be a positive factor in the North American market’s expansion over the forecast period.
Note: Actual Numbers Might Vary In Final Report
Кеу Regions and Countries
-
North America
- US
- Canada
- Mexico
-
Europe
- Germany
- UK
- France
- Italy
- Russia
- Spain
- Rest of Europe
-
APAC
- China
- Japan
- Korea
- India
- Rest of Asia-Pacific
-
South America
- Brazil
- Argentina
- Rest of South America
-
MEA
- GCC
- South Africa
- Israel
- Rest of MEA
Key Companies Analysis
To gain market share, the key players employ strategies like joint ventures and technical collaboration. To increase their market share, manufacturers also work hard to develop high-quality and cost-effective products.
Key Market Players
- DuРоnt dе Nеmоurѕ Іnс.
- Yаntаі Тауhо Аdvаnсеd Маtеrіаlѕ Со. Ltd
- Теіјіn Lіmіtеd
- Нуоѕung Соrроrаtіоn
- Тоrау Іnduѕtrіеѕ Іnс. (Тоrау Сhеmісаlѕ Ѕоuth Коrеа Іnс.)
- Кеrmеl Ѕ.А.
- Коlоn Іnduѕtrіеѕ
- НUVІЅ Соrр.
- Other Key Players
Recent Development
June 2022: Teijin Aramid B.V. introduced the Woven Matrix concept for the easy manufacturing of various ballistic protection solutions. The company’s high-performance para-aramid, Twaron, is used to create the woven matrix. The new fabric-based matrix technology would help the company assist its defense and security customers in streamlining their manufacturing processes by reducing the need for pre-pegging activities.
May 2022: Taekwang Industry announced an investment of USD 112 million to boost aromatic polyamide (aramid) production from 1,500 tons to 5,000 tons per annum by 2025.
Report Scope
| Report Features | Description |
|---|---|
| Market Value (2023) | USD 4.9 Billion |
| Forecast Revenue (2033) | USD 10.4 Billion |
| CAGR (2023-2032) | 7.8% |
| Base Year for Estimation | 2023 |
| Historic Period | 2017-2022 |
| Forecast Period | 2024-2033 |
| Report Coverage | Revenue Forecast, Market Dynamics, Competitive Landscape, Recent Developments |
| Segments Covered | By Crust Type (Thin Crust, Thick Crust, Stuffed, Others), By Type (Non-Veg, Veg), By Toppings (Meat, Vegetables, Cheese, Others), By Size (Large, Regular, Extra-large), By Distribution Channel (Supermarkets/Hypermarkets, Convenience Stores, Specialty Stores, Online Retail, Others) |
| Regional Analysis | North America – The US, Canada, & Mexico; Western Europe – Germany, France, The UK, Spain, Italy, Portugal, Ireland, Austria, Switzerland, Benelux, Nordic, & Rest of Western Europe; Eastern Europe – Russia, Poland, The Czech Republic, Greece, & Rest of Eastern Europe; APAC – China, Japan, South Korea, India, Australia & New Zealand, Indonesia, Malaysia, Philippines, Singapore, Thailand, Vietnam, & Rest of APAC; Latin America – Brazil, Colombia, Chile, Argentina, Costa Rica, & Rest of Latin America; Middle East & Africa – Algeria, Egypt, Israel, Kuwait, Nigeria, Saudi Arabia, South Africa, Turkey, United Arab Emirates, & Rest of MEA |
| Competitive Landscape | Bellisio Foods Inc., Hansen Foods Inc., Nestle S.A., One Planet Pizza, Daiya Foods Inc., McCain Foods Ltd., Oetker GmbH, California Pizza Kitchen Inc., Atkins Nutritionals, Freiberger Lebensmittel GmbH |
| Customization Scope | Customization for segments, region/country-level will be provided. Moreover, additional customization can be done based on the requirements. |
| Purchase Options | We have three licenses to opt for: Single User License, Multi-User License (Up to 5 Users), Corporate Use License (Unlimited User and Printable PDF) |
Frequently Asked Questions (FAQ)
Aramid fibers are a class of strong, heat-resistant synthetic fibers. They are known for their exceptional strength-to-weight ratio, high resistance to abrasion, and tolerance to heat. Two popular types are para-aramid (such as Kevlar) and meta-aramid (like Nomex).
The market is expected to continue growing due to increased demand for lightweight, strong materials across various industries. Technological advancements improving the properties of aramid fibers and finding more sustainable manufacturing methods may further drive market growth.
Demand for Safety Solutions: Growing emphasis on safety across various industries. Advancements in Technology: Continuous improvements in fiber properties. Expansion in End-Use Industries: Increased use in automotive, aerospace, and defense. Environmental Regulations: Shift towards more sustainable and eco-friendly materials.


