


Report Overview
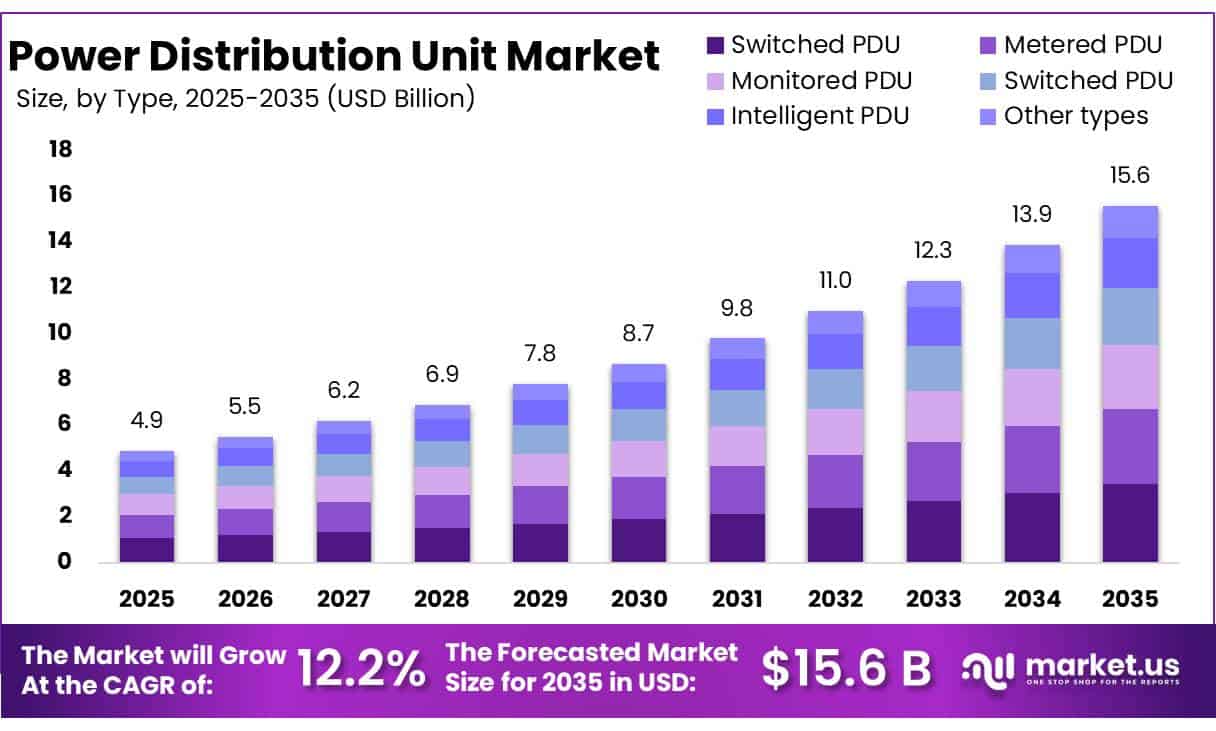
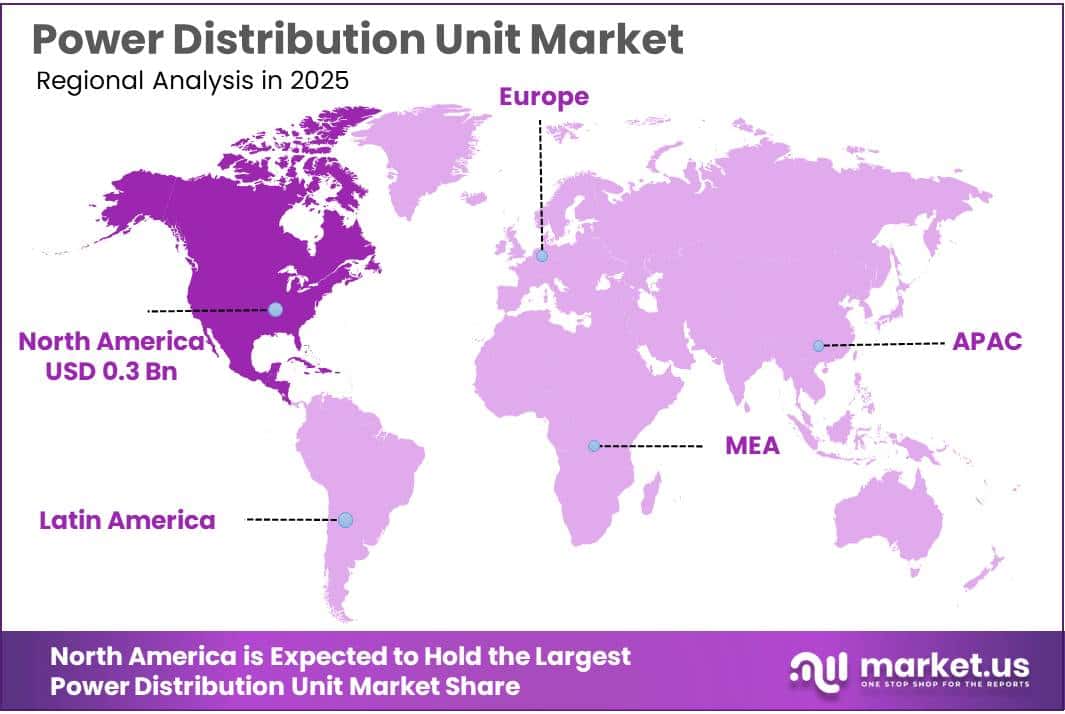
The Global Power Distribution Unit Market size is expected to be worth around USD 15.6 Billion by 2035, from USD 4.9 Billion in 2025, growing at a CAGR of 12.2% during the forecast period from 2026 to 2035. In 2025, North America held a dominant market position, capturing more than a 35.0% share, holding USD 0.3 Billion revenue.
The Power Distribution Unit (PDU) industry forms an important part of modern electrical infrastructure, providing controlled and reliable distribution of electricity to servers, networking equipment, industrial machinery, telecommunications systems, laboratories, and other critical loads. Demand is increasingly influenced by electrification, automation, cloud computing, and high-density computing infrastructure.
- According to the International Energy Agency (IEA), global electricity demand increased by 3% in 2025 and is forecast to rise by 3.6% in 2026 and 3.8% in 2027.
Data-center construction has become one of the strongest industrial drivers for advanced PDUs. The IEA estimates that data centres consumed approximately 415 TWh of electricity globally in 2024, equal to about 1.5% of worldwide electricity consumption. Under its base case, consumption is projected to reach roughly 945 TWh by 2030.
- The United States provides another indication of the scale of infrastructure expansion. The U.S. Department of Energy reported that data centres consumed around 176 TWh of electricity in 2023, representing approximately 4.4% of national electricity consumption. Usage could increase to between 325 TWh and 580 TWh by 2028.
Reliability requirements are also strengthening the business case for intelligent PDUs. Uptime Institute’s 2025 outage analysis found that power accounted for 54% of the most recent impactful data-center incidents reported in its survey, while networking represented 12% and cooling represented 13%. Such operational risks encourage facilities to invest in branch-level monitoring, overload alerts, redundancy management, remote outlet control, and predictive maintenance capabilities that can identify electrical problems before they interrupt critical workloads.
Digital connectivity further expands the underlying equipment base requiring reliable power distribution. The International Telecommunication Union estimated that 6 billion people, representing 74% of the global population, used the Internet in 2025, compared with 5.8 billion people in 2024. Growth in cloud services, telecommunications traffic, edge computing, network rooms, and colocation facilities consequently increases the installed base of racks and electrical equipment where PDUs provide power measurement, protection, and distribution.
Key Takeaways
- Power Distribution Unit Market size is expected to be worth around USD 15.6 Billion by 2035, from USD 4.9 Billion in 2025, growing at a CAGR of 12.2%.
- Switched PDU held a dominant market position, capturing more than a 22.00% share.
- Three-phase held a dominant market position, capturing more than a 58.00% share.
- 120–240 V held a dominant market position, capturing more than a 55.00% share.
- Data Centers held a dominant market position, capturing more than a 49.00% share.
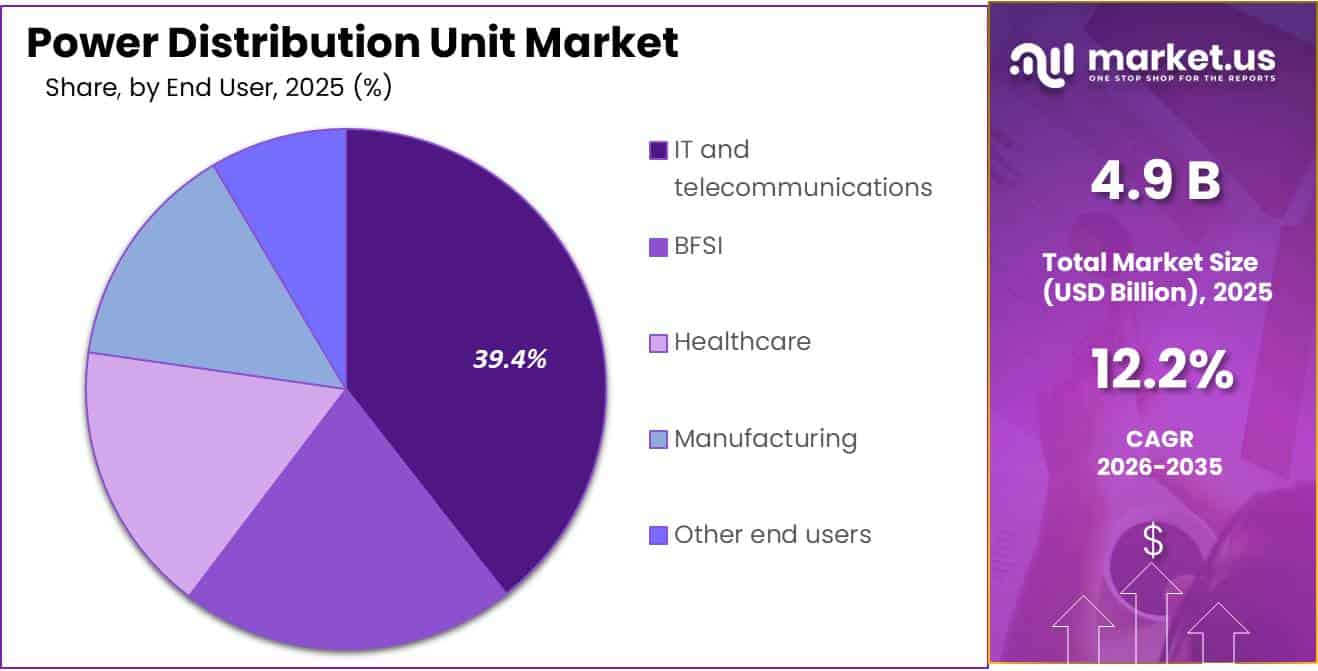
- IT and telecommunications held a dominant market position, capturing more than a 51.00% share.
- North America held a dominant market position, capturing more than a 35.00% share and generating about USD 0.35 billion.
By Type Analysis
Switched PDU dominates the Power Distribution Unit Market with a 22.00% share, supported by remote power control and growing data-center loads
In 2025, “Switched PDU” held a dominant market position, capturing more than a 22.00% share. Switched PDUs remain important in data centers and other critical IT facilities because they allow operators to control individual outlets remotely, restart equipment without physical access, and improve power management across server racks. Rising AI and high-density computing workloads are making these capabilities more useful as operators handle larger and more variable electrical loads.
- In 2026, the U.S. Department of Energy highlighted that data centers could account for 11.8% of total U.S. electricity consumption by the end of the decade, with modeled scenarios ranging from 9.5% to 15.3%. This increasing power requirement supports greater use of remotely managed distribution equipment, including switched PDUs, where power availability and rack-level control are critical.
In 2025, the U.S. Department of Energy identified 16 federal sites with potential for rapid data-center and energy-infrastructure development. Later in the same year, 4 sites were selected to move forward for potential AI data-center and associated power-generation projects. Larger numbers of high-capacity computing sites increase the requirement for controlled rack power, remote switching, load visibility, and reliable electrical distribution, strengthening the practical role of switched PDUs in modern facilities.
By Power Phase Analysis
Three-phase leads the Power Distribution Unit Market with a 58.00% share
In 2025, “Three-phase” held a dominant market position, capturing more than a 58.00% share. Three-phase PDUs are widely preferred in large data centers, AI computing facilities, industrial plants, and high-density server environments because they can distribute larger electrical loads across racks while supporting stable and efficient power delivery. The expansion of data-center infrastructure is strengthening this requirement.
- In 2026, the U.S. Energy Information Administration reported that data-center servers accounted for an estimated 7% of total U.S. commercial-sector electricity consumption in 2025. EIA also forecast U.S. electricity load to increase by 1.9% in 2026, with data-center development identified as an important driver of this growth.
Single-phase PDUs continue to serve smaller data centers, network closets, telecommunications rooms, office IT installations, laboratories, and lower-density server racks where power requirements are more moderate. Their relatively simple electrical configuration makes them practical for equipment that does not require the higher load capacity normally associated with three-phase distribution. Demand is supported by the continuing expansion of computing equipment across commercial buildings.
In its 2026 Annual Energy Outlook, the U.S. Energy Information Administration reported that national electricity demand had increased by an average of 2.1% per year during the previous five years and identified data-center server energy use as a major contributor to future electricity growth.
By Power Rating Analysis
120–240 V dominates the Power Distribution Unit Market with a 55.00% share
In 2025, “120–240 V” held a dominant market position, capturing more than a 55.00% share. This voltage range is widely suited to server racks, enterprise IT rooms, telecom equipment, and data-center power systems because it can support both standard and higher-density computing loads. Demand is becoming stronger as data-center electricity use rises. In 2026, the U.S. Energy Information Administration reported that data-center servers accounted for an estimated 7% of U.S. commercial-sector electricity consumption in 2025.
- The U.S. Environmental Protection Agency’s ENERGY STAR database also lists data-center and commercial UPS equipment operating at 208–240 V, including certified systems with active output ratings reaching 7,200 W. These operating characteristics support continued use of 120–240 V PDUs alongside UPS systems, servers, networking equipment, and other rack-level electrical infrastructure.
Up to 120 V continues to serve smaller server rooms, network closets, office IT systems, telecom installations, and other lower-density applications where individual equipment loads are comparatively modest. This voltage class remains useful where simple rack-level distribution and compatibility with conventional electrical infrastructure are important.
In 2026, the U.S. Energy Information Administration reported that U.S. electricity demand had grown by about 1.7% annually between 2020 and 2025, with data centers identified as an important source of new electricity demand. The U.S. EPA ENERGY STAR database also includes data-center and commercial power equipment operating at 120 V, with certified units ranging into the 1,800 W class.
By Application Analysis
Data centers dominate the Power Distribution Unit Market with a 49.00% share
In 2025, “Data centers” held a dominant market position, capturing more than a 49.00% share. Data centers remain the largest application for power distribution units because every server rack requires stable and organized electricity delivery for servers, storage systems, networking equipment, cooling controls, and other critical hardware. Growing AI workloads and high-density computing are also increasing rack-level power requirements, supporting the use of intelligent, switched, metered, and three-phase PDUs.
- In 2026, the U.S. Energy Information Administration reported that data-center servers accounted for an estimated 7% of U.S. commercial-sector electricity consumption in 2025. EIA also reported that U.S. electricity demand increased by around 1.7% annually between 2020 and 2025, with data-center electricity use identified as an important driver.
Laboratories continue to create steady demand for power distribution units because research facilities depend on uninterrupted electricity for analytical instruments, computing systems, testing equipment, environmental controls, data-acquisition systems, and specialized scientific machinery. PDUs help laboratories organize electrical loads while providing safer and more reliable power delivery across equipment racks and technical work areas.
By End User Analysis
IT and telecommunications leads the Power Distribution Unit Market with a 51.00% share as network infrastructure expands
In 2025, “IT and telecommunications” held a dominant market position, capturing more than a 51.00% share. The segment remains the largest user of PDUs because telecom networks, server rooms, data centers, switching facilities, and network equipment require reliable power around the clock. Growing mobile broadband and 5G infrastructure are increasing the amount of powered equipment deployed across these facilities.
- According to the International Telecommunication Union, there were 9.2 billion mobile-cellular subscriptions worldwide in 2025, equal to 112 subscriptions per 100 people. Mobile broadband reached 99 subscriptions per 100 people, while 36% of mobile-broadband subscriptions were already based on 5G.
BFSI remains an important end user of power distribution units because banks, payment processors, insurance companies, trading platforms, and financial institutions depend on continuously operating servers, network equipment, storage systems, and payment infrastructure. The growing volume of electronic financial transactions increases the need for stable rack-level power distribution and backup-ready electrical systems.
Federal Reserve Financial Services reported that the Fedwire Funds Service processed 217,296,700 transfers during 2025, representing annual volume growth of 3.5%. Average daily transaction volume reached 869,187 transfers. The FedNow Service also settled 8,413,402 payments during 2025. Such transaction volumes underline the importance of resilient computing and communications infrastructure in the financial sector, supporting continued use of PDUs for controlled, reliable, and continuously available electricity distribution.
Key Market Segments
By Type
- Basic PDU
- Metered PDU
- Monitored PDU
- Switched PDU
- Intelligent PDU
- Other types
By Power Phase
- Single-phase
- Three-phase
By Power Rating
- Up to 120 V
- 120–240 V
- 240–400 V
- Above 400 V
By Application
- Data centers
- Laboratories
- Commercial buildings
- Industrial facilities
- Other applications
By End User
- IT and telecommunications
- BFSI
- Healthcare
- Manufacturing
- Other end users
Driver Analysis
Hyperscale and Colocation Capacity Build-Out
Global data center equipment and infrastructure spending reached roughly USD 290 billion in a recent base year, with facility infrastructure — including electrical distribution representing about 12 percent of total data center capex and power delivery systems alone accounting for an estimated 6.5 percent share. This capex intensity is structurally reshaping vendor business models: incumbents such as Schneider Electric and Eaton are bundling PDUs with software-defined power management platforms rather than selling standalone hardware, shifting revenue mix toward recurring monitoring and predictive-maintenance service contracts.
Goldman Sachs modeling projects data center power demand reaching 84 GW by 2027, with AI workloads climbing to 27 percent share versus 23 percent for traditional workloads, meaning PDU specification standards are being rewritten mid-cycle to accommodate density profiles rising from 162 kW to 176 kW per square foot. For PDU manufacturers, this translates into longer sales cycles tied to hyperscaler master supply agreements rather than one-off colocation tenders, favoring vendors with proven multi-gigawatt deployment track records.
Drivers Impact Analysis
| Driver(~) | % Impact on CAGR Forecast | Geographic Relevance | Impact Timeline |
|---|---|---|---|
| AI-driven rack density escalation raising PDU throughput requirements | +3.8% | North America core, APAC hyperscale corridors, EU spill-over | Short term (≤2 years) |
| Hyperscale/colocation capacity build-out and capex cycle | +3.0% | North America, APAC (India, China, Southeast Asia), Middle East | Medium term (2-4 years) |
| Transition to 800 VDC / high-voltage architectures displacing legacy AC PDUs | +2.6% | North America core, EU, APAC advanced markets | Medium term (2-4 years) |
| Intelligent/metered PDU adoption for monitoring and energy compliance | +1.9% | EU core (regulatory-led), North America, APAC | Short to medium term |
| EU Energy Efficiency Directive and national reporting mandates | +1.4% | EU (Germany, France core), UK spill-over | Short term (≤2 years) |
| India and Southeast Asia data center capacity expansion | +1.7% | APAC (India, Indonesia, Malaysia) | Medium to long term (2-5 years) |
Restraint Analysis
Grid Interconnection Backlog
The most material demand restraint is the widening gap between data-center construction schedules and utility energization timelines: the average U.S. power-project interconnection cycle reached 55 months in 2024, versus 36 months in 2015 and 22 months in 2008, while some constrained markets such as Northern Virginia, Silicon Valley, and parts of PJM have moved toward seven-year delivery cycles; this creates a direct PDU-demand deferral because rack PDUs, floor PDUs, busways, transformers, UPS systems, and final distribution boards are typically procured only after a project has credible energized-load visibility.
A typical large data center can be physically constructed in 12–24 months, yet the electrical connection may require three to five years or longer, producing an unfavorable capex sequence in which owners either delay equipment releases, stage inventory at additional carrying cost, or redesign sites around smaller initial power blocks. The IEA expects global data-center electricity consumption to rise from approximately 485 TWh in 2025 to around 950 TWh by 2030, representing nearly 3% of global electricity demand; however, this demand growth does not translate one-for-one into near-term PDU shipments when utility capacity, substation space, transmission upgrades, and large-load approvals remain constrained.
For a PDU supplier, the outcome is lower conversion of announced hyperscale capacity into booked orders, increased customer demand for cancellable framework agreements rather than firm purchase orders, and margin pressure from longer project holding periods; the modeled -3.1 percentage-point CAGR effect is therefore concentrated in power-constrained North American hubs, mature EU clusters, and high-growth APAC metropolitan corridors.
Restraint Impact Analysis
| Restraint(~) | % Impact on CAGR Forecast | Geographic Relevance | Impact Timeline |
|---|---|---|---|
| Grid interconnection backlog | -3.1% | North America core, EU, APAC metros | Medium term (2-4 years) |
| Transformer and switchgear shortages | -2.4% | North America, EU, APAC corridors | Short term (≤ 2 years) |
| Copper tariffs and material inflation | -1.6% | U.S. core, North America spill-over | Short term (≤ 2 years) |
| 800 VDC transition uncertainty | -1.5% | North America, EU, advanced APAC | Medium term (2-4 years) |
| Energy reporting and product compliance | -1.1% | EU core, UK spill-over | Short term (≤ 2 years) |
| Intelligent-PDU cyber exposure | -0.8% | Global enterprise and colocation | Short term (≤ 2 years) |
Opportunity Analysis
800 VDC AI-Factory Power Platforms
NVIDIA’s hybrid 800 VDC power rack is expected to become available during the second half of 2026 for deployment within existing AC-based facilities, while its planned row power center is designed to support up to 2 MW per row from 2027; this creates a 2026–2029 qualification window for PDU manufacturers to capture value that would otherwise migrate to solid-state transformer, busway, power-shelf, and server-OEM suppliers.
In commercial terms, the opportunity is to redesign the PDU from a passive outlet-distribution device into a high-voltage, software-observable subsystem incorporating DC isolation, fault detection, hot-swap protection, liquid-cooled conductor interfaces, energy storage telemetry, and 800 VDC-to-rack conversion control; a vendor that increases average system content from a few thousand dollars per conventional rack to a bundled row-level solution serving 0.5–2 MW of IT load can materially improve revenue density per customer site.
The upside is structurally distinct from today’s AI-driven PDU demand because it relies on converting the architecture transition into proprietary platform share, including retrofit-compatible sidecars for existing facilities and native HVDC busway systems for greenfield AI campuses; successful execution could add an estimated +3.2 percentage points to long-run CAGR in North America, Europe, Japan, South Korea, and Singapore.
Opportunity Impact Analysis
| Opportunity(~) | % Potential CAGR Upside | Geographic Relevance | Execution Window |
|---|---|---|---|
| 800 VDC AI-factory power platforms | +3.2% | North America, EU, Japan, Korea, Singapore | Medium term (2-4 years) |
| PDU-as-a-Service and DCIM software | +2.4% | North America core, EU, APAC metros | Short term (≤ 2 years) |
| Edge and telecom micro-data centers | +2.0% | India, Southeast Asia, Africa, Latin America | Medium term (2-4 years) |
| Grid-interactive PDU and storage controls | +1.8% | U.S. power-constrained hubs, EU, Australia | Medium term (2-4 years) |
| Compliance-led metering retrofit programs | +1.5% | Germany, France, Nordics, UK | Short term (≤ 2 years) |
| M&A-led power-stack consolidation | +1.3% | North America, EU, APAC | Short to medium term |
Challenges Analysis
Electrical Skills Scarcity
The PDU market’s growth is increasingly limited by an execution-capacity shortage rather than a shortage of equipment demand, because high-amperage PDU installation, medium-voltage commissioning, busway integration, selective-coordination testing, and critical-facility maintenance require licensed electricians, electrical engineers, controls technicians, and commissioning specialists that cannot be scaled as quickly as data-center capital expenditure.
U.S. employers face roughly 81,000 electrician openings annually over the next decade, while industry reporting indicates that approximately 20,000 electricians retire each year and the data-center buildout competes for the same labor pool as grid modernization, renewable-energy, semiconductor, manufacturing, and housing projects; skilled-trade hiring has extended to an average 56 days, and the construction sector’s broader 2026 labor gap is estimated in the 349,000–499,000 range.
For PDU suppliers, this increases field-service rates, extends commissioning schedules by 4–12 weeks on complex deployments, raises the probability of installation defects, and limits the ability to monetize high-margin retrofit work even when products are available; the durable mitigation is to redesign portfolios for factory-integrated modular power skids, plug-and-play busway connections, preconfigured intelligent-PDU firmware, and remote commissioning, while funding contractor academies and OEM-certified installation networks.
The estimated -1.4 percentage-point CAGR drag is expected to persist beyond four years because IEA survey evidence shows around 60% of more than 400 energy companies already report difficulty hiring, with applied technical occupations among the hardest roles to fill.
Challenges Impact Analysis
| Challenge(~) | % CAGR Friction | Geographic Relevance | Mitigation Horizon |
|---|---|---|---|
| Electrical skills scarcity | -1.4% | North America core, EU, APAC hubs | Long term (≥ 4 years) |
| Long-lead component planning | -1.3% | North America, EU, APAC corridors | Medium term (2-4 years) |
| High-density power quality | -1.1% | U.S. AI hubs, EU, advanced APAC | Medium term (2-4 years) |
| HVDC standards maturation | -1.0% | North America, EU, Japan, Korea | Medium term (2-4 years) |
| Multi-vendor systems integration | -0.9% | Global hyperscale and colocation | Medium term (2-4 years) |
| Firmware and cyber lifecycle | -0.7% | Global enterprise and colocation | Long term (≥ 4 years) |
Geopolitical Impact Analysis
Geopolitical Tensions Raise Supply and Cost Risks for the Power Distribution Unit Market
Ongoing conflicts in Eastern Europe and the Middle East are increasing cost and supply risks for the Power Distribution Unit market. PDU manufacturers depend on copper, steel, circuit breakers, connectors, semiconductors, and electrical components, so disruptions in energy markets and shipping routes can affect production costs and delivery schedules.
- In 2026, attacks on tankers in the Strait of Hormuz disrupted oil movements. The U.S. Energy Information Administration reported that crude oil and petroleum-liquid flows through the strait averaged 4.9 million barrels per day in the second quarter, compared with 21.6 million barrels per day before the conflict. Brent crude reached USD 105 per barrel in July.
Copper supply adds another pressure point. The U.S. Geological Survey reported that U.S. recoverable copper mine production fell 5% in 2025 to about 1.0 million metric tons, while electrical and electronic products represented 23% of copper use. Continued war-related sanctions, rerouting, and trade uncertainty may keep input costs volatile. However, investment in resilient data centers, telecom networks, and infrastructure can support demand for intelligent and remotely managed PDUs.
Regional Insights
North America Dominates with 35.00% Share and USD 0.35 Billion Revenue
In 2025, North America held a dominant market position, capturing more than a 35.00% share and generating about USD 0.35 billion. The region benefits from a large concentration of data centers, cloud platforms, telecom networks, and AI computing infrastructure.
- In 2026, the U.S. Energy Information Administration reported that data-center servers represented an estimated 7% of commercial-sector electricity consumption in 2025. U.S. electricity demand also grew about 1.7% annually between 2020 and 2025, with data centers identified as an important growth driver.
Asia Pacific is expected to be the fastest-growing regional segment as digital infrastructure and electricity demand expand across major technology markets. The International Telecommunication Union reported that 5G covered 70% of the Asia-Pacific population in 2025, while the region recorded 101 mobile-broadband subscriptions per 100 inhabitants.
The IEA expects China’s data-center electricity consumption to rise by around 175 TWh, or 170%, from 2024 to 2030. It also expects data-center electricity demand in Southeast Asia to more than double by 2030. These trends support stronger PDU demand across hyperscale data centers, telecom facilities, edge sites, and enterprise computing environments throughout the region over the coming years.
Key Regions and Countries Insights
- North America
- US
- Canada
- Europe
- Germany
- France
- The UK
- Spain
- Italy
- Rest of Europe
- Asia Pacific
- China
- Japan
- South Korea
- India
- Australia
- Rest of APAC
- Latin America
- Brazil
- Mexico
- Rest of Latin America
- Middle East & Africa
- GCC
- South Africa
- Rest of MEA
Key Players Analysis
Schneider Electric SE remains a major Power Distribution Unit supplier through its data-center power management portfolio, including rack-level distribution and intelligent monitoring solutions. In 2025, the company generated €40.15 billion in revenue, up 8.9% organically. Energy Management revenue increased 10% organically, while North America grew 15%. Adjusted EBITA reached €7.52 billion with an 18.7% margin.
Vertiv Group Corporation has a strong position in the Power Distribution Unit market through rack PDUs and broader critical digital infrastructure solutions for data centers and communication networks. In 2025, Vertiv generated record net sales of USD 10.2 billion, increasing 28% year over year. Operating profit reached USD 1.8 billion, while adjusted operating profit rose to USD 2.1 billion.
Eaton Corporation plc is an important Power Distribution Unit supplier within the broader intelligent power management industry, serving data centers, commercial buildings, industrial facilities, and digital infrastructure. In 2025, Eaton reported record sales of USD 27.4 billion, increasing 10% from 2024, including 8% organic growth. Segment margins reached a record 24.5%. Operating cash flow totaled USD 4.5 billion, while free cash flow reached USD 3.6 billion.
Top Key Players Outlook
- Schneider Electric SE
- Vertiv Group Corporation
- Eaton Corporation plc
- Legrand SA
- ABB Ltd.
- nVent Electric plc
- Rittal GmbH & Co. KG
- Delta Electronics, Inc.
- Cyber Power Systems, Inc.
- ATEN International Co., Ltd.
- Panduit Corporation
- Siemens AG
- Huawei Technologies Co., Ltd.
- Leviton Manufacturing Co., Inc.
- Chatsworth Products, Inc.
Recent Developments
- In May 2026, ABB announced a further USD 200 million investment in European medium-voltage manufacturing, expected to increase selected production capacity by 50%–300% and create about 800 jobs. In July 2026, ABB agreed to acquire Advantics, whose silicon-carbide power converters achieve up to 99% efficiency, strengthening ABB’s DC power-distribution offering for data centers.
- In January 2025, Delta acquired the power-inductor and powder-material business of Alps Alpine and Alps Electric Korea for approximately USD 68.5 million, including production equipment, R&D assets, patents, and intellectual property; the transaction supports power components used in data centers and AI computing equipment.
- Rittal currently employs about 9,800 people, operates 60 subsidiaries and 10 production sites, while its parent Friedhelm Loh Group generated EUR 3.2 billion in turnover in 2025.
Report Scope
| Report Features | Description |
|---|---|
| Market Value (2025) | USD 4.9 Bn |
| Forecast Revenue (2035) | USD 15.6 Bn |
| CAGR (2026-2035) | 12.2% |
| Base Year for Estimation | 2025 |
| Historic Period | 2020-2024 |
| Forecast Period | 2026-2035 |
| Report Coverage | Revenue Forecast, Market Dynamics, Competitive Landscape, Recent Developments |
| Segments Covered | By Type (Basic PDU, Metered PDU, Monitored PDU, Switched PDU, Intelligent PDU, Other types), By Power Phase (Single-phase, Three-phase), By Power Rating (Up to 120 V, 120–240 V, 240–400 V, Above 400 V), By Application (Data centers, Laboratories, Commercial buildings, Industrial facilities, Other applications), By End User (IT and telecommunications, BFSI, Healthcare, Manufacturing, Other end users) |
| Regional Analysis | North America – US, Canada; Europe – Germany, France, The UK, Spain, Italy, Rest of Europe; Asia Pacific – China, Japan, South Korea, India, Australia, Singapore, Rest of APAC; Latin America – Brazil, Mexico, Rest of Latin America; Middle East & Africa – GCC, South Africa, Rest of MEA |
| Competitive Landscape | Schneider Electric SE, Vertiv Group Corporation, Eaton Corporation plc, Legrand SA, ABB Ltd., nVent Electric plc, Rittal GmbH & Co. KG, Delta Electronics, Inc., Cyber Power Systems, Inc., ATEN International Co., Ltd., Panduit Corporation, Siemens AG, Huawei Technologies Co., Ltd., Leviton Manufacturing Co., Inc., Chatsworth Products, Inc. |
| Customization Scope | Customization for segments, region/country-level will be provided. Moreover, additional customization can be done based on the requirements. |
| Purchase Options | We have three licenses to opt for: Single User License, Multi-User License (Up to 5 Users), Corporate Use License (Unlimited User and Printable PDF) |





































