


Report Overview
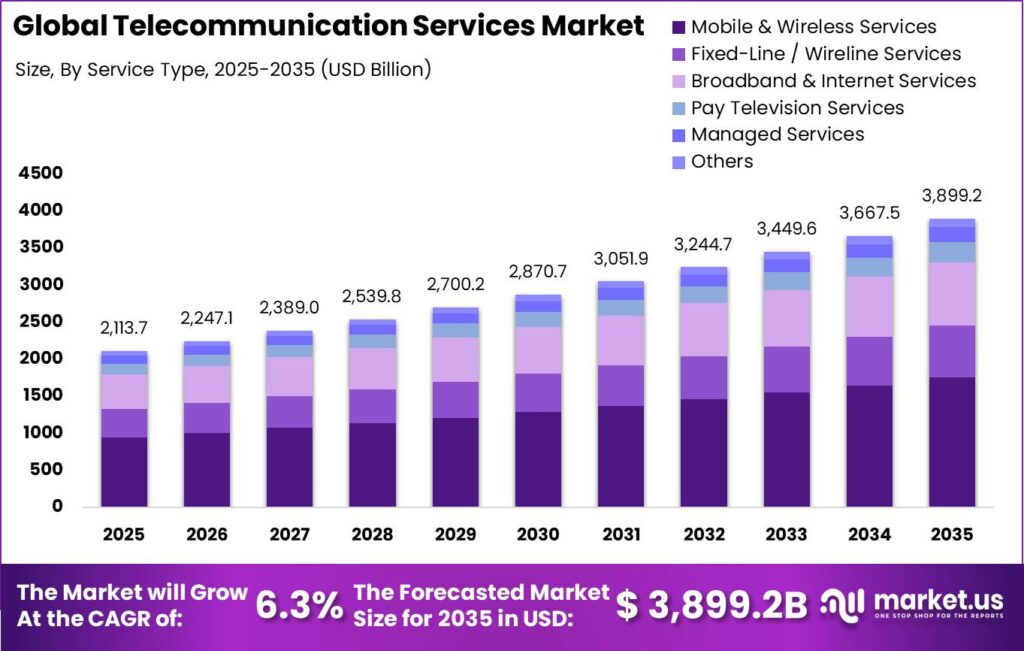
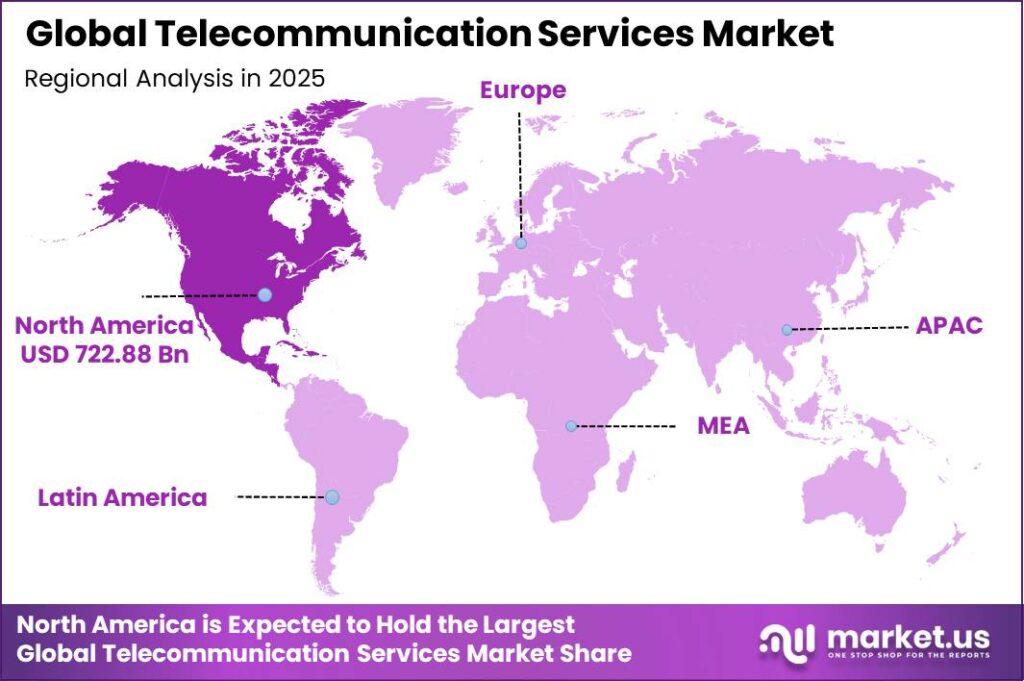
In 2025, the Global Telecommunication Services Market was valued at USD 2,113.7 billion and is projected to reach approximately USD 3,899.2 billion by 2035, growing at a CAGR of 6.3% during 2026-2035. North America held the largest market share in 2025, accounting for more than 34.2% of global revenue, equivalent to approximately USD 722.88 billion.
Market growth is supported by the rapid expansion of digital connectivity worldwide. According to the International Telecommunication Union (ITU), around 6 billion people, representing 74% of the global population, were using the internet in 2025, compared with 5.8 billion in 2024, adding nearly 240 million new users in one year.
5G networks covered around 55-60% of the global population, while 4G coverage reached 93%, making high-speed mobile broadband widely accessible. As internet users and mobile broadband subscriptions continue to increase, demand for data-intensive services such as video streaming, cloud applications, and enterprise communications is rising, supporting higher subscription revenues and contributing to the market’s expected increase of nearly USD 1,785.5 billion between 2025 and 2035.
North America maintained its market leadership due to its advanced telecom infrastructure and strong adoption of next-generation networks. According to the Ericsson Mobility Report, 79% of mobile subscriptions in North America were on 5G networks in 2025, the highest penetration globally, compared with 61% in North-East Asia. Higher adoption of premium 5G plans is increasing demand for high-value services, including ultra-HD video, cloud gaming, IoT connectivity, and enterprise communication solutions.
In addition, internet penetration across the Americas exceeded 88-90% of the population, reflecting a highly connected digital economy. Continued investments in 5G expansion, fiber networks, connected devices, and digital services are expected to sustain long-term demand, supporting the global telecommunication services market’s growth toward USD 3.9 trillion by 2035.
Key Takeaway
- The Global Telecommunication Services Market was valued at USD 2,113.7 billion in 2025 and is projected to reach USD 3,899.2 billion by 2035, growing at a CAGR of 6.3% during 2026-2035.
- By Service Type, Mobile & Wireless Services held the largest market share at 45.0% in 2025.
- By End User, the Consumer/Residential segment led the market with a 60.0% share in 2025.
- By Deployment Mode, On-Premise solutions accounted for the largest share at 52.0% in 2025.
- By Package/Bundle Type, Double/Triple Play bundles dominated the market with a 62.0% share in 2025.
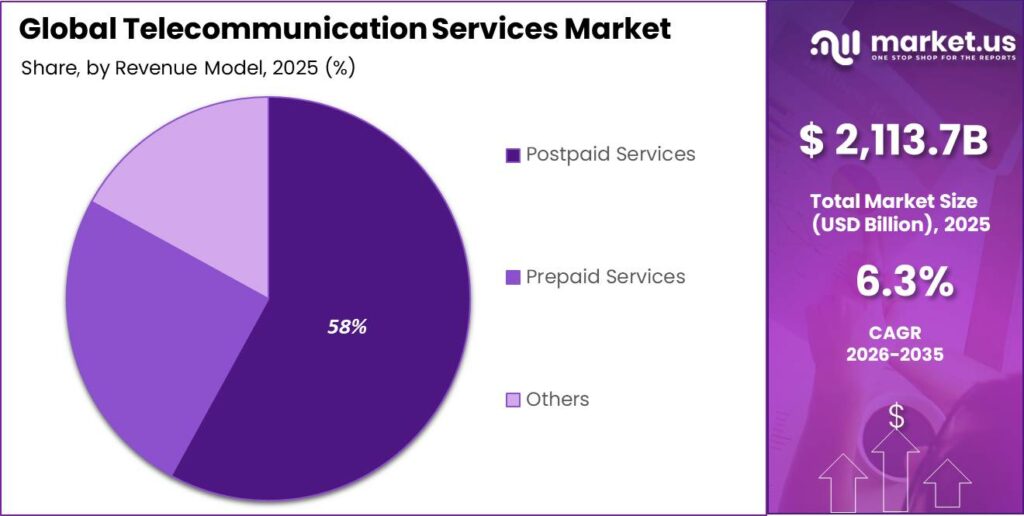
- By Revenue Model, Postpaid Services emerged as the leading segment, capturing 58.0% of the global market in 2025.
- North America dominated the global market with a 34.2% share, accounting for approximately USD 722.9 billion in 2025.
Service Type
The Mobile & Wireless Services segment accounted for the largest 45.0% share of the global telecommunication services market in 2025, driven by the widespread adoption of smartphones and mobile broadband as the primary means of communication and internet access.
According to the International Telecommunication Union (ITU), global mobile-cellular subscriptions reached approximately 9.1 billion in 2024, equivalent to around 112 subscriptions per 100 inhabitants, reflecting extensive multi-SIM usage and strong dependence on mobile connectivity.
Data from the World Bank also shows that mobile subscription density exceeds 100 subscriptions per 100 people across many economies, while fixed-line telephone penetration has steadily declined over the past two decades, shifting voice and messaging traffic toward wireless networks. The Ericsson Mobility Report projects global mobile data traffic to increase from approximately 146 exabytes per month in 2025 to 328 exabytes per month by 2031, with 5G expected to carry the majority of total mobile traffic.
By End User
The Consumer/Residential segment accounted for the largest 60.0% share of the global telecommunication services market, driven by its extensive subscriber base and high demand for mobile and broadband connectivity. According to the International Telecommunication Union (ITU), over 57% of households worldwide have internet access at home, while more than 75% of the global population uses mobile broadband services.
The ITU also reports approximately 112 mobile-cellular subscriptions and 95 mobile broadband subscriptions per 100 inhabitants, reflecting widespread personal device ownership, multi-SIM usage, and family mobile plans. Consumer households typically subscribe to multiple recurring services, including mobile voice, mobile data, fixed broadband, streaming, and digital communication platforms, creating a stable revenue base for telecom operators.
By Deployment Mode
On-premise deployment represents about 52% of global telecommunication services by deployment mode, and this dominance is reinforced by the sheer scale of privately operated facilities and equipment that remain inside enterprise and government walls.
As of late 2025, more than 12,000 operational data centers exist worldwide, with approximately 5,427 located in the United States and nearly 5,800 across North America, supporting corporate, public-sector, and critical-infrastructure workloads on privately managed networks and voice systems.
More recent estimates for 2026 indicate around 11,426 active data centers globally, with the United States alone hosting 4,280 facilities, highlighting how much processing and communication capacity is still concentrated in on-premise environments rather than fully cloud-native deployments.
These data centers collectively account for over 120 gigawatts of installed IT power capacity as of early 2025, with projections suggesting total capacity could approach 200-220 gigawatts by 2030 as organizations invest nearly USD 7 trillion in building and upgrading data centers.
By Package/Bundle Type
The Double/Triple Play deployment segment accounts for approximately 62.0% share of the global telecommunication services market by package/bundle type, driven by the widespread adoption of integrated voice, broadband, and video service offerings across residential, enterprise, and public-sector markets.
This dominance is supported by the continued expansion of fixed broadband infrastructure, with ITU data showing global fixed-broadband subscriptions reaching approximately 20.1 per 100 people in 2025, creating a strong installed base for operators to add telephony and television services.
Eurostat broadband pricing frameworks track multi-service packages combining ≥200 Mbps fixed internet with fixed telephony and TV, indicating that converged bundles have become a standard market offering across European countries.
By Revenue Model
The Postpaid Services segment accounts for around 58.0% share of the global telecommunication services market by revenue model, driven by the strong preference of enterprises, governments, and regulated sectors for contracted connectivity solutions that provide predictable performance, security, and long-term service commitments.
Across OECD economies, fiber represented 42% of fixed broadband lines and 5G accounted for approximately 28% of mobile broadband subscriptions, highlighting the rapid expansion of high-capacity networks that are typically accessed through multi-year postpaid agreements.
These contracts enable organizations to secure latency-sensitive connectivity, guaranteed quality of service (QoS), managed security, and compliance support over long infrastructure lifecycles. In the United States, FCC data for June 2024 reported approximately 65 million interconnected VoIP subscriptions and 388 million mobile subscriptions, with a significant portion of business and government connectivity delivered through postpaid plans.
Key Market Segments
By Service Type
- Mobile & Wireless Services
- Voice services
- Mobile data & internet services
- SMS & messaging services
- 5G services
- 4G / LTE services
- Fixed-Line / Wireline Services
- Public switched telephone network (PSTN)
- Fixed broadband services
- Leased line services
- Broadband & Internet Services
- Fiber-to-the-Home (FTTH)
- Digital Subscriber Line (DSL)
- Cable broadband
- Others
- Pay Television Services
- Cable TV
- Satellite TV
- IPTV
- Managed Services
- Managed network services
- Managed security services
- Cloud-managed services
- Others
By End User
- Consumer / Residential
- Business / Commercial
By Deployment Mode
- On-Premise
- Cloud-Based
- Hybrid
By Package/Bundle Type
- Double/Triple Play
- Quad Play
By Revenue Model
- Postpaid Services
- Prepaid Services
- Others
Market Dynamics
Drivers
| Driver | (~) % Impact on CAGR | Geographic Relevance | Impact Timeline |
|---|---|---|---|
| 5G Network Commercialization & Standalone Deployment | +1.8% | Global, led by North America, East Asia, GCC, Nordic markets; rapid expansion in South & Southeast Asia | Short term (≤ 2 years) |
| Broadband & Fiber Infrastructure Expansion | +1.2% | Global, especially India, Sub-Saharan Africa, Latin America, Southeast Asia | Short term (≤ 2 years) |
| Enterprise & IoT Connectivity Demand Surge | +1.0% | Global, North America, Europe, China lead; emerging growth across South Asia & ASEAN | Medium term (2-4 years) |
| AI-Driven Network Automation & Cost Optimization | +0.8% | Global, highest adoption density in North America, Western Europe, Japan, South Korea | Medium term (2-4 years) |
| Regulatory Liberalization & Spectrum Re-Farming | +0.6% | Regional, India, EU, Middle East, parts of Latin America | Short term (≤ 2 years) |
| Fixed-Mobile Convergence & Bundled Service Monetization | +0.5% | Global, most pronounced in Western Europe, North America, East Asia | Medium term (2-4 years) |
5G Network Commercialization & Standalone Deployment
The transition from non-standalone (NSA) to standalone (SA) 5G architecture is the single most structurally transformative force currently operating within telecom market economics. As of early 2026, approximately 55-60% of the world’s population has access to 5G networks, with high-income markets exceeding 80% population coverage, while India, which deployed over 5.08 lakh 5G base transceiver stations by end-2025 and achieved coverage in 99.9% of its districts, exemplifies the speed at which mid-income markets are closing the gap.
The root-cause mechanism is a direct business model shift: SA 5G unlocks network slicing, ultra-reliable low-latency communications (URLLC), and massive machine-type communication (mMTC) capabilities that NSA architectures cannot monetize, enabling operators to move from flat per-GB pricing toward SLA-tiered enterprise connectivity contracts with meaningfully higher average revenue per user (ARPU).
Simultaneously, India’s TRAI issued comprehensive spectrum auction recommendations in February 2026 covering nine frequency bands, 600 MHz through 26 GHz, with a proposed reserve value of approximately ₹2.1 trillion (~$23.1 billion), which, when absorbed into operator balance sheets through 20-year licenses, anchors long-term CapEx commitments and provides regulatory certainty that accelerates new service launches.
The commercial impact extends beyond connectivity: operators that have deployed SA 5G report preliminary evidence of material reductions in energy consumption, up to 33% daily power reduction at 5G sites using AI/ML network sleep modes, which directly compresses operational expenditure and partially offsets high infrastructure amortization costs, improving incremental EBITDA margins on the upgraded footprint.
Restraints
| Restraint | (~) % Impact on CAGR | Geographic Relevance | Impact Timeline |
|---|---|---|---|
| High Spectrum Acquisition & CapEx Debt Burden | -1.3% | Global, most acute for mid-sized operators in Europe, India, Latin America; significant in the US for speculative-grade carriers | Short term (≤ 2 years) |
| OTT Bypass & Voice/SMS Revenue Erosion | -0.9% | Global, particularly severe in Western Europe, South & Southeast Asia where OTT penetration is highest | Short term (≤ 2 years) |
| Geopolitical Equipment Bans & Vendor Rip-and-Replace Mandates | -0.7% | Regional, EU, USA, UK, Australia; ripple effects on global supply chain pricing | Short term (≤ 2 years) |
| Compressing ARPU Amid Price Competition | -0.6% | Global, most pronounced in hyper-competitive markets: India, Western Europe, Southeast Asia | Short term (≤ 2 years) |
| Regulatory Revenue-Sharing & Licensing Fee Obligations | -0.4% | Regional, South Asia, Sub-Saharan Africa, parts of Latin America | Medium term (2-4 years) |
High Spectrum Acquisition & CapEx Debt Burden
The structural conflict between the scale of infrastructure investment required for next-generation network deployment and operators’ pre-existing leverage ratios represents the most acute near-term brake on incremental market growth.
In the US, aggregate speculative-grade telecom and cable debt maturities were estimated at approximately $6.5 billion in 2024, scaling to $14.9 billion in subsequent near-term periods, all refinancing into a higher-for-longer interest rate environment that directly inflates the cost of capital for network modernization programs. Major operators such as AT&T have guided CapEx envelopes of $23-24 billion annually in 2026 and 2027, up from ~$22-22.5 billion in 2025, even as EBITDA margins face simultaneous pressure from ARPU compression and rising energy costs.
In India, the TRAI’s proposed spectrum auction with a reserve value of approximately $23.1 billion across nine frequency bands, structured as 20-year licenses, with the 600 MHz band extended to 24 years, commits Indian operators to significant upfront or amortized outlays precisely when they are still digesting 5G rollout debt from the 2022-2024 cycles.
Challenges
| Challenge | (~) % CAGR | Geographic Relevance | Mitigation Horizon |
|---|---|---|---|
| Telecom-Specific Talent Deficit | -0.9% | Global, most acute in North America, Western Europe, India; emerging gap in Middle East & Africa | Long term (≥ 4 years) |
| Escalating Cybersecurity Attack Surface | -0.7% | Global, elevated threat concentration in North America, Europe, East Asia; growing exposure across emerging markets | Medium term (2-4 years) |
| Network Energy & Sustainability Cost Pressure | -0.6% | Global, most material in markets with carbon taxation or mandatory ESG disclosure (EU, UK, Japan, Australia) | Long term (≥ 4 years) |
| Revenue Leakage & Billing Integrity | -0.5% | Global, highest absolute impact in large CSP markets: USA, China, India, Brazil, Germany | Medium term (2-4 years) |
| OSS/BSS Legacy System Modernization | -0.4% | Global, most severe drag in incumbent carriers in Europe, Latin America, South Asia operating multi-decade IT stacks | Long term (≥ 4 years) |
Telecom-Specific Talent Deficit
The telecommunications sector is confronting a structural skills crisis that compounds every other operational challenge it faces: as many as 86% of telecom company executives have identified skilled worker availability as the primary challenge facing the industry, while 40% simultaneously flag network quality and reliability, a metric directly downstream of workforce competency, as the sector’s second-largest operational vulnerability.
The quantitative friction is not merely a hiring bottleneck but a compounding operational cost: organizations that fail to close AI talent gaps specifically face missed automation-driven OpEx savings; industry evidence from Vodafone UK and Ericsson shows AI/ML-enabled deep sleep modes delivering up to 33% daily power reduction and up to 70% savings during off-peak hours, while L3-to-L4 network automation transitions yield total cost-of-operations reductions of 25-50%, savings that are entirely contingent on deploying talent capable of building, validating, and governing these systems.
Opportunities
| Opportunity | (~) % Potential CAGR Upside | Geographic Relevance | Execution Window |
|---|---|---|---|
| Private 5G Network-as-a-Service for Enterprises | +1.6% | Global, North America, Germany, Japan, South Korea lead; strong pipeline in India, Middle East, Southeast Asia | Short term (≤ 2 years) |
| Techco Pivot: Cloud, Cybersecurity & Managed IT Services | +1.2% | Global, North America, Western Europe, GCC as primary execution markets; emerging demand across South Asia | Medium term (2-4 years) |
| Rural & Underserved Market Broadband Monetization | +0.9% | Regional, India, Sub-Saharan Africa, Latin America, Southeast Asia; significant under-penetration relative to urban markets | Medium term (2-4 years) |
| Network API Monetization & Developer Ecosystem | +0.8% | Global, initial value capture in North America, Western Europe, East Asia; platform-level play with global scalability | Medium term (2-4 years) |
| Satellite-Terrestrial Hybrid Connectivity Integration | +0.6% | Global, high-priority in geographically challenging markets: Africa, South Asia, Latin America, Arctic corridors | Long term (≥ 4 years) |
| Green Network Infrastructure & Carbon Credit Monetization | +0.4% | Regional, EU, UK, Japan, Australia where carbon pricing and ESG-linked financing are most mature | Long term (≥ 4 years) |
Private 5G Network-as-a-Service for Enterprises
Private 5G networks represent the most immediately executable white-space opportunity in the telecommunications market because the underlying demand, deterministic low-latency connectivity for industrial automation, warehouse robotics, smart manufacturing, and campus-scale security systems, is structurally unmet by shared public network architectures, yet the supply-side infrastructure (licensed mid-band spectrum, SA 5G core software, edge compute platforms) has only recently reached the commercial maturity threshold required for scalable enterprise deployment.
The unit-economics shift that makes this opportunity transformative is the move from per-subscriber connectivity pricing (typically $5-15/month per consumer SIM) to per-site or per-use-case enterprise contracts structured as multi-year, SLA-backed managed service agreements, a model that can generate ARPU multiples of 10x-50x versus consumer equivalents while delivering EBITDA margins in the 35-45% range for operators that bundle spectrum, hardware, managed operations, and service assurance.
Geopolitical Impact Analysis
Geopolitical tensions are increasing costs and slowing infrastructure deployment across the global telecommunication services market. According to the World Trade Organization (WTO), trade covered by new or increased tariffs in G20 economies rose around fourfold between mid-October 2024 and mid-October 2025 compared with the previous year.
In addition, U.S. Section 301 measures continue to impose 7.5-25% tariffs on approximately USD 360 billion of Chinese imports, including telecommunications equipment, increasing procurement costs for optical fiber, base stations, routers, and semiconductors.
Simultaneously, disruptions across the Red Sea, Suez Canal, Panama Canal, and Black Sea have significantly affected global supply chains. UNCTAD reports that container ship transits through both the Suez and Panama Canals declined by more than 40% from peak levels, while Suez container tonnage fell by 82% by early 2024.
Since the Suez Canal handles around 10% of global maritime trade and 22% of global containerized trade, rerouting shipments has increased transit distances by thousands of nautical miles and raised freight rates by 15-20% on major routes. Energy costs further pressure telecom operators, as the European Commission JRC estimates EU telecom networks consumed 150-190 TWh of electricity in 2022, representing 6-7% of total EU electricity consumption, while the IEA reported European wholesale electricity prices were more than double 2021 levels during 2022.
Regional Analysis
North America dominated the global telecommunication services market in 2025, accounting for 34.20% of total revenue, valued at approximately USD 722.88 billion. The region’s leadership is supported by advanced digital infrastructure, widespread 5G adoption, and high spending on communication services. According to the GSMA, North America recorded one of the world’s highest 5G population coverage levels at over 90% in 2024, enabling widespread use of high-speed mobile broadband and enterprise connectivity solutions.
The U.S. Federal Communications Commission (FCC) reports that its Broadband Equity, Access, and Deployment (BEAD) Program allocates USD 42.45 billion to expand high-speed broadband infrastructure across the United States, strengthening fixed and wireless connectivity. Large-scale investments by operators such as AT&T, Verizon, and T-Mobile in fiber networks, edge computing, private wireless networks, and IoT services continue to drive revenue growth across consumer and enterprise markets.
Asia Pacific is projected to register the fastest growth during the forecast period, driven by rapid digital transformation, expanding broadband infrastructure, and the world’s largest mobile subscriber base. According to the GSMA, the Asia Pacific region is expected to have more than 400 million 5G connections by 2025, while China alone had deployed over 4.39 million 5G base stations by early 2025, according to China’s Ministry of Industry and Information Technology (MIIT).
Key Regions and Countries
North America
- US
- Canada
Europe
- Germany
- France
- The UK
- Spain
- Italy
- Rest of Europe
Asia Pacific
- China
- Japan
- South Korea
- India
- Australia
- Rest of APAC
Latin America
- Brazil
- Mexico
- Rest of Latin America
Middle East & Africa
- GCC
- South Africa
- Rest of MEA
Key Players Analysis
The global telecommunication services market is moderately consolidated, with Tier-1 operators collectively accounting for an estimated 45-55% of global market revenue. This group is led by China Mobile, Verizon, and AT&T, each generating more than USD 120 billion in annual revenue while investing heavily in 5G, fiber broadband, cloud infrastructure, and enterprise connectivity.
Tier-2 operators, including regional incumbents and converged telecom providers across Europe and Asia, generally generate USD 15-50 billion in annual revenue and focus on fiber expansion, digital services, and selective acquisitions to strengthen regional market positions.
China Mobile remains the world’s largest telecom operator, reporting RMB 1,050.2 billion in operating revenue and RMB 895.5 billion in principal telecommunications business revenue in 2025, representing 0.9% year-on-year growth. AT&T reported USD 125.6 billion in revenue in 2025, an increase of 2.7% from 2024, while Verizon generated approximately USD 134.8 billion in revenue in 2024, including USD 102.9 billion from its Consumer segment and USD 29.5 billion from its Business segment.
Together, these three companies account for an estimated 12-15% of global telecom service revenue. Regionally, the United States generated approximately USD 332.4 billion in telecom service revenue in 2023, while China contributed around USD 232.95 billion, highlighting the concentration of leading telecom operators in North America and China, with Asia-Pacific representing approximately 40-42% of the global market.
Top Key Players in the Market
- China Mobile Limited
- Verizon Communications Inc.
- Deutsche Telekom AG
- AT&T Inc.
- Comcast Corporation
- NTT Group (Nippon Telegraph & Telephone)
- China Telecom Corporation
- Vodafone Group PLC
- T-Mobile US Inc.
- América Móvil S.A.B. de C.V.
- China Unicom (Hong Kong) Ltd.
- SoftBank Corp.
- Orange S.A.
- Telefónica S.A.
- Bharti Airtel Limited
Recent Developments
- In April 2026, Deutsche Telekom AG explored a full merger with T-Mobile US, creating a potential telecom group with an implied equity value exceeding USD 200 billion, strengthening its global 5G and fiber leadership.
- In March 2026, Telefónica S.A. launched its 2030 strategy, committing low-to-mid single-digit billions of euros in annual capex to accelerate fiber and 5G deployment across Europe and Brazil while advancing its digital transformation goals.
Report Scope
| Report Features | Description |
|---|---|
| Market Value (2025) | USD 2,113.7 Billion |
| Forecast Revenue (2035) | USD 3,899.2 Billion |
| CAGR (2026-2035) | 6.3% |
| Base Year for Estimation | 2025 |
| Historic Period | 2020-2024 |
| Forecast Period | 2026-2035 |
| Report Coverage | Revenue Forecast, Market Dynamics, Competitive Landscape, Recent Developments |
| Segments Covered | By Service Type (Mobile & Wireless Services, Fixed-Line, Broadband & Internet Services, Pay Television Services, Managed Services), By End User (Consumer / Residential, Business), By Deployment Mode (On-Premise, Cloud-Based, Hybrid), By Package/Bundle Type (Double/Triple Play, Quad Play), By Revenue Model (Postpaid Services, Prepaid Services, Others) |
| Regional Analysis | North America – US, Canada; Europe – Germany, France, The UK, Spain, Italy, Rest of Europe; Asia Pacific – China, Japan, South Korea, India, Australia, Singapore, Rest of APAC; Latin America – Brazil, Mexico, Rest of Latin America; Middle East & Africa – GCC, South Africa, Rest of MEA |
| Competitive Landscape | China Mobile Limited, Verizon Communications Inc., Deutsche Telekom AG, AT&T Inc., Comcast Corporation, NTT Group (Nippon Telegraph & Telephone), China Telecom Corporation, Vodafone Group PLC, T-Mobile US Inc., América Móvil S.A.B. de C.V., China Unicom (Hong Kong) Ltd., SoftBank Corp., Orange S.A., Telefónica S.A., Bharti Airtel Limited |
| Customization Scope | Customization for segments and region/country-level will be provided. Moreover, additional customization can be done based on the requirements. |
| Purchase Options | We have three licenses to opt for: Single User License, Multi-User License (Up to 5 Users), Corporate Use License (Unlimited Users and Printable PDF) |





























