


Report Overview
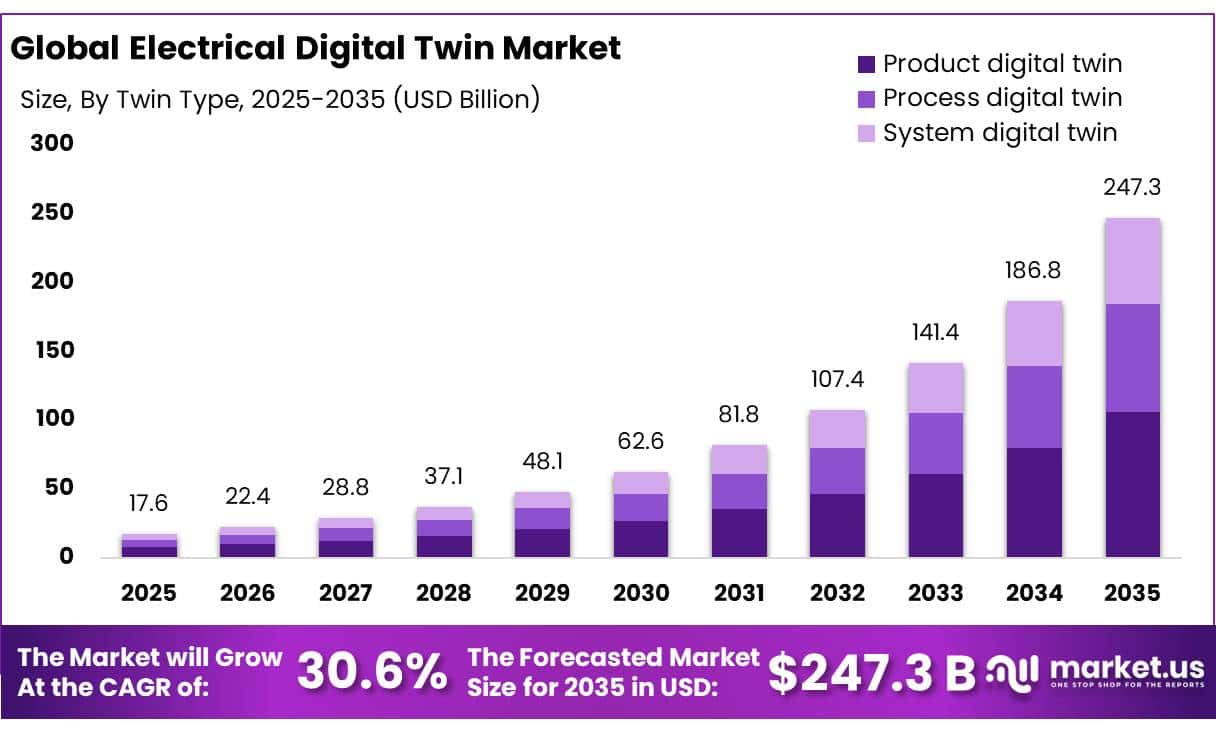
The Global Electrical Digital Twin Market size is expected to be worth around USD 247.3 Billion by 2035, from USD 17.6 Billion in 2025, growing at a CAGR of 30.6% during the forecast period from 2026 to 2035. In 2025, North America held a dominant market position, capturing more than a 34.2% share, holding USD 0.68 Billion revenue.
The Electrical Digital Twin industry is developing as a key part of modern power-system digitalization. An electrical digital twin creates a continuously updated virtual representation of electrical assets such as transformers, substations, switchgear, motors, transmission networks, and industrial power systems. It combines operational data, sensors, simulation, cloud computing, and AI to study asset behaviour before physical changes are made.
- The industrial need is strengthening as global electricity demand increased by 3% in 2025 IEA Source. Global electricity consumption stood at approximately 28,200 TWh in 2025 IEA Source and is projected to reach 33,600 TWh by 2030 IEA Source.
Key Takeaways
- Electrical Digital Twin Market size is expected to be worth around USD 247.3 Billion by 2035, from USD 17.6 Billion in 2025, growing at a CAGR of 30.6%.
- Product digital twin held a dominant market position, capturing more than a 42.9% share.
- Digital Grid held a dominant market position, capturing more than a 36.00% share.
- Cloud-based held a dominant market position, capturing more than a 61.00% share.
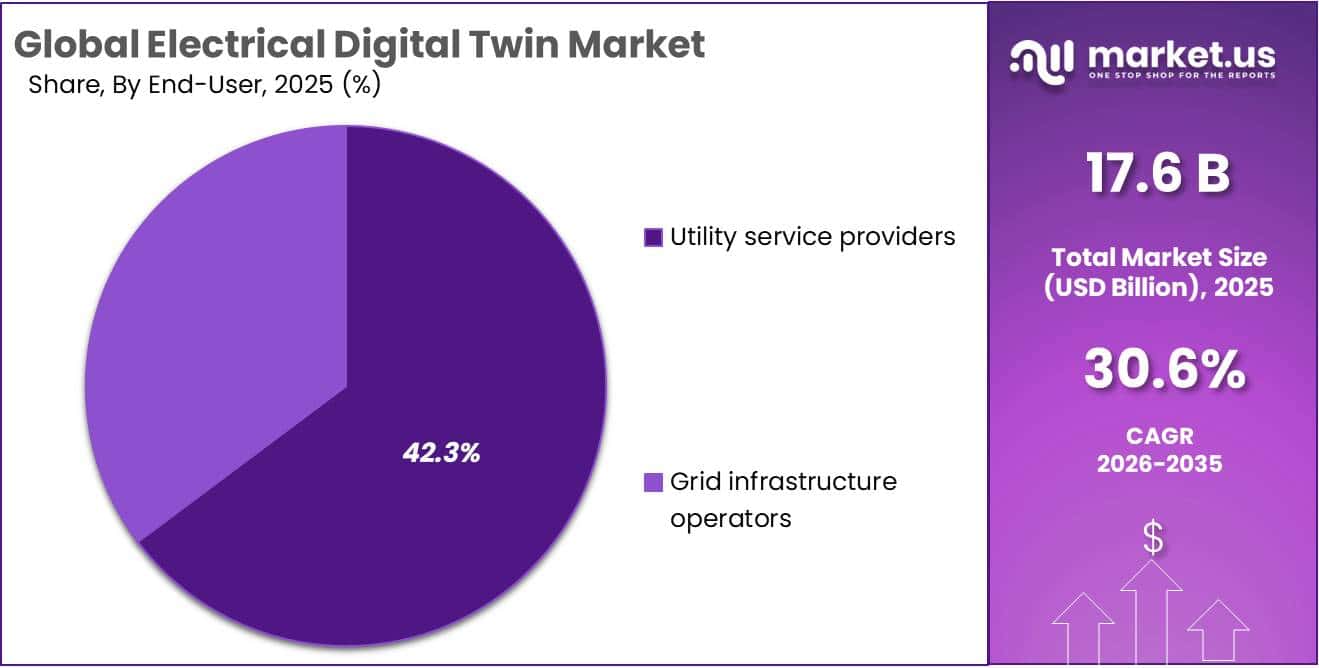
- Utility service providers held a dominant market position, capturing more than a 64.00% share.
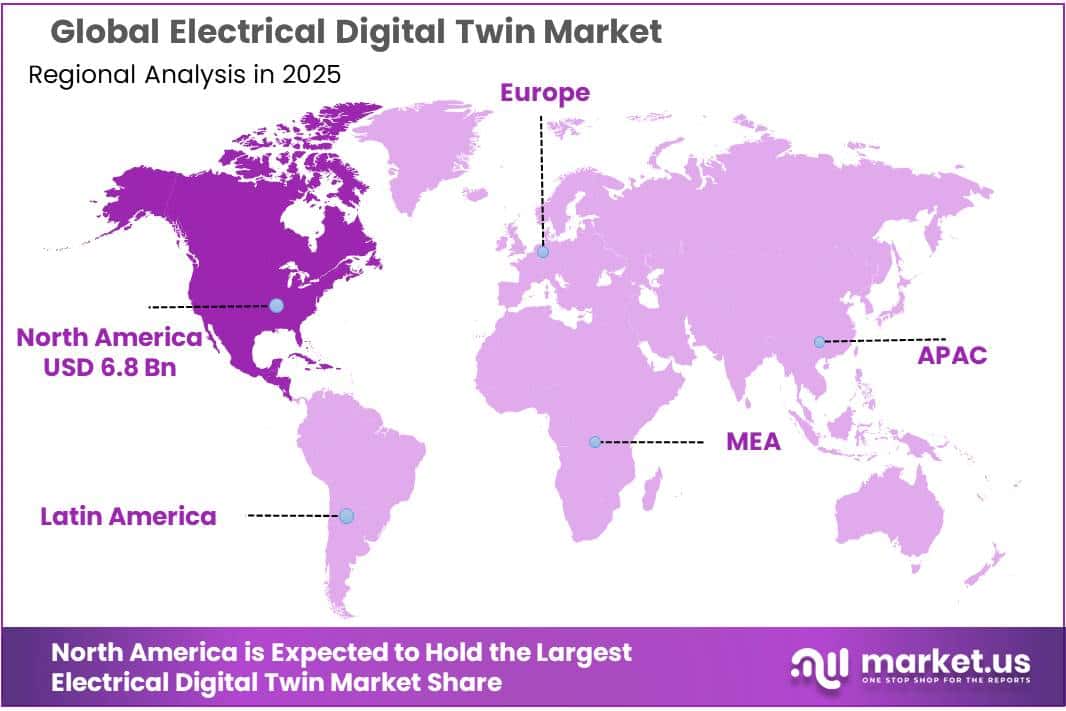
- North America held the dominant position in the Electrical Digital Twin Market, capturing more than a 34.20% share and generating USD 0.68 billion.
The industrial scenario is also being shaped by ageing electricity infrastructure and rapid renewable-energy connections. The European Commission estimates that around €584 billion of electricity-grid investment is required through 2030 European Commission Source. About 40% of European distribution grids are already more than 40 years old European Commission Source. At the same time, European wind and solar capacity is expected to increase from around 400 GW to at least 1,000 GW by 2030 European Commission Source. These changes increase the value of digital twins for network planning, congestion analysis, renewable integration, and equipment-loading simulations.
Energy-intensive chemical manufacturing represents another practical application area. BASF reported total energy consumption of 74.3 million MWh in 2025 BASF Source, while its total renewable-energy consumption reached approximately 5.2 million MWh BASF Source. Cefic reports that the European chemical industry has reduced specific energy consumption by about 40% since 1990 Cefic Source. Electrical digital twins can support further efficiency gains by modelling motors, electrical distribution, power quality, renewable supply, and plant-load behaviour before operational decisions are implemented.
- Government-backed programs are creating a stronger foundation for adoption. Europe’s TwinEU project has a total budget of €25.2 million European Commission Source, including €20 million of EU funding European Commission Source.
- In the United States, the Department of Energy is administering the $10.5 billion Grid Resilience and Innovation Partnerships program to strengthen grid flexibility, modernization, and resilience U.S. Department of Energy Source.
Future growth opportunities are expected to move beyond visualization toward AI-assisted operational decision-making. The European Commission indicates that innovative digital grid technologies could increase existing network capacity by up to 40% European Commission Source while reducing conventional grid-expansion costs by as much as 35% European Commission Source. Its 2026–2027 work programme also allocates around €90 million to advanced electricity-grid solutions European Commission Source.
By Twin Type Analysis
Product digital twin leads the Electrical Digital Twin Market with more than 42.9% share
In 2025, “Product digital twin” held a dominant market position, capturing more than a 42.9% share. Product digital twins are widely used to create virtual models of electrical equipment such as transformers, switchgear, motors, generators, batteries, and other grid assets. Their strong position is supported by the growing need for asset monitoring, fault detection, performance testing, and predictive maintenance without interrupting physical equipment.
- In 2025, the U.S. Department of Energy launched Round 3 of its Digitizing Utilities Prize with a $2.5 million total prize pool to advance digital systems, sensors, data analytics, and grid-resource integration. The program also included a $100,000 bonus for solutions addressing extreme-event applications, showing increased government support for digital tools that help utilities understand and manage individual grid assets more effectively.
Process digital twin is becoming an important twin type in the Electrical Digital Twin Market because it models how complete electrical processes operate rather than focusing only on individual equipment. It supports utilities and industrial operators in studying power flow, renewable integration, grid balancing, operating conditions, and system responses before making changes to the physical network.
In 2026, the European Commission’s TwinEU program continued the development of a federated digital twin ecosystem for Europe’s electricity system with a total project cost of €25.22 million, including approximately €20.00 million in EU funding. The project uses real-time data exchange, AI models, physics-based simulations, and high-performance computing to support transmission, distribution, and electricity-market operations, highlighting the growing role of process-level digital twins in managing complex electrical systems.
By Product Analysis
Digital Grid dominates the Electrical Digital Twin Market with more than 36.00% share
In 2025, “Digital Grid” held a dominant market position, capturing more than a 36.00% share. Digital grids are increasingly adopting digital twins to model power flows, monitor network assets, identify congestion, integrate renewable electricity, and improve grid planning without disrupting physical infrastructure. In 2026, the European Commission stated that digital energy solutions and demand-side flexibility could reduce electricity costs for EU consumers by more than €71 billion per year.
- The Commission also launched the AI.grids initiative with 48 partners to develop AI models for electricity-grid planning and management. These developments support wider adoption of electrical digital twins as utilities move toward real-time network visibility, automated decision-making, and more flexible grid operations.
Digital Gas & Steam Power Plant is gaining importance in the Electrical Digital Twin Market as power producers use virtual plant models to monitor turbines, generators, electrical systems, operating temperatures, equipment loads, and maintenance requirements. In 2025, U.S. utility-scale electricity generation reached approximately 4.43 trillion kWh, while natural gas supplied about 41% of total generation.
Natural-gas generating units also represented around 40.0% of total U.S. utility-scale generation capacity at the end of 2025. The large operating base of gas-fired generation creates practical scope for electrical digital twins to improve equipment diagnostics, simulate operating conditions, plan maintenance, and increase visibility across complex gas and steam power-plant systems.
By Deployment Analysis
Cloud-based deployment leads the Electrical Digital Twin Market with more than 61.00% share
In 2025, “Cloud-based” held a dominant market position, capturing more than a 61.00% share. Cloud deployment is preferred for electrical digital twins because utilities and industrial operators can connect data from multiple assets, run large simulations, and access digital models across different locations without maintaining separate computing infrastructure at every site.
- In 2025, 52.74% of EU enterprises used paid cloud computing services, while adoption among large enterprises reached 84.67%, showing strong acceptance of cloud infrastructure among organizations capable of running complex digital applications. This expanding cloud base supports electrical digital twins that require scalable computing, centralized asset data, analytics, and remote engineering access.
On-premises deployment continues to hold an important position in the Electrical Digital Twin Market, particularly across power utilities, substations, generation facilities, and other critical infrastructure where operators require direct control over operational technology, confidential grid data, and real-time control systems.
The U.S. Department of Energy’s FY2025 budget request included USD 154.353 million for energy-sector cybersecurity, including USD 84.5 million for risk-management technology and tools and USD 15 million for electricity-related cybersecurity activities.
By End User Analysis
Utility service providers dominate the Electrical Digital Twin Market with more than 64.00% share
In 2025, “Utility service providers” held a dominant market position, capturing more than a 64.00% share. Utility companies increasingly use electrical digital twins to monitor substations, transformers, distribution assets, renewable connections, and electricity flows from a single digital environment.
In 2025, the U.S. Department of Energy announced USD 22.92 billion in conditional financing commitments for utilities serving more than 14.78 million customers, covering projects related to transmission, generation, energy storage, and grid modernization.
Grid infrastructure operators are becoming an important end-user group in the Electrical Digital Twin Market as transmission and distribution networks require better visibility, congestion management, system simulation, and renewable-energy integration. In 2026, the European Commission launched the AI.grids initiative with 48 partners, including grid operators and research institutes, to develop AI models for electricity-grid management and planning.
The same initiative was supported by declarations involving 14 European industry associations and 6 companies, reflecting stronger cooperation between grid operators, digital technology providers, and energy-sector participants. Such developments create favorable conditions for electrical digital twins that can reproduce network conditions, test operating scenarios, and improve grid-planning decisions before changes are made to physical infrastructure.
Key Market Segments
By Twin Type
- Product digital twin
- Process digital twin
- System digital twin
By Product
- Digital Grid
- Digital Gas & Steam Power Plant
- Digital Wind Farm
- Digital Hydropower Plant
- Distributed Energy Resources (DERs)
By Deployment
- Cloud-based
- On-premises
By End User
- Utility service providers
- Grid infrastructure operators
Driver Analysis
Grid Modernization Investment Surge
The IEA estimates that meeting electricity demand through 2030 requires global annual grid investment to rise by roughly 50% from around USD 400 billion today, while a net-zero-aligned pathway would require investment to more than double from approximately USD 330 billion to USD 750 billion per year by 2030, with roughly 75% directed to distribution networks.
Electrical digital twins reduce that planning uncertainty by linking GIS, SCADA, AMI, asset-management, protection, weather, and maintenance data into a continuously calibrated electrical model; a utility can model 10,000-100,000 assets and simulate contingency, load-growth, and DER scenarios in minutes or hours rather than relying only on periodic engineering studies that can take weeks.
The business model shifts from project-based power-system studies toward subscription software, data-integration services, simulation modules, and multi-year managed-model contracts, with recurring annual software and support spend potentially reaching 10-20% of original deployment value.
Drivers Impact Analysis
| Driver | (~) % Impact on CAGR Forecast | Geographic Relevance | Impact Timeline |
|---|---|---|---|
| Grid modernization investment surge | +1.7% | North America, EU, China, India, APAC | Long term (≥ 4 years) |
| AI data-center power stress | +1.5% | North America, China, EU, Singapore, Japan | Medium term (2-4 years) |
| DER and renewable orchestration | +1.3% | North America, EU, Australia, APAC | Long term (≥ 4 years) |
| Predictive asset maintenance | +1.1% | Utilities, industry, rail, oil and gas globally | Medium term (2-4 years) |
| Digital product traceability rules | +0.8% | EU core, EU-linked exporters | Medium term (2-4 years) |
| Electrification capacity planning | +0.9% | North America, EU, developed APAC | Long term (≥ 4 years) |
Restraint Analysis
Brownfield Data-Integration Cost
A proof of concept can cost USD 10,000-50,000 and a single-use-case pilot USD 50,000-200,000, but facility-wide implementations commonly reach USD 0.5-2 million, multi-site enterprise systems USD 2-10 million or more, and complex infrastructure programs USD 4-45 million, with integration, middleware, custom APIs, and legacy modernization adding USD 30,000-200,000 beyond base platform cost.
This creates a hard capital-allocation tradeoff: utilities and industrial owners can fund physical transformers, switchgear, substations, storage, or electrical upgrades with known engineering outputs, while twin value is frequently contingent on later data cleanup and process adoption; project sponsors thus defer or narrow deployments when early implementation cost exceeds 1-3% of annual maintenance or capital budgets.
The commercial impact is lower conversion of large brownfield opportunities, longer 12-24-month sales cycles, and pressure for vendors to discount professional services or offer costly pilots, which delays recurring-software revenue and reduces near-term CAGR by an estimated 1.5 percentage points.
Restraint Impact Analysis
| Restraint | (~) % Impact on CAGR Forecast | Geographic Relevance | Impact Timeline |
|---|---|---|---|
| Brownfield data-integration cost | -1.5% | North America, EU, Japan, developed APAC | Medium term (2-4 years) |
| Poor OT data quality | -1.1% | Global industrial and utility estates | Medium term (2-4 years) |
| Cybersecurity compliance burden | -0.9% | EU, North America, critical-infrastructure markets | Medium term (2-4 years) |
| Interoperability and vendor lock-in | -0.8% | Global; utilities, data centers, industry | Long term (≥ 4 years) |
| Uncertain ROI attribution | -0.7% | Mid-market industry, commercial buildings | Short term (≤ 2 years) |
| Specialist talent scarcity | -0.6% | North America, EU, China, Japan, Australia | Long term (≥ 4 years) |
Opportunity Analysis
Data-Center Power Twin Subscriptions
Global data-center electricity use is projected to rise from around 415 TWh in 2024 to approximately 945 TWh by 2030, meaning operators will increasingly compete for constrained power rather than only for land, servers, or cooling equipment. A 20 MW AI facility may have 2-5 MW of stranded capacity due to feeder imbalance, redundant-path reservation, unobserved breaker limits, or conservative transformer loading; recovering only 5% of usable capacity can defer USD 5-20 million of electrical expansion and allow 1-3 additional high-density halls without waiting for a new utility interconnection.
The untapped pivot is to charge per energized MW, per rack, or per avoided-capacity event—roughly USD 20,000-100,000 annually for a 10-30 MW site plus premium scenario and uptime modules—instead of selling a one-time digital-twin implementation.
This is not a baseline driver because it depends on integrating the twin with DCIM, EPMS, BMS, server telemetry, and workload schedulers, then accepting operational accountability through SLA-backed capacity forecasts; suppliers achieving this can capture 10-20% annual recurring revenue growth per customer through site expansion, AI-density upgrades, and power-quality analytics within the next two years.
Opportunity Impact Analysis
| Opportunity | (~) % Potential CAGR Upside | Geographic Relevance | Execution Window |
|---|---|---|---|
| Grid capacity-as-a-service | +1.7% | North America, EU, China, APAC grid hubs | Medium term (2-4 years) |
| Data-center power twin subscriptions | +1.5% | North America, China, EU, Singapore, Japan | Short term (≤ 2 years) |
| DER market-settlement twins | +1.3% | North America, EU, Australia, Japan | Medium term (2-4 years) |
| Digital product passport twins | +1.1% | EU core, EU-linked electrical exporters | Medium term (2-4 years) |
| Managed reliability outcome contracts | +1.0% | Utilities, industry, rail, hospitals globally | Medium term (2-4 years) |
| Electrical-software M&A roll-ups | +0.8% | Europe, North America, India, Southeast Asia | Short term (≤ 2 years) |
Challenges Analysis
Power-System Talent Scarcity
The U.S. transmission, distribution, and storage workforce grew 2.7% in 2024, yet power-system employers need lineworkers, engineers, technicians, cybersecurity specialists, data specialists, and project managers at the same time. European conditions are similarly tight: over 90% of transmission-system operators reportedly experienced skill shortages that delayed projects in 2025, and more than 60% of operators identified material skills gaps in digital substations, SCADA, and grid analytics.
A utility-scale twin program typically needs 10-30 dedicated technical personnel during design and 5-15 specialists for continuing model governance, while a complex industrial or data-center deployment still needs 4-10 capable staff; failure to fill these roles increases external-consultant dependence, adds 20-40% to engineering cost, and stretches implementation from a 6-12 month plan toward 18-30 months.
The industry must respond through managed-twin operating centers, reusable validated model libraries, co-development with universities, protection-engineering academies, low-code scenario tools, and cross-training of OT teams, but the projected engineering skills gap of 200,000 by 2040 makes this a long-term -0.9 percentage-point growth friction.
Challenges Impact Analysis
| Challenge | (~) % CAGR Friction Drag | Geographic Relevance | Mitigation Horizon |
|---|---|---|---|
| Live model-data synchronization | -1.1% | Global utilities, industry, data centers | Medium term (2-4 years) |
| Power-system talent scarcity | -0.9% | North America, EU, China, Japan, Australia | Long term (≥ 4 years) |
| OT cyber-risk operations | -0.8% | EU, North America, critical infrastructure | Medium term (2-4 years) |
| Cross-vendor semantic mapping | -0.7% | Global grid, industrial, building portfolios | Long term (≥ 4 years) |
| Model validation at scale | -0.6% | Utilities, DER operators, data centers | Medium term (2-4 years) |
| Grid-capex execution delays | -0.5% | North America, EU, India, APAC | Long term (≥ 4 years) |
Geopolitical Impact Analysis
The ongoing Russia–Ukraine war and wider Middle East tensions are reshaping the Electrical Digital Twin market by increasing the need for resilient, digitally managed power systems. In February 2026, the World Bank, Government of Ukraine, European Commission and United Nations estimated damage to Ukraine’s energy sector at USD 24.8 billion, with the power subsector accounting for about 70% of that damage.
- Energy reconstruction and recovery needs reached USD 90.6 billion, while damaged or destroyed energy assets increased by around 21% from the previous assessment.
These conditions encourage utilities to use digital twins for grid restoration planning, outage simulation, asset-condition monitoring and testing alternative power-flow scenarios before physical work begins. The European Commission also announced EUR 100 million in immediate energy support and EUR 920 million for Ukraine’s 2026–2027 Winter Energy Plan, strengthening grids and decentralized generation.
Regional Insights
North America dominates with 34.20% share and USD 0.68 billion market value
In 2025, North America held the dominant position in the Electrical Digital Twin Market, capturing more than a 34.20% share and generating USD 0.68 billion. The region benefits from mature utility networks, strong cloud adoption, grid modernization programs, and growing electricity demand from data centers and manufacturing. U.S. electricity generation reached a record 4.43 thousand TWh in 2025, rising 2.8% from 2024, according to the U.S. Energy Information Administration.
Asia Pacific is emerging as the fastest-growing regional segment as electricity systems expand rapidly and renewable capacity creates more complex grid-management requirements. China’s National Energy Administration reported 452 GW of new renewable capacity in 2025, up 20.7%, while total renewable capacity reached 2,337 GW by year-end. Renewable generation also climbed to 3.99 trillion kWh, representing 38.5% of national electricity consumption.
Key Regions and Countries Insights
- North America
- US
- Canada
- Europe
- Germany
- France
- The UK
- Spain
- Italy
- Rest of Europe
- Asia Pacific
- China
- Japan
- South Korea
- India
- Australia
- Rest of APAC
- Latin America
- Brazil
- Mexico
- Rest of Latin America
- Middle East & Africa
- GCC
- South Africa
- Rest of MEA
Key Players Analysis
Siemens AG holds a strong position in the Electrical Digital Twin market through Gridscale X and its Electrical Digital Twin platform, which creates a common network model for utility planning and operations. In fiscal 2025, Siemens generated €78.9 billion in revenue, while Digital Industries recorded €17.788 billion, including €6.174 billion from software.
GE Vernova Inc. is a major Electrical Digital Twin participant through its GridOS software portfolio, which supports grid orchestration, data integration, network modelling, and digital twin applications. In 2025, the company generated $38.1 billion in revenue, while Electrification produced about $9.5 billion. Electrification backlog reached $34 billion by year-end 2025 and increased to $42 billion in the first quarter of 2026.
ABB Ltd. participates in the Electrical Digital Twin market through its electrification, automation, ABB Ability, and AI-enabled digital twin solutions for monitoring and optimizing electrical systems. In 2025, ABB generated $33.220 billion in total revenue, while its Electrification business contributed $17.357 billion. The company also invested $1.318 billion in research and development during the year.
Top Key Players Outlook
- Siemens AG
- GE Vernova Inc.
- ABB Ltd.
- Schneider Electric SE
- Microsoft Corporation
- Emerson Electric Co.
- AVEVA Group Limited
- International Business Machines Corporation
- Ansys, Inc.
- Bentley Systems, Incorporated
- Dassault Systèmes SE
- SAP SE
- Oracle Corporation
- Hitachi Energy Ltd.
- Wipro Limited
Recent Developments
- Schneider Electric reported EUR 40.152 billion in 2025 revenue, including EUR 33.130 billion from Energy Management, while adjusted EBITA reached EUR 7.520 billion.
- June 2026, Microsoft Corporation it announced a new Texas data-centre campus that will add roughly 2 GW of capacity and support more than 6,000 construction jobs at peak build-out.
- Emerson reported USD 18.016 billion in FY2025 net sales, while Software and Control sales reached about USD 5.7 billion, increasing 5%; the company also stated that around 8% of sales was spent on innovation.
Report Scope
| Report Features | Description |
|---|---|
| Market Value (2025) | USD 17.6 Bn |
| Forecast Revenue (2035) | USD 247.3 Bn |
| CAGR (2026-2035) | 30.6% |
| Base Year for Estimation | 2025 |
| Historic Period | 2020-2024 |
| Forecast Period | 2026-2035 |
| Report Coverage | Revenue Forecast, Market Dynamics, Competitive Landscape, Recent Developments |
| Segments Covered | By Twin Type (Product digital twin, Process digital twin, System digital twin), By Product (Digital Grid, Digital Gas & Steam Power Plant, Digital Wind Farm, Digital Hydropower Plant, Distributed Energy Resources (DERs)), By Deployment (Cloud-based, On-premises), By End User (Utility service providers, Grid infrastructure operators) |
| Regional Analysis | North America – US, Canada; Europe – Germany, France, The UK, Spain, Italy, Rest of Europe; Asia Pacific – China, Japan, South Korea, India, Australia, Singapore, Rest of APAC; Latin America – Brazil, Mexico, Rest of Latin America; Middle East & Africa – GCC, South Africa, Rest of MEA |
| Competitive Landscape | Siemens AG, GE Vernova Inc., ABB Ltd., Schneider Electric SE, Microsoft Corporation, Emerson Electric Co., AVEVA Group Limited, International Business Machines Corporation, Ansys, Inc., Bentley Systems, Incorporated, Dassault Systèmes SE, SAP SE, Oracle Corporation, Hitachi Energy Ltd., Wipro Limited |
| Customization Scope | Customization for segments, region/country-level will be provided. Moreover, additional customization can be done based on the requirements. |
| Purchase Options | We have three licenses to opt for: Single User License, Multi-User License (Up to 5 Users), Corporate Use License (Unlimited User and Printable PDF) |





































