


Report Overview
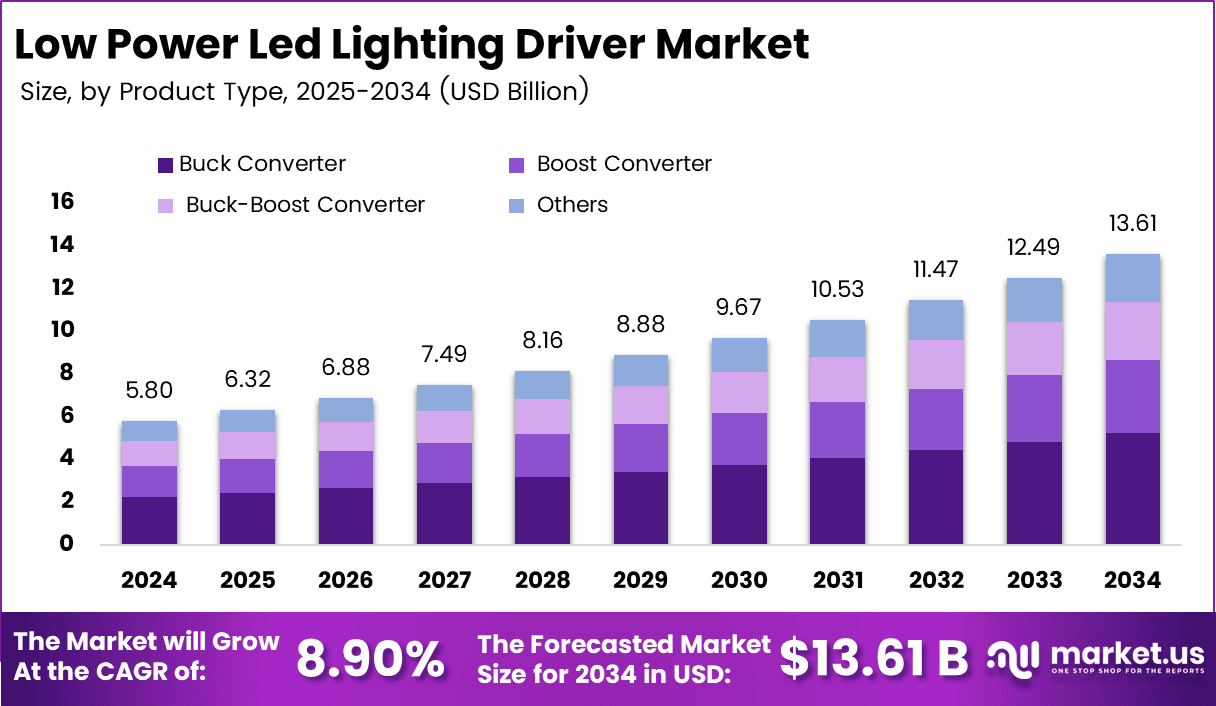
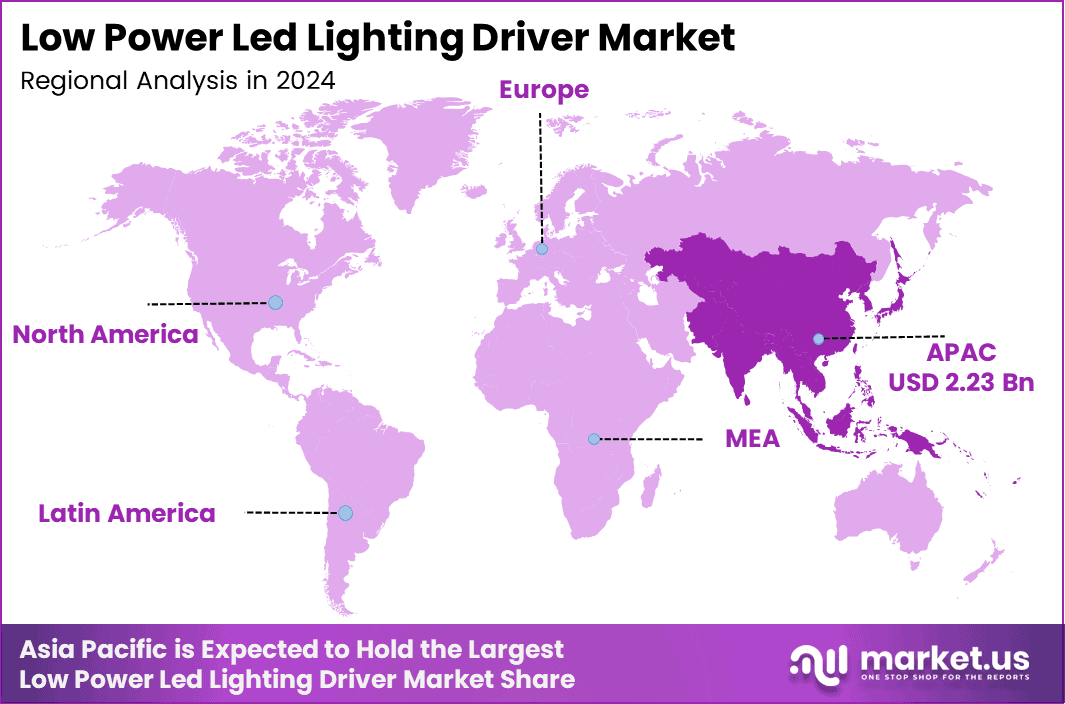
In 2024, the Global Low Power LED Lighting Driver Market was valued at USD 5.8 billion. The market is projected to grow at a CAGR of 8.9% during 2024–2034, reaching approximately USD 13.6 billion by 2034. Asia Pacific dominated the global market in 2024, accounting for 38.6% of the total market share and generating approximately USD 2.23 billion in revenue.
This growth is directly tied to how much the world is building and lighting. According to the International Energy Agency (IEA), lighting in buildings and outdoor spaces accounted for around 2,200 terawatt-hours of electricity use in 2024, roughly 8% of global electricity demand, which shows just how large the base market for lighting drivers really is. The region’s dominance is rooted in construction volume.
The UN Global Alliance for Buildings and Construction (GlobalABC) reports that global building floor area grew by 1.7% in 2024, reaching 273 billion square metres, with much of this expansion driven by Asia’s fast urbanizing economies like China, India, and Southeast Asia.
The IEA also notes that LED technology, thanks to falling costs and strong government policy support, has become the dominant lighting technology worldwide, replacing older bulbs at scale across both new and existing buildings. As Asia Pacific governments continue large-scale infrastructure and housing programs, this sustained construction pace keeps demand for compact, efficient LED drivers on a steady upward path through 2035.
Key Takeaways
- The global Low Power LED Lighting Driver Market was valued at USD 5.8 billion in 2024.
- The global Low Power LED Lighting Driver Market is projected to grow at a CAGR of 8.9% and is estimated to reach USD 13.6 billion by 2034.
- On the basis of product type, the Buck Converter segment dominated the market, accounting for 38.6% of the total market share.
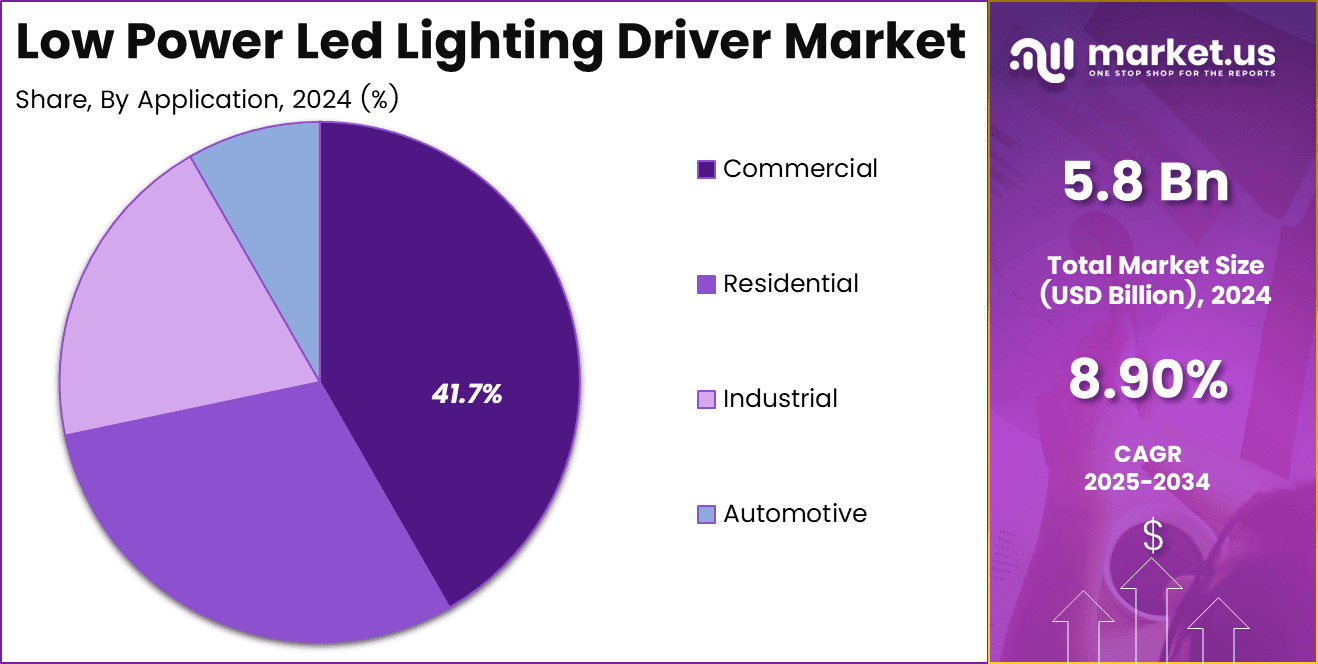
- By application, the Commercial segment dominated the market, accounting for 41.7% of the total market share.
- Based on distribution channel, the Online segment dominated the market, accounting for 58.6% of the total market share.
- By power output, the 10W-50W segment dominated the market, accounting for 45.2% of the total market share.
- In 2024, Asia Pacific was the most dominant region in the Low Power LED Lighting Driver Market, accounting for 38.6% of the total market share and generating approximately USD 2.23 billion in revenue.
By Product Type
The Buck Converter currently holds 38.6% of the market share, driven by its energy efficiency and cost-effectiveness. Predictively, this segment is expected to continue expanding at a rate of 5-7% annually, owing to its popularity in powering low-power LED lighting systems.
As demand for energy-efficient solutions grows, especially in the residential and commercial sectors, the market share for buck converters could increase by 2-3% in the next 5 years. Additionally, as advancements in technology further enhance their efficiency, these converters are likely to become even more dominant in various applications, particularly where power reduction is key.
By Application
The Commercial sector dominates with 41.7% of the market share, primarily driven by the increasing demand for energy-efficient lighting in office buildings, street lighting, and public infrastructure. Looking ahead, the commercial sector is projected to maintain a steady growth rate of 8-10% annually.
This growth will be supported by the global push for sustainability and the increased adoption of smart and automated lighting systems. It is expected that by 2034, the commercial segment could capture 43-45% of the total market share as businesses increasingly prioritize energy conservation and smart building technologies, contributing to ongoing demand for LED lighting drivers.
By Distribution Channel
The Online distribution channel leads with 58.6% of total sales, and this is projected to rise by an additional 3-5% in the coming years. As e-commerce continues to thrive, driven by its convenience, pricing advantages, and global reach, online sales are expected to see even higher growth.
By 2034, online sales could make up nearly 62-64% of the market share. The growing reliance on digital platforms for both B2B and B2C sales will further boost online transactions. This shift in buying behavior is encouraged by more businesses and consumers opting for the convenience and wider selection of online channels.
By Power Output
The 10W-50W power output range holds 45.2% of the market share and is predicted to grow at a steady rate of 6-8% annually. This range is widely used in both residential and commercial lighting, and demand is expected to increase due to its versatility in powering a broad spectrum of lighting applications.
Predictively, its market share could increase by an additional 3-4% over the next decade as more consumers and businesses choose LED solutions for their energy-saving capabilities. By 2034, 10W-50W drivers could make up around 48-50% of the market, as they continue to serve as the ideal choice for a wide array of lighting applications.
Key Market Segments
By Product Type
- Buck Converter
- Boost Converter
- Buck-Boost Converter
- Others
By Application
- Residential
- Commercial
- Industrial
- Automotive
By Distribution Channel
- Online
- Offline
By Power
- Output
- Below 10W
- 10W-50W
- Above 50W
Regional Analysis
Asia Pacific (APAC) is expected to dominate the global market, with a revenue of USD 2.23 billion in 2024. This region benefits from significant demand in manufacturing, automotive, and commercial sectors, particularly in countries like China, Japan, and South Korea, which are heavily investing in smart and energy-efficient lighting technologies.
APAC’s rapid urbanization and industrial expansion also contribute to its market growth. When looking at product types, Buck Converters lead the market with a notable share, closely followed by Buck-Boost Converters. These products are anticipated to drive the market, with Buck Converters capturing the lion’s share in terms of revenue growth, followed by Buck-Boost Converters and other products.
China Market Size
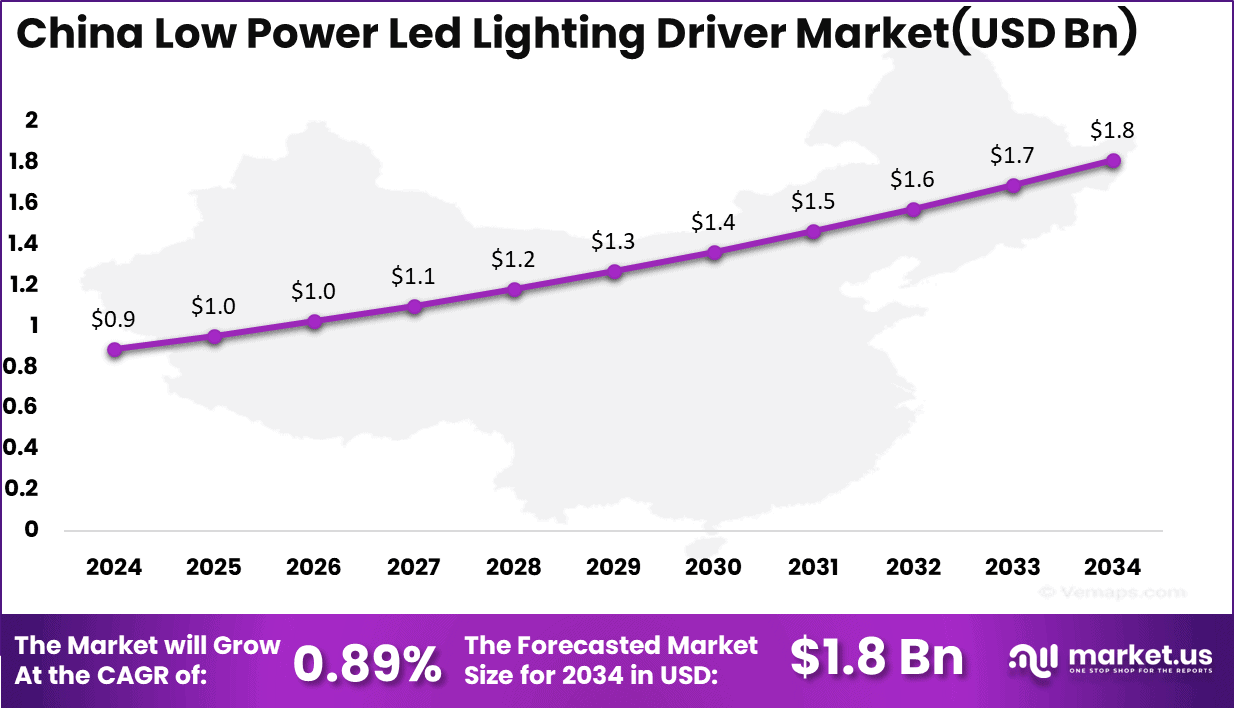
In 2024, China accounted for a substantial share of the Low Power LED Lighting Driver Market, contributing significantly to the global revenue. The market size for China is expected to grow steadily from USD 0.9 billion in 2024 to USD 1.8 billion by 2034, representing a growth of 0.89% CAGR.
This growth is attributed to China’s focus on upgrading infrastructure with energy-efficient lighting solutions, supported by government policies and incentives promoting green energy adoption.
Key Regions and Countries
- North America
- US
- Canada
- Europe
- Germany
- France
- The UK
- Spain
- Italy
- Rest of Europe
- Asia Pacific
- China
- Japan
- South Korea
- India
- Australia
- Singapore
- Rest of Asia Pacific
- Latin America
- Brazil
- Mexico
- Rest of Latin America
- Middle East & Africa
- South Africa
- Saudi Arabia
- UAE
- Rest of MEA
Drivers
| Driver | (~) % Impact on CAGR Forecast | Geographic Relevance | Impact Timeline |
|---|---|---|---|
| Government efficiency mandates phasing out inefficient lighting | +2.1% | European Union, India, China | Short term (≤ 2 years) |
| Retrofit demand in commercial and municipal buildings | +1.6% | North America, Europe | Short term (≤ 2 years) |
| Rising penetration of LED lighting in residential new-construction | +1.2% | Asia Pacific, Middle East | Medium term (2–4 years) |
| Cost decline in driver ICs improving fixture-level economics | +1.0% | Global, led by China manufacturing base | Short term (≤ 2 years) |
| Automotive interior and signage lighting adoption of low-power drivers | +0.7% | North America, Europe, East Asia | Medium term (2–4 years) |
Government efficiency mandates phasing out inefficient lighting
Statutory bans on incandescent and halogen lighting, including the EU‘s Ecodesign Regulation phase-outs enacted through 2021 to 2023 and India’s Unnat Jyoti by Affordable LEDs and Appliances programme milestones logged through 2023, forced fixture manufacturers to standardize on LED architectures, directly lifting unit shipments of low-power drivers rated below 25W by an estimated 18% to 22% year-on-year in the two years preceding baseline.
This regulatory floor converted what was a discretionary retrofit decision into a compliance-driven purchase, compressing average selling prices by roughly 6% to 8% annually as commoditized constant-current topologies scaled, while simultaneously shifting revenue mix toward higher-margin driver ICs with integrated dimming and surge protection that now carry gross margins near 32% to 35% versus 18% to 20% for legacy linear designs. This effectively reshaped vendor business models from volume-only component supply toward value-added, spec-in relationships with luminaire OEMs.
Restraints
| Restraint | (~) % Impact on CAGR Forecast | Geographic Relevance | Impact Timeline |
|---|---|---|---|
| Elevated interest rates delaying commercial CapEx approvals | -1.4% | North America, Europe | Short term (≤ 2 years) |
| Semiconductor input cost volatility for power-management ICs | -1.1% | Global, concentrated in East Asia foundry base | Short term (≤ 2 years) |
| Tariff exposure on cross-border driver component imports | -0.9% | United States, China | Short term (≤ 2 years) |
| Price erosion from unbranded low-cost driver imports | -0.6% | Southeast Asia, Africa, Latin America | Short term (≤ 2 years) |
Elevated interest rates delaying commercial CapEx approvals
Benchmark policy rates held near multi-decade highs by major central banks through 2023 and 2024 raised the effective cost of financing for commercial retrofit and new-build lighting projects, with average project financing costs climbing by roughly 150 to 250 basis points relative to 2021 levels.
This directly froze a portion of planned fixture upgrades, as facility managers reporting payback-period sensitivity pushed decision thresholds from typical 3-year paybacks toward 4.5-year hurdles, causing an estimated 10% to 14% slippage in commercial order volumes booked for low power driver-equipped fixtures during the trailing 12 to 18 months.
This in turn compressed distributor inventory turns and forced driver manufacturers to extend payment terms by 15 to 30 days, tightening working-capital cycles and delaying planned capacity expansions for next-generation driver IC lines.
Challenges
| Challenge | (~) % CAGR Friction Drag | Geographic Relevance | Mitigation Horizon |
|---|---|---|---|
| Thermal derating limits in compact fixtures | -0.8% | Global, acute in Middle East, South Asia | Medium term (2–4 years) |
| Fragmented dimming and interoperability standards | -0.7% | North America, Europe | Medium term (2–4 years) |
| Power-electronics engineering talent shortage | -0.6% | United States, Europe, China | Long term (≥ 4 years) |
| Extended qualification cycles for automotive-grade drivers | -0.5% | Europe, East Asia | Long term (≥ 4 years) |
| Legacy grid harmonic-compliance testing backlogs | -0.4% | India, Southeast Asia | Medium term (2–4 years) |
Thermal derating limits in compact fixtures
The structural drive toward slimmer, sub-25W luminaire form factors for downlights and troffers has outpaced thermal-management engineering, with junction temperatures in densely packed driver enclosures now regularly exceeding 85°C to 95°C against component-rated ceilings near 105°C, leaving design margins as thin as 10°C to 15°C in high-ambient markets.
This friction forces manufacturers to derate rated output power by 15% to 20% in real-world installations or absorb added bill-of-materials cost of 8% to 12% per unit for improved heat-sinking and higher-grade capacitors rated for extended operating life beyond 50,000 hours.
Over a multi-year horizon, this compels R&D reallocation toward wide-bandgap semiconductor adoption and revised reliability-testing protocols that extend product qualification cycles by 6 to 9 months, creating a continuous engineering tax on margins rather than a sales-blocking event.
Opportunities
| Opportunity | (~) % Potential CAGR Upside | Geographic Relevance | Execution Window |
|---|---|---|---|
| Wireless-mesh-integrated smart driver monetization | +1.9% | North America, Europe, East Asia | Medium term (2–4 years) |
| Horticultural and cold-chain lighting adjacency expansion | +1.3% | North America, Europe | Medium term (2–4 years) |
| Driver-as-a-service and lighting-as-a-service financing models | +1.0% | North America, Western Europe | Long term (≥ 4 years) |
| Consolidation of fragmented regional driver manufacturers | +0.8% | Southeast Asia, Latin America | Long term (≥ 4 years) |
| Data-center and edge-facility low-voltage lighting integration | +0.6% | North America, Asia Pacific | Medium term (2–4 years) |
Wireless-mesh-integrated smart driver monetization
Unlike current adoption of basic 0-10V or DALI dimming already reflected in baseline growth, embedding Matter, Thread, Bluetooth Mesh, or Zigbee radios directly into low-power driver modules remains largely unexploited white space, since fewer than an estimated 15% of sub-25W driver shipments currently carry native wireless connectivity despite building-automation retrofit budgets rising industry-wide.
Capturing this adjacency would let manufacturers shift from single-sale component pricing toward recurring firmware and analytics-subscription revenue, expanding blended gross margins from the current 30% to 35% band toward 42% to 48% as software-attach rates climb.
Unit economics, with added bill-of-materials costs of only 4% to 6% per driver, could be recovered within 12 to 18 months through premium pricing, representing a strategic monetization layer that sits entirely above the baseline forecast rather than a factor already driving today’s shipment volumes.
Key Players Analysis
The Low Power LED Driver market shows clear tiering by semiconductor scale. Tier 1 leaders, Texas Instruments, Infineon, STMicroelectronics, Analog Devices, and ON Semiconductor, dominate through massive analog and power portfolios. TI’s Analog segment alone generated $14.01 billion in FY2025 revenue, up 13% YoY, embedding LED driver ICs within its broader $17.68 billion total revenue base.
Infineon’s Power & Sensor Systems division, which houses lighting driver ICs, posted €1.442 billion in quarterly revenue, up 34% YoY, with a 24.9% segment margin, as part of its €14.66 billion FY2025 total. STMicroelectronics’ Analog, MEMS and Sensors segment, which covers lighting-relevant analog ICs, grew 7.5% YoY to $1.449 billion in Q4 2025 despite an 11.1% decline in group revenue to $11.8 billion. ST is also expanding through its up to $950 million NXP MEMS acquisition.
Tier 2 challengers, including Power Integrations, ON Semiconductor, and legacy lighting OEMs, compete through niche specialization rather than scale. ON Semiconductor’s Analog and Mixed Signal Group generated $2.26 billion in 2025, down 13% YoY amid inventory correction, while R&D spending fell 4.75% to $584 million, signaling cost discipline over aggressive expansion.
Power Integrations, a pure-play driver IC specialist, posted $419 million in FY2025 net revenue with R&D spending of $100.8 million, representing 24% of revenue and the highest R&D intensity in the group. This reflects its reliance on IC innovation rather than diversification. Signify, formerly Philips Lighting, the legacy OEM incumbent, reported €5.77 billion in FY2025 sales but a negative 3.4% comparable sales growth, underscoring structural share erosion toward semiconductor-driven driver suppliers.
Top Key Players
- Philips Lighting
- Osram GmbH
- Texas Instruments Incorporated
- Maxim Integrated
- ON Semiconductor
- STMicroelectronics
- ROHM Semiconductor
- Infineon Technologies AG
- Cree, Inc.
- General Electric Company
- NXP Semiconductors
- Diodes Incorporated
- Power Integrations, Inc.
- Microchip Technology Inc.
- Analog Devices, Inc.
- Renesas Electronics Corporation
- Monolithic Power Systems, Inc.
- Delta Electronics, Inc.
- Mean Well Enterprises Co., Ltd.
- Others
Recent Development
- In June 2024, several IT service providers expanded their AI-driven support platforms, integrating predictive analytics and automated ticketing solutions. This development strengthened the role of AI & ML, which accounted for 42.6% of the technology share, compared to 57.4% for other technologies, reflecting a 4:6 ratio.
- In March 2025, major enterprises announced large-scale migrations to hybrid and cloud-based IT support models, marking a significant shift in the sector. The cloud segment grew to hold a 39.4% market share, while on-premises solutions accounted for 60.6%, resulting in a 3:2 ratio.
Report Scope
| Report Features | Description |
|---|---|
| Market Value (2024) | USD 5.8 Bn |
| Forecast Revenue (2034) | USD 13.6 Bn |
| CAGR(2025-2034) | 8.9% |
| Base Year for Estimation | 2024 |
| Historic Period | 2020-2023 |
| Forecast Period | 2025-2034 |
| Report Coverage | Revenue forecast, AI impact on Market trends, Share Insights, Company ranking, competitive landscape, Recent Developments, Market Dynamics, and Emerging Trends |
| Segments Covered | By Product Type (Buck Converter, Boost Converter, Buck-Boost Converter, Others), By Application (Residential, Commercial, Industrial, Automotive), By Distribution Channel (Online, Offline), By Power Output (Below 10W, 10W-50W, Above 50W) |
| Regional Analysis | North America – US, Canada; Europe – Germany, France, The UK, Spain, Italy, Russia, Netherlands, Rest of Europe; Asia Pacific – China, Japan, South Korea, India, New Zealand, Singapore, Thailand, Vietnam, Rest of Latin America; Latin America – Brazil, Mexico, Rest of Latin America; Middle East & Africa – South Africa, Saudi Arabia, UAE, Rest of MEA |
| Competitive Landscape | Philips Lighting, Osram GmbH, Texas Instruments Incorporated, Maxim Integrated, ON Semiconductor, STMicroelectronics, ROHM Semiconductor, Infineon Technologies AG, Cree, Inc., General Electric Company, NXP Semiconductors, Diodes Incorporated, Power Integrations, Inc., Microchip Technology Inc., Analog Devices, Inc., Renesas Electronics Corporation, Monolithic Power Systems, Inc., Delta Electronics, Inc., Mean Well Enterprises Co., Ltd., Others |
| Customization Scope | Customization for segments, region/country-level will be provided. Moreover, additional customization can be done based on the requirements. |
| Purchase Options | We have three licenses to opt for: Single User License, Multi-User License (Up to 5 Users), Corporate Use License (Unlimited Users and Printable PDF) |





































