


Report Overview
In 2024, the Global Mobile Phone Wireless Fast Charging Market was valued at USD 979.2 million. The market is projected to grow at a CAGR of 21.1% during 2024–2034, reaching approximately USD 6,642.2 million by 2034. North America dominated the global market in 2024, accounting for 42.1% of the total market share and generating approximately USD 412.3 million in revenue.
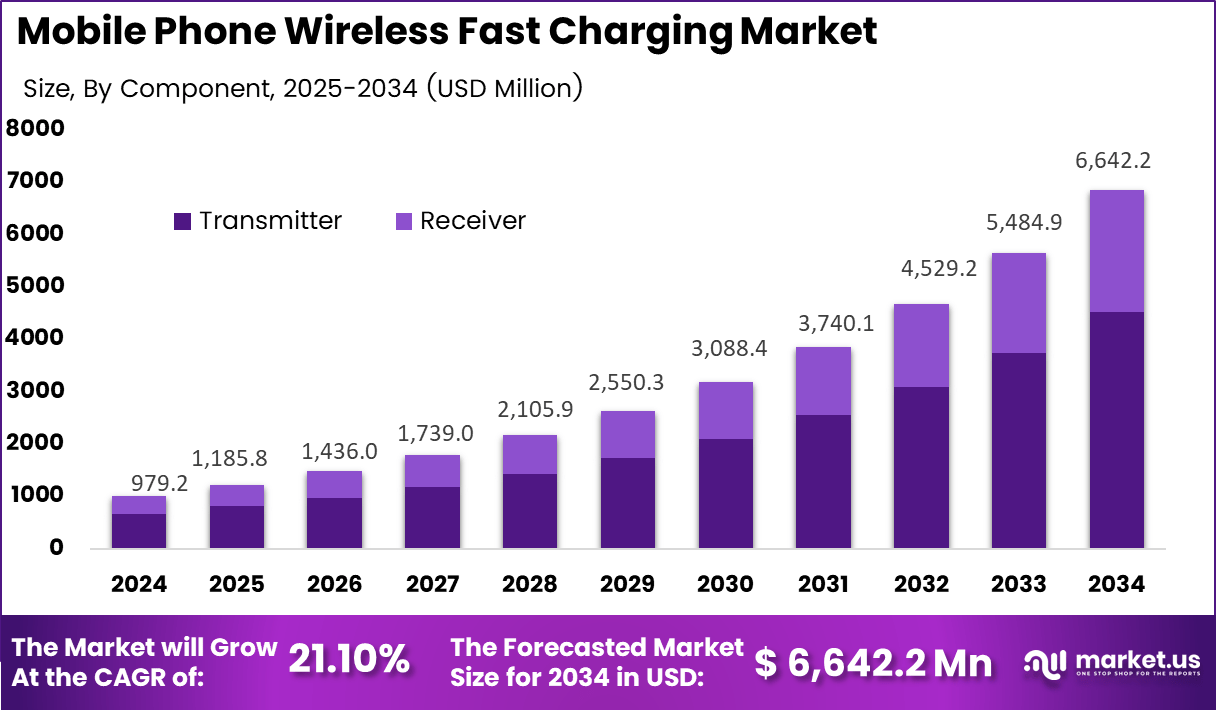
The Mobile Phone Wireless Fast Charging Market is experiencing rapid growth, driven by the increasing demand for convenient and efficient charging solutions in the consumer electronics sector. As mobile devices become integral to daily life, the need for faster and more reliable charging technologies has surged, paving the way for advancements in wireless fast charging.
This market encompasses a range of technologies and components, including transmitters and receivers, catering to a global audience across various regions. With ongoing innovations and rising adoption rates, the market is poised to play a pivotal role in shaping the future of mobile technology.
Key Takeaways
- The global Mobile Phone Wireless Fast Charging Market was valued at USD 979.2 million in 2024.
- The global Mobile Phone Wireless Fast Charging Market is projected to grow at a CAGR of 21.1% and is estimated to reach USD 6,642.2 million by 2034.
- On the basis of component, the Transmitter segment dominated the market, accounting for 68.1% of the total market share.
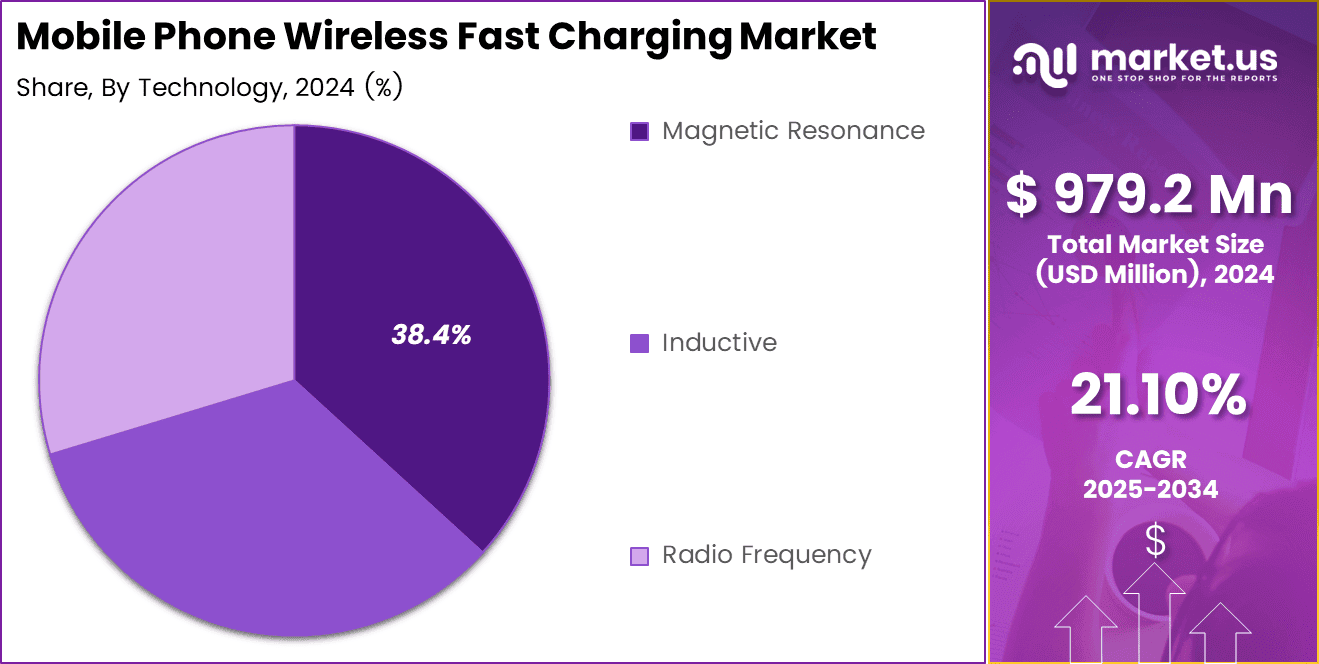
- Based on technology, the Magnetic Resonance segment dominated the market, accounting for 38.4% of the total market share.
- In 2024, North America was the most dominant region in the Mobile Phone Wireless Fast Charging Market, accounting for 42.1% of the total market share and generating approximately USD 412.3 million in revenue.
By Component
The Mobile Phone Wireless Fast Charging Market is shaped significantly by its key components, with the transmitter and receiver playing central roles in driving growth. The transmitter segment leads the pack, accounting for a substantial 68.1% of the market share, reflecting its critical role in delivering efficient power transfer to devices.
The receiver component complements this, holding a solid 31.9% share, as it ensures seamless energy uptake within phones and other gadgets. Together, these elements highlight the market’s reliance on robust, well-coordinated technology to meet the rising demand for cord-free charging solutions, making them essential to the ecosystem’s expansion across various regions and user needs.
By Technology
A variety of technologies drive the Mobile Phone Wireless Fast Charging Market, each contributing uniquely to its growth. Magnetic Resonance takes the lead, holding a significant 38.4% share, thanks to its ability to charge devices over a distance, offering the flexibility that users love. Inductive technology follows closely, capturing 32.8% of the market with its reliable, close-contact charging that’s become a staple in many devices.
Radio Frequency rounds out the trio, accounting for 28.8%, providing a niche yet growing option for powering gadgets in innovative ways. Together, these technologies showcase the market’s diversity, catering to different preferences and use cases, from home setups to on-the-go solutions, and fueling the shift toward a wireless charging future.
Key Market Segment
By Component
- Transmitter
- Receiver
By Technology
- Magnetic Resonance
- Inductive
- Radio Frequency
Regional Analysis
The North America Mobile Phone Wireless Fast Charging Market is set to lead the charge in regional adoption, with the market valued at USD 412.3 million in 2024. This strong foundation underscores the area’s dominance, fueled by a tech-forward culture where folks are quick to embrace gadgets that simplify life, like dropping a phone on a pad for a quick boost without the usual cable chaos.
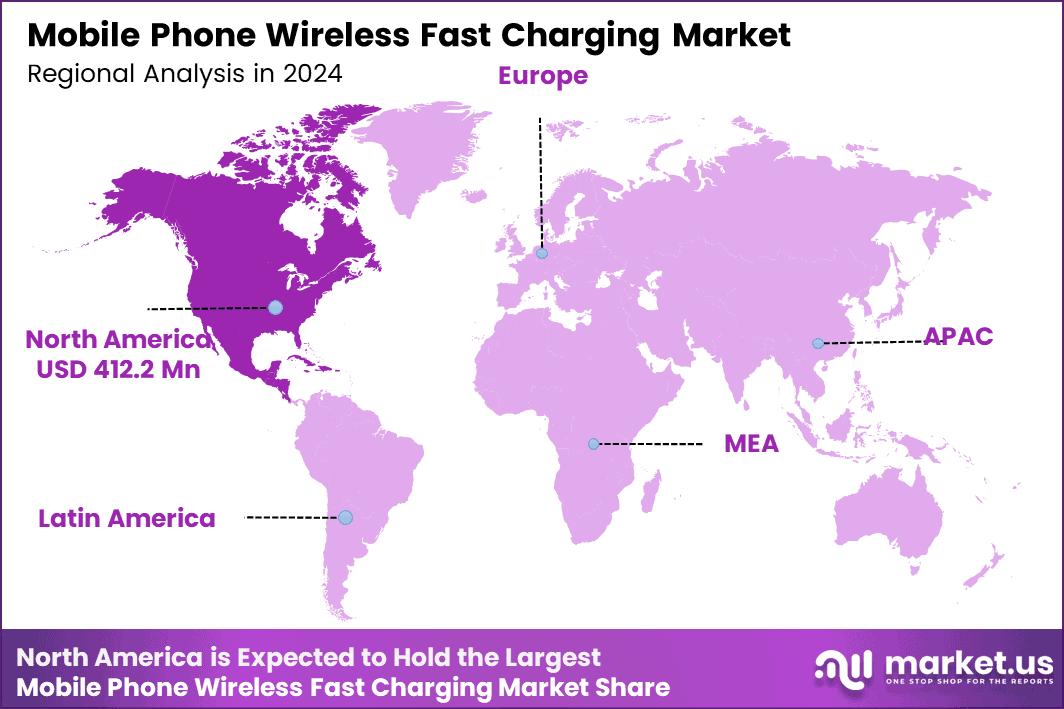
In the bigger picture, North America’s edge comes from its blend of cutting-edge tech hubs and everyday users who value speed and ease think faster 15W charging that matches busy schedules without the heat or hassle of older setups.
Government nods toward energy-smart designs and safety checks are keeping things smooth, while the rise in connected gear like smartwatches pairs perfectly with phone chargers. It’s this mix of practical perks and forward momentum that has people here ditching cords for good, turning wireless into the everyday go-to for powering up on the fly.
US Market Size
The US Mobile Phone Wireless Fast Charging Market is set to experience significant growth, with the market projected to expand at a robust 20.6% compound annual growth rate (CAGR). This steady increase reflects the rising demand for efficient, cord-free charging solutions, positioning the market to reach a value of USD 371.01 million in 2024.
Driven by innovations in wireless technology and growing consumer adoption, this upward trend highlights the sector’s potential to transform how mobile devices are powered across the country.
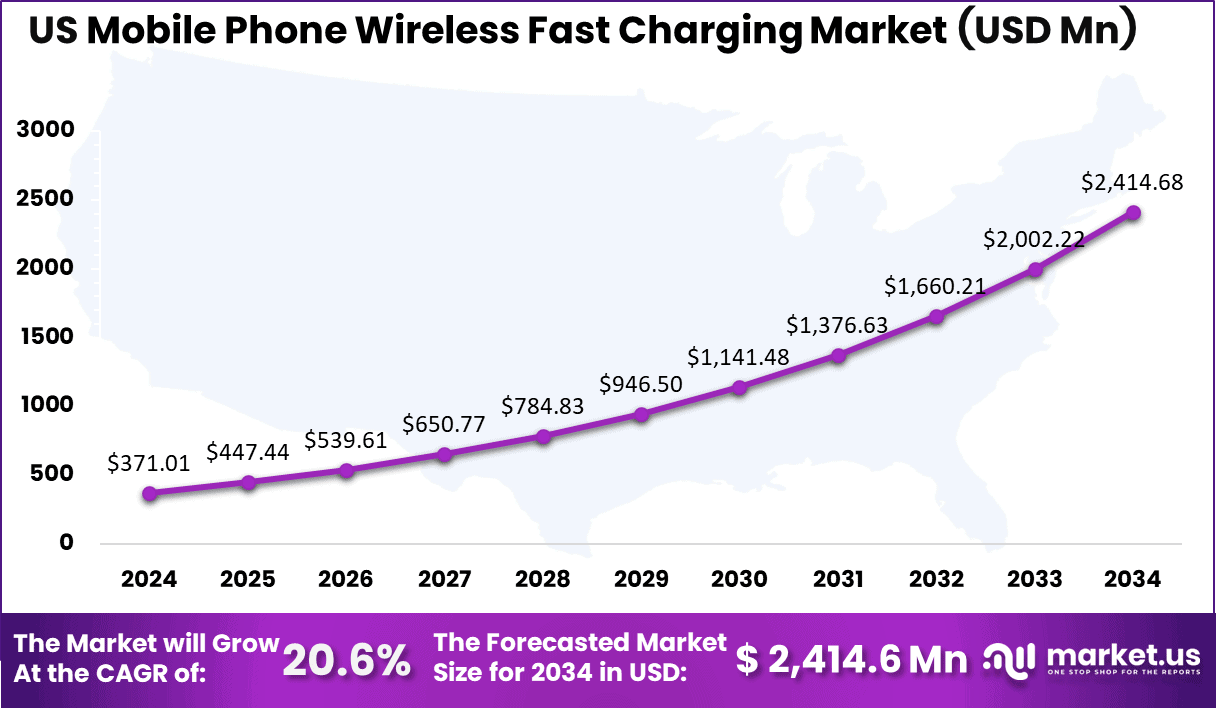
The US wireless fast charging market is poised for robust expansion, starting from a solid base in 2024 and climbing steadily through the decade. This growth reflects the rising integration of fast wireless tech in smartphones, driven by consumer demand for quicker, cord-free power-ups that match the pace of modern lifestyles.
Key Regions and Countries
- North America
- US
- Canada
- Europe
- Germany
- France
- The UK
- Spain
- Italy
- Rest of Europe
- Asia Pacific
- China
- Japan
- South Korea
- India
- Australia
- Rest of APAC
- Latin America
- Brazil
- Mexico
- Rest of Latin America
- Middle East & Africa
- GCC
- South Africa
- Rest of MEA
Drivers
| Driver | (~) % Impact on CAGR Forecast | Geographic Relevance | Impact Timeline |
|---|---|---|---|
| Qi2 magnetic alignment adoption | +2.7% | North America, Europe, East Asia | Short term (≤ 2 years) |
| Premium handset feature expansion | +2.2% | Global urban markets | Short term (≤ 2 years) |
| Multi-device charging ecosystems | +1.8% | North America, Europe, Gulf states | Medium term (2–4 years) |
| In-car charging integration | +1.5% | China, North America, Europe | Medium term (2–4 years) |
| Accessory replacement cycles | +1.3% | Global | Short term (≤ 2 years) |
| Workplace charging deployment | +1.1% | Europe, North America, developed Asia | Medium term (2–4 years) |
Qi2 magnetic alignment adoption
The transition from legacy coil-positioning designs toward Qi2 magnetic alignment is the strongest active growth catalyst because it addresses failed charging sessions and inconsistent thermal performance that previously limited repeat accessory purchases.
The Wireless Power Consortium introduced Qi2 in 2023, following accelerated magnetic-accessory ecosystem development in 2022, and certified Qi2 mobile devices can support up to 15 W charging; magnetic coupling can reduce misalignment-related power loss and cut support, return, and compatibility costs by an estimated 20–35% for accessory vendors.
Restraints
| Restraint | (~) % Impact on CAGR Forecast | Geographic Relevance | Impact Timeline |
|---|---|---|---|
| USB-C common-charger substitution | -2.8% | European Union | Short term (≤ 2 years) |
| Wireless price premium | -2.3% | Global price-sensitive markets | Short term (≤ 2 years) |
| Entry-tier handset exclusion | -1.9% | South Asia, Southeast Asia, Africa, Latin America | Medium term (2–4 years) |
| Wired-speed performance gap | -1.7% | Global | Short term (≤ 2 years) |
| Case compatibility barriers | -1.4% | Global | Short term (≤ 2 years) |
| Retail shelf-price pressure | -1.2% | Global | Short term (≤ 2 years) |
USB-C common-charger substitution
The European Union’s common-charger rules create an immediate structural restraint by making an existing USB-C cable-and-adapter combination more usable across device categories, reducing the urgency of a separate charging accessory purchase.
This can suppress incremental wireless-pad conversion in replacement transactions, particularly where consumers already own high-power wired adapters. Vendors may need to absorb an estimated 5–10% increase in retail promotion or bundle magnetic cases, stands, and multi-device functionality to preserve attachment, compressing accessory gross margins and delaying discretionary channel inventory commitments.
Challenges
| Challenge | (~) % CAGR Friction Drag | Geographic Relevance | Mitigation Horizon |
|---|---|---|---|
| Thermal management complexity | -2.5% | Global | Medium term (2–4 years) |
| Coil and magnet sourcing | -2.0% | East Asia, North America, Europe | Medium term (2–4 years) |
| Electromagnetic compliance testing | -1.7% | Global | Medium term (2–4 years) |
| Multi-device power balancing | -1.5% | North America, Europe, East Asia | Medium term (2–4 years) |
| Counterfeit accessory control | -1.4% | Global | Long term (≥ 4 years) |
| End-of-life recovery systems | -1.2% | Europe, North America, East Asia | Long term (≥ 4 years) |
Thermal management complexity
Thermal management remains the principal operational friction because inductive transfer losses generate heat across the transmitter, receiver, battery, protective case, and surrounding surface, requiring continuous derating rather than stopping product sales outright. At a 15 W class output, suppliers commonly require added thermal interface materials, foreign-object detection, temperature sensing, firmware tuning, and enclosure ventilation
These measures can add an estimated 8–15% to charger bill-of-materials cost while lengthening validation cycles by roughly 3–6 months for new form factors. Sustained mitigation requires investment in coil simulation, firmware analytics, automated reliability testing, and regional compliance laboratories, raising engineering expense but protecting long-term product reliability, return rates, and brand trust.
Opportunities
| Opportunity | (~) % Potential CAGR Upside | Geographic Relevance | Execution Window |
|---|---|---|---|
| Managed workplace charging networks | +2.4% | North America, Europe, developed Asia | Medium term (2–4 years) |
| Hospitality furniture integration | +2.0% | North America, Europe, Gulf states, East Asia | Medium term (2–4 years) |
| Certified refurbishment programs | +1.8% | Europe, North America, East Asia | Medium term (2–4 years) |
| Vehicle retrofit accessory bundles | +1.7% | North America, Europe, China | Medium term (2–4 years) |
| Emerging-market modular chargers | +1.5% | South Asia, Southeast Asia, Africa, Latin America | Long term (≥ 4 years) |
| Subscription protection services | +1.3% | North America, Europe, developed Asia | Long term (≥ 4 years) |
Managed workplace charging networks
Managed workplace charging networks are untapped future white space rather than a current driver because most corporate deployments remain ad hoc hardware purchases without fleet administration, utilisation data, replacement service, or employee-device policies.
Pooled multi-device deployment can lower installation cost per active charging point by an estimated 15–25% and lift lifecycle gross margin by approximately 8–12 percentage points versus one-time retail sales. The opportunity depends on deliberate channel partnerships with facilities managers and furniture integrators.
Key Player Analysis
Tier 1 leaders are Samsung Electronics, Apple, and Qualcomm because they control the handset installed base, charging specification adoption, and/or the mobile power-management silicon architecture.
Samsung generated KRW 333,606 billion of 2025 revenue and spent KRW 37,740 billion on R&D, an 11.3% R&D intensity, giving it the scale to bundle fast wireless charging into Galaxy flagships and accessories rather than compete only on charger margins. Qualcomm’s QCT semiconductor unit produced $38,367 million in FY2025 revenue, while QCT IoT revenue expanded 22% year over year.
Its leverage is platform-level power management and OEM design wins rather than branded pads. On an analyst-estimated share of the smartphone fast-wireless-charging value chain, including handset receiver integration, transmitter ICs and branded ecosystems, Samsung/Apple together plausibly account for 45–55%, with Qualcomm-enabled Android platforms contributing a further 15–20%.
TI reported 2025 R&D of $2,083 million and $4,550 million of capital expenditure, supporting internal manufacturing capacity and long product lifecycles for analog power components used in transmitters and adapters. Infineon generated FY2025 revenue of approximately €14.7 billion and allocated €2,227 million to R&D, 15.2% of revenue, positioning it to compete through high-efficiency MOSFET, GaN and controller content as handset OEMs move toward higher-power, lower-thermal-loss charging architectures.
Top Key Players
- Apple Inc.
- Anker Innovations
- Belkin International
- Samsung Electronics
- Xiaomi Corporation
- Mophie
- RavPower
- Aukey
- Choetech
- Native Union
- Zens
- Logitech
- Other Major Players
Recent Development
- In December 2024, EVM stepped in with the EnPad, a versatile 3-in-1 pad hitting 15W speeds across Android and iOS devices that play nice with Qi. This one’s got that everyday charm for travelers swapping phones mid-trip. EVM’s focus on broad fit keeps things inclusive, easing the jump for holdouts and quietly building momentum in a market craving no-fuss power.
- In March 2025, Tillou Management and Consulting snapped up the assets of WAVE Charging from Ideanomics, bolstering their push into high-power wireless systems for mobile fleets. Though geared toward transit vehicles, this deal spills over into mobile tech by advancing embeddable pads that could inspire similar innovations for phone charging in cars or public spots.
Report Scope
| Report Features | Description |
|---|---|
| Market Value (2024) | USD 979.2 Mn |
| Forecast Revenue (2034) | USD 6,642.2 Mn |
| CAGR(2025-2034) | 21.1% |
| Base Year for Estimation | 2024 |
| Historic Period | 2020-2023 |
| Forecast Period | 2025-2034 |
| Report Coverage | Revenue forecast, AI impact on Market trends, Share Insights, Company ranking, competitive landscape, Recent Developments, Market Dynamics, and Emerging Trends |
| Segments Covered | By Component (Transmitter, Receiver), By Technology (Magnetic Resonance, Inductive, Radio Frequency) |
| Regional Analysis | North America – US, Canada; Europe – Germany, France, The UK, Spain, Italy, Russia, Netherlands, Rest of Europe; Asia Pacific – China, Japan, South Korea, India, New Zealand, Singapore, Thailand, Vietnam, Rest of Latin America; Latin America – Brazil, Mexico, Rest of Latin America; Middle East & Africa – South Africa, Saudi Arabia, UAE, Rest of MEA |
| Competitive Landscape | Apple Inc., Anker Innovations, Belkin International, Samsung Electronics, Xiaomi Corporation, Mophie, RavPower, Aukey, Choetech, Native Union, Zens, Logitech, Other Major Players |
| Customization Scope | Customization for segments, region/country-level will be provided. Moreover, additional customization can be done based on the requirements. |
| Purchase Options | We have three licenses to choose from: Single User License, Multi-User License (Up to 5 Users), Corporate Use License (Unlimited Users, Printable PDF) |





























