


Report Overview
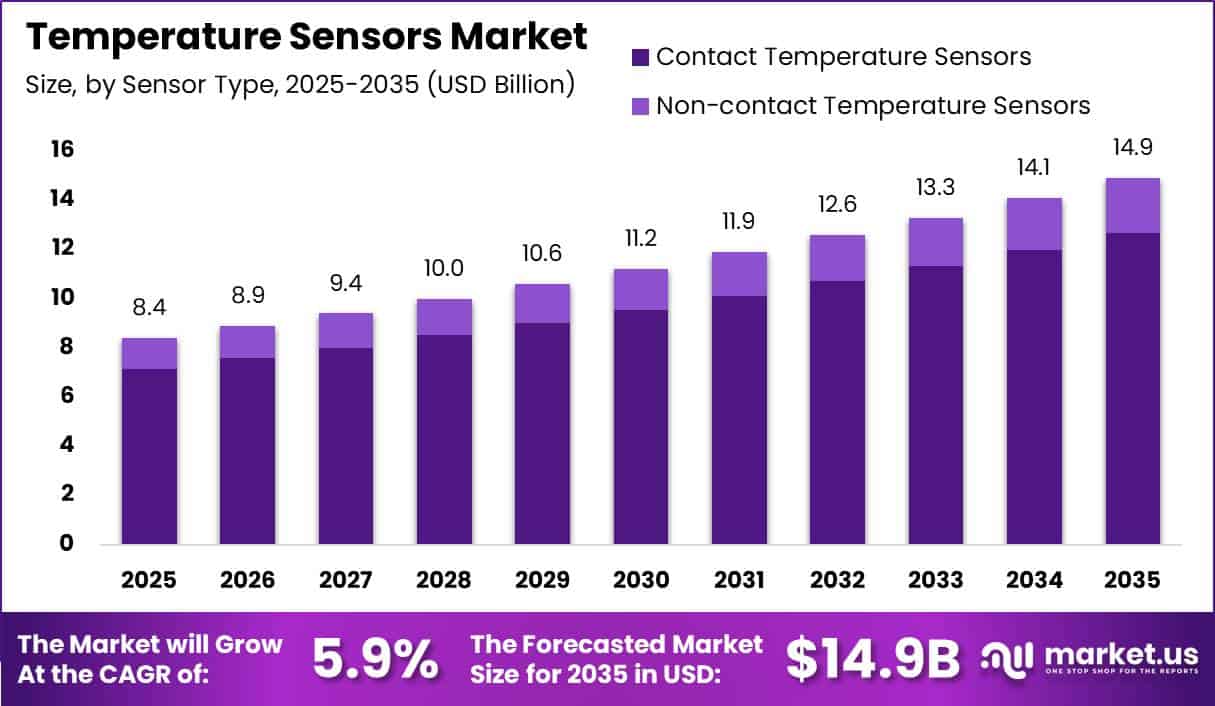
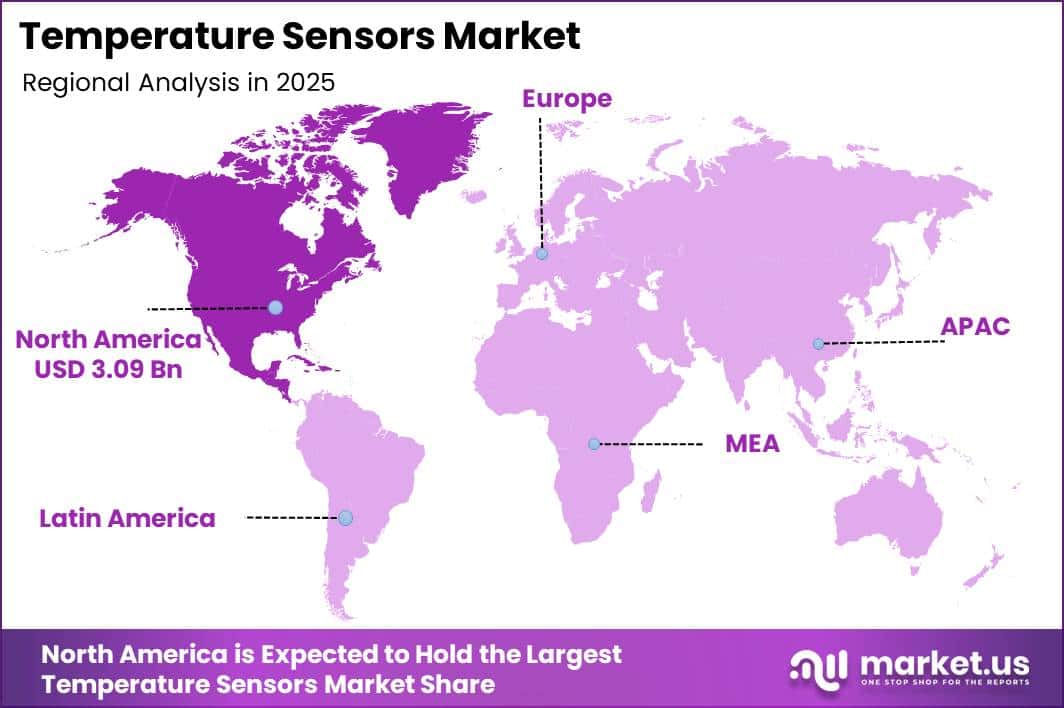
In 2025, the Global Temperature Sensors Market was valued at USD 8.4 billion. The market is projected to grow at a CAGR of 5.9% during 2026–2035, reaching approximately USD 14.9 billion by 2035. North America dominated the global market in 2025, accounting for more than 36.8% of the total market share and generating approximately USD 3.09 billion in revenue.
According to the International Energy Agency, data centers consumed 415 TWh of electricity in 2024, equal to 1.5% of global electricity use. Consumption has risen by roughly 12% annually since 2017 and could more than double to around 945 TWh by 2030, nearly 3% of worldwide demand.
The United States, Europe, and China account for about 85% of current consumption, with the United States alone representing around 45%. As hyperscale facilities expand from 20 MW to 40 MW of IT load and use thousands to tens of thousands of monitoring points, a nearly 2× rise in power demand will increase temperature sensor installations.
Electric mobility provides another growth base. Global electric car sales are expected to exceed 20 million units in 2025, representing more than 25% of total car sales, while China contributes over 70% of global EV production. Sales are forecast to rise about 25% year on year and move toward the mid-20-million range.
With around 30–40 temperature sensors used in each EV, 2025 output alone could require approximately 600–800 million units. Combined with smart-grid and factory automation growth, these trends could lift the installed base of temperature-critical assets into hundreds of millions during 2025–2035, supporting the market’s 5.9% growth rate.
Key Takeaway
- The Temperature Sensors Market is valued at USD 8.4 billion in 2025, projected to reach USD 14.9 billion by 2035 at a 5.9% CAGR.
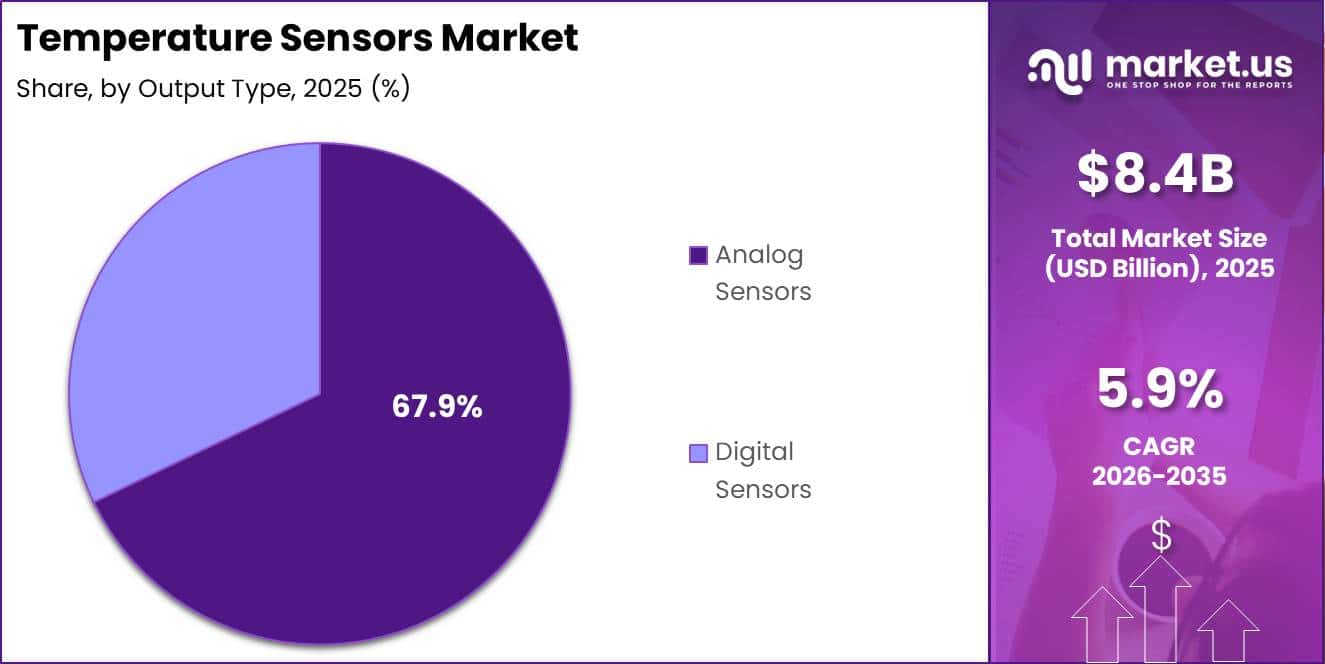
- Contact temperature sensors dominate by type with an 85.1% share, while analog sensors lead by output type with 67.9%.
- Consumer electronics is the leading end-use segment, accounting for around 27.3% of the market.
- North America led the market in 2025 with a 36.8% share and approximately USD 3.09 billion in revenue.
By Sensor Type
Contact temperature sensors account for around 85.1% of the temperature sensor market, mainly because industrial and commercial equipment requires direct temperature measurement on pipes, tanks, engines, batteries, and electrical systems. Global manufacturing generated more than USD 16 trillion in value in 2023, with China, the United States, and Germany remaining major production centers.
The automotive industry also supports segment growth. Modern vehicles use approximately 50–200 sensors, including nearly 30 sensors for drivetrain and thermal management functions. Several contact sensors are installed on engines, transmissions, cooling systems, battery packs, and power electronics.
Lithium-ion EV batteries generally perform best within a temperature range of about 30–60°C. Therefore, manufacturers place multiple sensors directly on battery modules and busbars to reduce thermal runaway risks and improve battery life.
Compared with infrared sensors, contact sensors provide more stable readings in enclosed, dusty, high-pressure, and high-temperature environments. With global vehicle production remaining above 80 million units annually, and process manufacturing continuing to expand, demand for durable contact temperature sensors is expected to remain strong.
By Output Type
Analog temperature sensors hold about 67.9% of the temperature sensor market because they remain widely used across automotive, industrial, and building systems designed around analog input channels. Global vehicle production exceeded 90 million units in 2023, with each vehicle using engine control units and battery management systems that receive temperature data from analog thermistors or resistance temperature detectors through simple, low-cost analog-to-digital converters.
Industrial expansion further supports the segment. New boilers, heat exchangers, furnaces, and processing lines are commonly connected to programmable logic controllers using analog input cards. In demanding operating conditions, analog sensors are preferred for their simple design, reliable signal transmission over long cable distances, and direct compatibility with 4–20 mA control loops.
By End-Use Industry
Consumer electronics account for around 27.3% of the temperature sensor market, supported by the large production volume of smartphones, laptops, tablets, televisions, and gaming devices. According to the International Telecommunication Union, the world has about 5.4 billion mobile phone subscriptions and more than 4.7 billion unique mobile users.
Lithium-ion batteries used in mobile phones generally operate efficiently within a temperature range of about 0–45°C. Above this level, chemical reactions can accelerate, internal pressure may rise, and the risk of battery failure can increase.
The adoption of 5G, high-refresh-rate displays, powerful processors, and advanced graphics units is also increasing device power density. As a result, manufacturers are adding more thermal monitoring points per device, supporting continued demand for temperature sensors in consumer electronics.
Key Market Segments
By Sensor Type
- Contact Temperature Sensors
- Thermocouples
- Thermistors
- Temperature Sensor ICs
- Resistance Temperature Detectors
- Bimetallic Sensors
- Non-contact Temperature Sensors
- Infrared Sensors
- Fiber Optic Sensors
By Output Type
- Analog Sensors
- Digital Sensors
By End-Use Industry
- Consumer Electronics
- Oil and Gas
- Chemicals and Petrochemicals
- Automotive
- Healthcare
- Energy and Power
- Aerospace and Defense
- Food and Beverage
- Other
Geopolitical Impact Analysis
Geopolitical tensions are increasing the cost and supply risk of temperature sensors by disrupting semiconductor materials, trade routes, energy markets, and manufacturing networks. Recent US–China trade measures include double-digit to triple-digit tariffs on selected technology products. Proposed policies could introduce a baseline tariff of 10% on most imports and duties of up to 100% on semiconductors produced by companies that do not localize manufacturing.
At the same time, advanced chip production in the United States can cost 30% or more than manufacturing at major Asian fabrication plants. China supplies around 95% of global gallium and germanium, which are important materials for compound semiconductors and sensor chips. Export controls announced in December 2024 increased material prices by about 30–50%, raising the cost of sensor dies, microcontrollers, and signal-conditioning components.
Logistics disruptions are adding further pressure. Red Sea rerouting increased Asia–Europe container rates from approximately USD 1,300 per FEU in 2023 to USD 4,588 per FEU in late 2024, representing an increase of more than 250%. In early 2026, Asia–Europe rates remained between USD 2,900 and USD 4,600 per FEU, while Asia–Mediterranean rates ranged from USD 4,300 to USD 4,600 per FEU. The Drewry World Container Index reached USD 4,639 per FEU in July 2026, its highest level since 2024.
Wider shipping disruptions raised average freight costs by 30–40%, while Cape of Good Hope routes added 10–15 days to delivery times. European industrial electricity prices also increased by 20–30% after 2022. Together, these pressures are raising sensor prices, extending lead times, and encouraging manufacturers to diversify production locations.
Regional Analysis
North America held a leading position in the temperature sensors market in 2025, capturing a 36.8% share and generating approximately USD 3.09 billion in revenue. This dominance is supported by the region’s strong base of advanced manufacturing, automotive electronics, aerospace systems, medical equipment, and commercial infrastructure.
Strict safety standards and high investment in smart equipment encourage the installation of multiple temperature sensors across HVAC systems, medical devices, industrial machinery, and automated production lines. The region’s strong technology adoption and higher sensor content per asset continue to support its leading revenue position, despite slower population growth.
Asia Pacific is the fastest-growing regional market, driven by expanding industrial production, electronics manufacturing, semiconductor fabrication, and vehicle output across China, India, South Korea, and Southeast Asia. The region accounts for well over 50% of global manufacturing value added, while China produces more than 25 million vehicles annually. Asia Pacific also exports hundreds of billions of dollars in information and communication technology products and consumer electronics each year.
Key Regions and Countries
North America
- US
- Canada
Europe
- Germany
- France
- The UK
- Spain
- Italy
- Rest of Europe
Asia Pacific
- China
- Japan
- South Korea
- India
- Australia
- Rest of APAC
Latin America
- Brazil
- Mexico
- Rest of Latin America
Middle East & Africa
- GCC
- South Africa
- Rest of MEA
Market Dynamics
Drivers
| Driver | (~) % CAGR | Geographic Relevance | Impact Timeline |
|---|---|---|---|
| EV battery thermal management demand | +2.0% | Asia-Pacific, North America, Europe | Short term (<= 2 years) |
| Industrial automation temperature monitoring | +1.5% | Global, strongest in Asia-Pacific | Medium term (2 to 4 years) |
| Healthcare cold-chain compliance | +1.2% | North America, Europe, emerging Asia | Short term (<= 2 years) |
| Smart-building HVAC optimization | +0.8% | North America, Europe, GCC | Medium term (2 to 4 years) |
| Wearable health device proliferation | +0.6% | Global, urban markets | Long term (>= 4 years) |
EV battery thermal management demand
Electric vehicle battery thermal management is a major market driver because each EV requires several temperature sensors. Global EV sales exceeded 14 million units in 2023 and are expected to surpass 20 million units by 2025. China, Europe, and the United States account for more than 80% of registrations, while new energy vehicles represent over 35% of new light-duty vehicle sales in China.
A typical EV battery pack uses around 30–50 temperature sensing points to monitor cells, cooling systems, and inverters. Maintaining battery temperatures within approximately 20–40°C can improve cycle life by more than 25%, reducing safety and warranty risks. As EV production expands across Asia Pacific and North America, higher sensor content per vehicle could add around 2.0% to the market’s baseline 5.9% CAGR.
Restraints
| Restraint | (~) % CAGR | Geographic Relevance | Impact Timeline |
|---|---|---|---|
| High-precision calibration cost burden | -1.6% | North America, Europe, pharma & food manufacturing | Short term (<= 2 years) |
| Interest rate-driven CapEx deferrals | -1.1% | Global, most visible in emerging markets | Medium term (2 to 4 years) |
| Raw material price volatility | -0.9% | Global, sensor manufacturing hubs | Short term (<= 2 years) |
| Regulatory approval lag in medical devices | -0.7% | US, EU, Japan | Long term (>= 4 years) |
| Price-sensitive demand in low-income markets | -0.5% | Sub-Saharan Africa, South Asia | Medium term (2 to 4 years) |
High-precision calibration cost burden
Calibration cost for high-accuracy temperature sensors is the most immediate restraint because it directly freezes or postpones procurement in regulated industries. According to US Food & Drug Administration and European Medicines Agency GMP guidance, validated temperature mapping and requalification of critical pharma cold rooms and sterilization equipment must occur at least every 1–3 years, requiring multi-point calibration of hundreds of probes.
Industry case studies cited by WHO’s vaccine cold-chain programs indicate that full calibration campaigns for advanced systems can cost between roughly USD 20,000 and USD 100,000 per site, depending on sensor count and accreditation scope, representing more than 5% of annual operating budgets for some smaller facilities.
At the macro level, World Bank data show real borrowing costs for industrial firms in many emerging markets still above 8%, amplifying the impact of any large periodic calibration bill on cash flow. This combination of regulatory requirement and high upfront cost prompts delayed upgrades from legacy sensors to newer digital or higher-accuracy devices, subtracting an estimated 1.6% from the baseline 5.9% CAGR by constraining near-term conversion of installed capacity even while long-term demand fundamentals remain positive.
Challenges
| Challenge | (~) % CAGR | Geographic Relevance | Mitigation Horizon |
|---|---|---|---|
| Extreme-environment sensor reliability | -1.4% | Global heavy industry, oil & gas, aerospace | Long term (>= 4 years) |
| Design-in cycle length at OEMs | -1.0% | Automotive, industrial equipment worldwide | Medium term (2 to 4 years) |
| Shortage of sensor software integration skills | -0.8% | Global, strongest in emerging markets | Long term (>= 4 years) |
| EMI & signal integrity issues | -0.7% | High-density electronics manufacturing | Medium term (2 to 4 years) |
| Fragmented interoperability standards | -0.6% | Global multi-vendor installations | Long term (>= 4 years) |
Extreme-environment sensor reliability
Reliability in extreme environments is the dominant challenge because it caps achievable growth in high-value segments without halting current sales. In refinery furnace monitoring, steel casting, and aerospace engine testing, sensors may face temperatures above 1,000 degrees Celsius and intense vibration.
Studies summarized by the American Society of Mechanical Engineers indicate that conventional thermocouples can exhibit drift exceeding 2 degrees Celsius per 1,000 operating hours under such conditions. Per International Energy Agency industrial reports, heavy industry still accounts for about 30% of global final energy use.
NASA and European Space Agency test campaigns show that qualifying radiation-hardened and high-temperature sensors for turbine and propulsion systems can take more than 5 years and cost tens of millions of dollars per program, limiting the pace at which suppliers can roll out next-generation designs.
This persistent performance gap subtracts an estimated 1.4% from the maximum achievable CAGR by forcing conservative deployment strategies, higher maintenance budgets, and slower replacement cycles, even though baseline growth around 5.9% remains intact due to broader applications in less demanding environments.
Opportunities
| Opportunity | (~) % CAGR | Geographic Relevance | Execution Window |
|---|---|---|---|
| AI-enabled predictive thermal analytics platforms | +2.2% | Global, large industrial & data center operators | Medium term (2 to 4 years) |
| Integrated wireless sensor retrofits in brownfield plants | +1.7% | Asia-Pacific, Latin America, Eastern Europe | Short term (<= 2 years) |
| Smart-home & building thermal comfort monetization | +1.3% | North America, Europe, GCC | Medium term (2 to 4 years) |
| Energy-efficiency regulation-driven retrofits | +1.1% | EU, Japan, selected US states | Long term (>= 4 years) |
| Servitized calibration & monitoring contracts | +0.9% | Global regulated industries | Medium term (2 to 4 years) |
AI-enabled predictive thermal analytics platforms
AI-enabled predictive thermal analytics offer major growth potential by converting temperature data into recurring software and service revenue. Global data centers consume around 400–500 terawatt-hours of electricity, while cooling can account for up to 40% of total power use at some hyperscale facilities. This creates strong opportunities to reduce energy costs through smarter thermal control.
Only about 20%–30% of manufacturing plants currently use predictive maintenance systems that fully combine sensor data with machine-learning models. Digital temperature optimization can reduce fuel and electricity consumption by 5%–15% and improve margins by 2–4 percentage points for some energy-intensive users. Subscription and performance-based analytics services could add around 2.2% to the market’s baseline 5.9% CAGR.
Key Players Analysis
Tier-1 companies in the temperature sensors market are large industrial and semiconductor groups with multi-billion-dollar electronics and automation businesses. Honeywell International generated around USD 9.4 billion in revenue in 2025 from Honeywell Building Technologies and Performance Materials & Technologies, including Sensing and Safety Technologies and Process Solutions. These businesses support its broad industrial and building sensor portfolio.
Texas Instruments’ Analog segment generated USD 12.1 billion in 2024, accounting for about 83% of its USD 15.6 billion total revenue. This scale strengthens its position in temperature-sensing, signal-chain, and power-management chips. Analog Devices reported USD 2.3 billion in quarterly revenue and a 40% adjusted operating margin in early fiscal 2025. Together, Tier-1 companies are estimated to control around 35–45% of temperature-sensor-related semiconductor and module revenues.
Tier-2 companies include Panasonic, Siemens, ABB, STMicroelectronics, TE Connectivity, NXP Semiconductors, and Emerson Electric. STMicroelectronics reported USD 17.2 billion in 2024 revenue, while NXP generated USD 13.3 billion, with nearly 50% linked to automotive applications.
Siemens’ Digital Industries and Smart Infrastructure divisions produced more than EUR 30 billion in 2024 revenue. TE Connectivity recorded approximately USD 16 billion in net sales, while Emerson’s Automation Solutions business generated around USD 12 billion annually. Tier-2 players are estimated to hold 30–40% of temperature sensor hardware and integrated system revenues, competing through automation investment, product integration, specialized applications, and selective mergers and acquisitions.
Top Key Players in the Market
- Honeywell International Inc.
- Texas Instruments Incorporated
- Analog Devices, Inc.
- Panasonic Corporation
- Siemens AG
- ABB Group
- STMicroelectronics N.V.
- TE Connectivity Ltd.
- NXP Semiconductors N.V.
- Emerson Electric Co.
Recent Developments
- In 2026, Honeywell Technologies completed its acquisition of Johnson Matthey’s Catalyst Technologies business on July 17 for GBP 1.325 billion in cash. The deal expanded Honeywell’s installed base across refining, petrochemicals, and renewable fuels.
- In 2026, Texas Instruments confirmed a capital expenditure plan of USD 2–3 billion as it moved into phase three of its 300 mm manufacturing roadmap.
- In 2026, ASE completed the acquisition of Analog Devices’ manufacturing facility in Penang, Malaysia, following the strategic collaboration announced in October 2025. The facility covers more than 680,000 square feet, rather than more than 100,000 square metres, as previously stated.
Report Scope
| Report Features | Description |
|---|---|
| Market Value (2025) | USD 8.4 Billion |
| Forecast Revenue (2035) | USD 14.9 Billion |
| CAGR (2026-2035) | 5.9% |
| Base Year for Estimation | 2025 |
| Historic Period | 2020-2024 |
| Forecast Period | 2026-2035 |
| Report Coverage | Revenue Forecast, Market Dynamics, Competitive Landscape, Recent Developments |
| Segments Covered | By Sensor Type (Contact Temperature Sensors [Thermocouples, Thermistors, Temperature Sensor ICs, Resistance Temperature Detectors, Bimetallic Sensors], Non-contact Temperature Sensors [Infrared Sensors, Fiber Optic Sensors]); By Output Type (Analog Sensors, Digital Sensors); By End-Use Industry (Consumer Electronics, Oil and Gas, Chemicals and Petrochemicals, Automotive, Healthcare, Energy and Power, Aerospace and Defense, Food and Beverage, Other) |
| Regional Analysis | North America – US, Canada; Europe – Germany, France, The UK, Spain, Italy, Rest of Europe; Asia Pacific – China, Japan, South Korea, India, Australia, Singapore, Rest of APAC; Latin America – Brazil, Mexico, Rest of Latin America; Middle East & Africa – GCC, South Africa, Rest of MEA |
| Competitive Landscape | Honeywell International Inc., Texas Instruments Incorporated, Analog Devices Inc., Panasonic Corporation, Siemens AG, ABB Group, STMicroelectronics N.V., TE Connectivity Ltd., NXP Semiconductors N.V., Emerson Electric Co. |
| Customization Scope | Customization for segments, region/country-level will be provided. Moreover, additional customization can be done based on the requirements. |
| Purchase Options | We have three licenses to opt for: Single User License, Multi-User License (Up to 5 Users), Corporate Use License (Unlimited Users and Printable PDF) |





































