


Report Overview
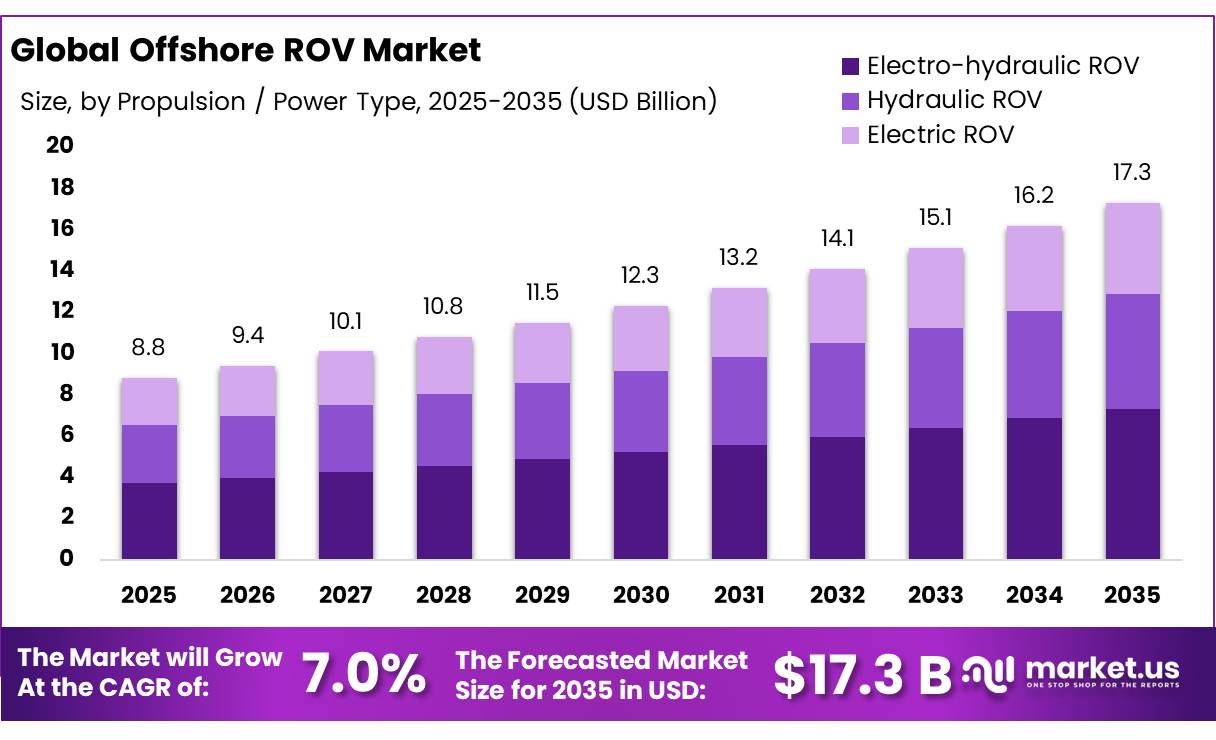
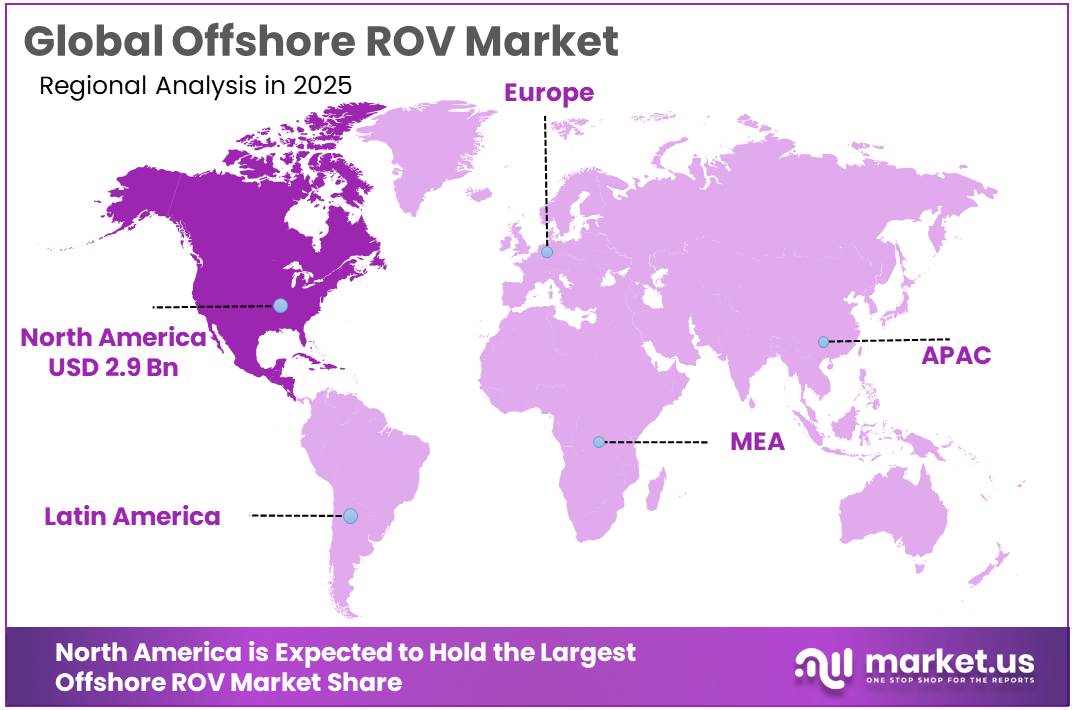
The Global Offshore ROV Market size is expected to be worth around USD 17.3 Billion by 2035, from USD 8.8 Billion in 2025, growing at a CAGR of 7.0% during the forecast period from 2026 to 2035. In 2025, North America held a dominant market position, capturing more than a 33.20% share, holding USD 2.9 Billion revenue.
The offshore remotely operated vehicle (ROV) industry plays an important role in underwater inspection, maintenance, repair, construction, and exploration activities across the oil and gas, offshore wind, marine research, and subsea infrastructure sectors. Offshore ROVs are uncrewed underwater vehicles controlled remotely from a vessel or offshore facility. They use cameras, sonar systems, robotic manipulators, sensors, and specialized tools to perform tasks in deep water where human divers face significant safety and operational limitations.
The industrial scenario is closely linked to offshore energy investment, subsea oil and gas developments, and the expansion of offshore renewable energy. The International Energy Agency (IEA) reported that global energy investment was expected to reach approximately USD 3.3 trillion in 2025, including investment across oil, gas, electricity, and clean energy. Although this figure is not specific to ROVs, it demonstrates the broad investment environment supporting offshore infrastructure and underwater inspection requirements.
Offshore energy operations are a major driver of ROV demand because operators require regular inspection of subsea pipelines, wellheads, risers, offshore platforms, and underwater production equipment. The United States Bureau of Ocean Energy Management reported that offshore federal production reached approximately 668 million barrels of oil in fiscal year 2024, representing around 14% of total domestic oil production. This scale of activity creates a continuing need for underwater inspection, maintenance, and intervention services.
Offshore wind development is another important growth opportunity. According to the Global Wind Energy Council’s Global Offshore Wind Report 2025, approximately 8 gigawatts (GW) of new offshore wind capacity was connected to electricity grids worldwide during 2024, bringing cumulative installed capacity to 83.2 GW by year-end. Offshore wind farms require underwater inspections of foundations, subsea cables, anchor systems, and other marine structures. These activities create opportunities for ROV manufacturers and service providers to supply specialized inspection vehicles, sonar equipment, high-resolution cameras, and robotic tools.
Technological development is shaping the industry’s future. Improvements in navigation, digital imaging, artificial intelligence-assisted analysis, sensor integration, and robotic manipulation are helping ROVs collect more detailed underwater data. The European Union’s Blue Economy Observatory highlights the development of underwater vehicles that can perform routine offshore inspection and maintenance with greater autonomy. Hybrid systems combining remotely operated and autonomous capabilities may improve operating efficiency, reduce vessel time, and support longer inspection missions. However, high equipment costs, specialist training requirements, challenging sea conditions, tether limitations, and dependence on support vessels remain important restraints.
Future growth opportunities are expected to arise from deepwater oil and gas projects, offshore wind installations, subsea cable protection, ageing infrastructure inspections, and marine environmental monitoring. The US Bureau of Safety and Environmental Enforcement states that it conducts approximately 20,000 component inspections annually across more than 2,000 offshore facilities, demonstrating the importance of ongoing offshore safety oversight. Such inspection requirements support demand for reliable underwater robotics and data collection systems.
Key Takeaways
- Offshore ROV Market size is expected to be worth around USD 17.3 Billion by 2035, from USD 8.8 Billion in 2025, growing at a CAGR of 7.0%.
- Heavy / work-class ROV held a dominant market position, capturing more than a 34.00% share.
- Electro-hydraulic ROV held a dominant market position, capturing more than a 42.00% share.
- Deepwater (1,000 to 3,000 metres) held a dominant market position, capturing more than a 44.60% share.
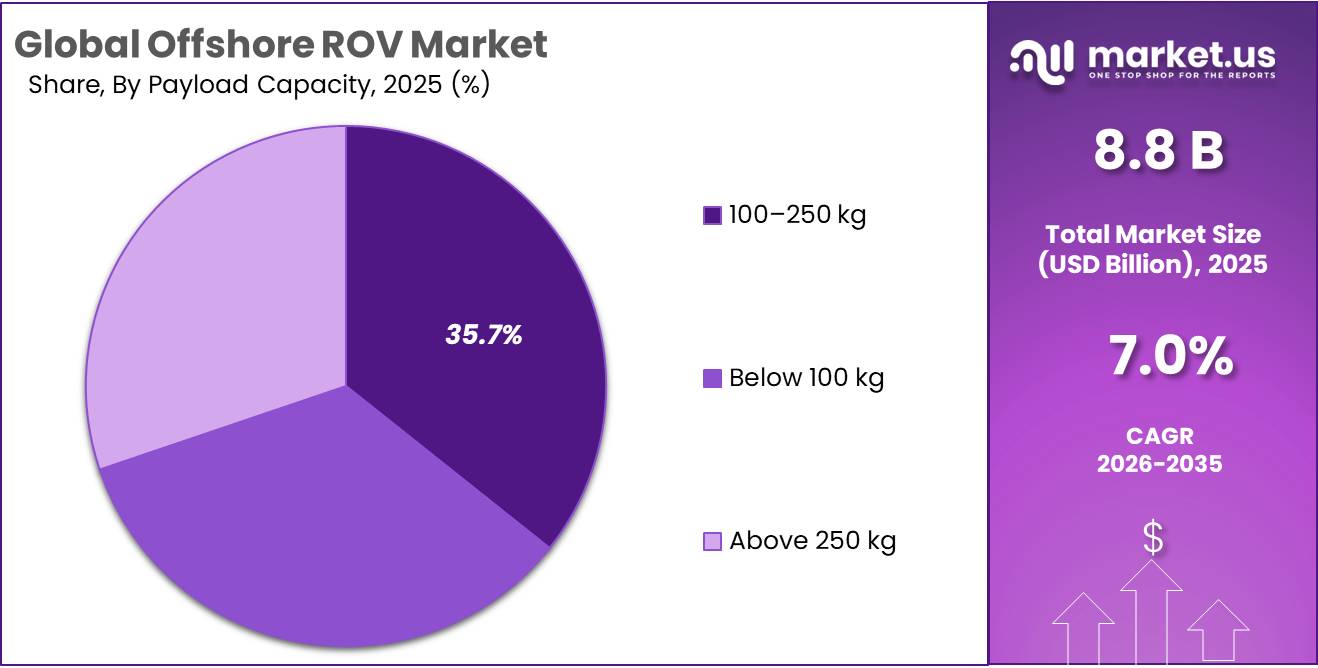
- 100–250 kg held a dominant market position, capturing more than a 35.00% share.
- Drilling and well-completion support held a dominant market position, capturing more than a 25.00% share.
- Offshore oil and gas held a dominant market position, capturing more than a 61.30% share.
- North America held a dominant position in the Offshore ROV Market, accounting for 33.20% of the market, with a reported value of USD 2.9 billion.
By Vehicle Class Analysis
Heavy / Work-Class ROVs Lead with a 34.00% Share in 2025, Supported by Demanding Offshore Operations
In 2025, “Heavy / work-class ROV” held a dominant market position, capturing more than a 34.00% share of the Offshore ROV Market by vehicle class. These remotely operated vehicles are designed for demanding underwater work, including subsea construction, drilling support, inspection, maintenance, and the handling of heavy tools. Their lifting capacity, powerful propulsion systems, and ability to carry specialized equipment make them suitable for complex offshore oil and gas operations.
Demand is supported by the need to inspect and maintain subsea infrastructure in deepwater environments, where sending divers can be difficult or unsafe. The US Bureau of Safety and Environmental Enforcement provides official information on offshore operations and subsea safety requirements, reflecting the importance of reliable underwater equipment. However, the 34.00% share is a market estimate supplied in the prompt, not a government statistic.
“Observation-class ROV” systems are used for underwater inspection, visual surveys, marine research, and the monitoring of offshore infrastructure. These vehicles typically carry cameras, lights, and sensors to capture underwater images and collect data without requiring divers to enter hazardous environments. In 2025, demand for observation-class ROVs was supported by offshore pipeline surveys, subsea structure inspections, vessel hull checks, and environmental monitoring.
The US Bureau of Ocean Energy Management classifies Class I ROVs as observation-only vehicles and Class II ROVs as vehicles capable of observation with a payload. NOAA also reports that certain ROV systems use a 300-metre tether, enabling remote inspection and observation underwater. Observation-class ROVs offer a practical solution for routine inspection, although their capabilities are more limited than those of heavy work-class vehicles designed for construction and maintenance.
By Propulsion / Power Type Analysis
Electro-hydraulic ROVs lead with a 42.00% market share in 2025, supported by their ability to perform demanding subsea tasks.
In 2025, “Electro-hydraulic ROV” held a dominant market position, capturing more than a 42.00% share. Electro-hydraulic remotely operated vehicles use electrical power for control and hydraulic systems to operate tools that require strong and controlled movement. This combination makes them suitable for offshore oil and gas activities such as subsea inspection, equipment maintenance, drilling support, and the handling of underwater tools.
Their ability to support tasks requiring greater force makes them useful in complex offshore environments, where equipment must work reliably at depth. The U.S. Bureau of Ocean Energy Management (BOEM) describes work-class ROVs as systems designed for demanding subsea operations, including construction and intervention work. The 42.00% figure is the market share supplied for this segment; government sources provide technical context rather than independently verifying that share.
Electric ROV systems are used for underwater observation, inspection, survey work, and selected subsea operations. They receive control signals from operators through a tether, which can also carry power and return video and other data. Their operating capabilities depend on the vehicle’s design, power system, depth rating, and onboard tools.
In 2025, electric ROVs remained relevant for applications where controlled underwater movement and reliable visual feedback were required. As a government example, the U.S. Navy’s CURV 21 remotely operated vehicle uses all-electric thrusters and has a stated operating depth of 20,000 feet and a lift capacity of 2,500 pounds. These figures describe that specific vehicle, not the entire electric ROV segment. No market-share percentage was provided for electric ROVs.
By Water Depth Analysis
Deepwater ROVs lead with a 44.60% share in 2025 as offshore operations require reliable subsea inspection and intervention.
In 2025, “Deepwater (1,000 to 3,000 metres)” held a dominant market position, capturing more than a 44.60% share. Remotely operated vehicles used at these depths support offshore inspection, drilling assistance, subsea equipment maintenance, and underwater surveys. They allow operators to view and assess equipment in places that are difficult or unsafe for divers to reach. Deepwater operations require vehicles and support systems designed to withstand high water pressure while maintaining stable control, communication, and video transmission.
The U.S. National Oceanic and Atmospheric Administration (NOAA) reports that its remotely operated vehicle Deep Discoverer is designed to reach depths of 6,000 metres, demonstrating the depth capability available in government-operated exploration systems. This is a specification for a particular ROV, not a market-wide statistic. The 44.60% share is the supplied market figure and is not independently confirmed by government data.
Shallow water (below 1,000 metres) ROVs are used to inspect underwater pipelines, offshore structures, vessel hulls, and subsea equipment. Their cameras, lights, and sensors help operators check for damage and collect visual information without sending divers into potentially hazardous conditions. In 2025, this segment remained important for offshore maintenance and survey tasks, particularly where smaller inspection vehicles can be deployed from vessels with less support equipment.
A U.S. Bureau of Ocean Energy Management report notes that small ROVs can be used for inspection and observation at depths of up to 300 metres, while medium vehicles can support drilling, construction, and pipeline inspection at depths of up to 1,000 metres. These are reported operating ranges for vehicle categories, not a market-share figure. No market share was provided for the shallow-water segment.
By Payload Capacity Analysis
ROVs with a 100–250 kg payload capacity lead with a 35.00% share in 2025, supporting offshore inspection and subsea work.
In 2025, “100–250 kg” held a dominant market position, capturing more than a 35.00% share. ROVs in this payload category can support offshore tasks that require cameras, sensors, inspection tools, and other equipment to be carried underwater. Their payload capacity helps operators select suitable equipment for subsea inspections, pipeline checks, drilling support, and maintenance work. These vehicles are valuable where the mission requires more than basic visual observation but does not need the heaviest work-class equipment.
Payload capacity alone does not determine performance, as depth rating, thruster power, and available tools also affect operating capability. The 35.00% market share is the figure supplied for this segment; government sources provide technical context but do not independently verify the market share.
Below 100 kg ROVs are suited to underwater visual inspections, marine surveys, and monitoring tasks that require cameras, lights, and lightweight sensors. Their lower payload capacity can make them a practical option when a mission does not require heavy tooling or large manipulation systems. In 2025, demand for these vehicles was supported by the need to inspect underwater structures and collect visual information while reducing the need for divers in hazardous conditions.
As a government example, the U.S. Navy’s MR2 HYDROS remotely operated vehicle has manipulators capable of handling tools and rigging up to 100 pounds, while operating at depths of up to 5,000 feet. This is a specific vehicle capability, not a market-wide payload statistic. No market-share figure was supplied for the below-100-kg segment.
By Application Analysis
Drilling and well-completion support leads with a 25.00% market share in 2025, driven by the need for reliable subsea operations.
In 2025, “Drilling and well-completion support” held a dominant market position, capturing more than a 25.00% share. Remotely operated vehicles support offshore drilling by helping crews inspect subsea equipment, check connections, monitor underwater operations, and assist with maintenance around wells. Their cameras, sensors, and specialist tools allow operators to assess conditions without relying solely on divers, particularly in deeper or more hazardous locations.
ROVs can also help investigate equipment problems and provide visual feedback during well-related work, supporting safer and more efficient operations. The U.S. Bureau of Safety and Environmental Enforcement (BSEE) documents the use of remotely operated and robotic systems for subsea inspection in offshore oil and gas environments. The 25.00% share is the supplied market figure; government sources support the application context but do not independently confirm the market share.
Construction support ROVs help offshore teams inspect seabed conditions, monitor underwater structures, and assist with installation and repair activities. They can carry cameras, sensors, and specialist tools to provide visual feedback and support tasks around subsea pipelines, foundations, and offshore energy infrastructure. In 2025, their role remained relevant as offshore projects required accurate underwater checks during construction and maintenance.
The U.S. Bureau of Ocean Energy Management (BOEM) identifies ROVs as equipment used in offshore renewable-energy projects for inspections and surveys, including checks on submarine cables and supporting structures. A BOEM-hosted technical report also describes general construction-support work at depths of up to 365 metres, with average depths below 200 metres in the cases covered. These figures relate to the report’s construction-support examples, not all ROV operations. No market-share figure was provided for this segment.
By End User Analysis
Offshore oil and gas leads with a 61.30% share in 2025, supported by subsea drilling, inspection, and maintenance needs.
In 2025, “Offshore oil and gas” held a dominant market position, capturing more than a 61.30% share. Remotely operated vehicles (ROVs) are widely used in offshore oil and gas operations to inspect subsea pipelines, monitor underwater equipment, support drilling activities, and assist with maintenance around offshore facilities. They help operators examine equipment in deep or hazardous waters without sending divers into difficult working conditions.
The need for reliable underwater inspection remains important as offshore production and subsea infrastructure require regular monitoring. According to the U.S. Bureau of Safety and Environmental Enforcement, oil production from the U.S. Outer Continental Shelf reached 714 million barrels in 2025, setting a new annual record. This official production figure highlights the scale of offshore activity that requires operational oversight, although it does not measure ROV use directly. The 61.30% market share is the supplied segment figure.
Offshore wind energy projects use ROVs to inspect turbine foundations, subsea power cables, and other underwater infrastructure during construction and maintenance. These vehicles provide video and sensor data that help project teams identify damage, check installation quality, and assess underwater conditions. In 2025, offshore wind development continued to provide an application for ROV technology as developers worked on large projects requiring reliable subsea inspection.
For example, the U.S. Bureau of Ocean Energy Management approved the Sunrise Wind project with capacity of up to 924 megawatts and authorization for up to 84 wind turbines. The project also requires associated offshore infrastructure, creating potential inspection needs for underwater equipment and cables. These figures describe the approved project, not the overall offshore wind ROV market. No market-share figure was provided for this end-user segment.
Key Market Segments
By Vehicle Class
- Observation-class ROV
- Light work-class ROV
- Medium work-class ROV
- Heavy / work-class ROV
- Intervention-class ROV
- Trenching ROV
- Hybrid ROV / AUV systems
By Propulsion / Power Type
- Electric ROV
- Hydraulic ROV
- Electro-hydraulic ROV
By Water Depth
- Shallow water (below 1,000 metres)
- Deepwater (1,000 to 3,000 metres)
- Ultra-deepwater (above 3,000 metres)
By Payload Capacity
- Below 100 kg
- 100–250 kg
- Above 250 kg
By Application
- Drilling and well-completion support
- Construction support
- Inspection, repair, and maintenance (IRM)
- Offshore inspection and survey
- Subsea intervention
- Salvage and decommissioning
- Other applications
By End User
- Offshore oil and gas
- Offshore wind energy
- Naval and defence
- Scientific research and oceanography
- Aquaculture
- Underwater mining and exploration
- Ports, harbours, and marine infrastructure
Driver Analysis
Deepwater Project Execution — +1.4 pp
Deepwater development provides the strongest identifiable expansion mechanism because subsea installation, commissioning, drilling support, and subsequent intervention require repeated ROV deployment rather than a single equipment purchase. Petrobras’ November 2025 business plan established a US$109 billion investment opportunity portfolio for 2026–2030, comprising US$91 billion in the implementation target portfolio and US$18 billion under evaluation; importantly, only US$81 billion constituted the implementation base, while another US$10 billion remained subject to financing assessments. Within the implementation target portfolio, exploration and production projects represented US$69.2 billion, with eight new production systems scheduled by 2030, seven already contracted, and 11 Búzios floating production, storage and offloading units targeted by 2027.
These distinctions matter: total corporate capital expenditure is not equivalent to committed subsea expenditure, and none should be counted directly as ROV revenue. Nevertheless, contracted production systems create a more credible forward workload than unapproved discoveries, supporting investment in work-class vehicles, intervention tooling, spares, and locally positioned technical teams. Pricing can reinforce this demand mechanism, but utilization remains decisive: Oceaneering reported fourth-quarter 2025 ROV revenue per utilized day of US$11,550, up 7% year over year, while utilization fell from 66% to 62%, illustrating that stronger rates do not necessarily indicate more operating days.
The +1.4 pp contribution assumes a 35% construction-and-drilling revenue exposure receiving a 4.0-percentage-point incremental annual growth uplift; both inputs are analyst assumptions. Commercially, the opportunity favors multiyear project-support agreements and standardized tooling packages, while investment delays, available fleet capacity, and customer procurement discipline limit the case for indiscriminate fleet expansion.
Drivers Impact Analysis
| Driver | (~) % Impact on CAGR | Geographic Relevance | Impact Timeline |
|---|---|---|---|
| Deepwater project execution | +1.4 pp | Brazil core; Guyana, US Gulf, West Africa | Medium term (2–4 years) |
| Recurring integrity inspection | +1.0 pp | Norway–UK–EU pipeline corridors; US Gulf | Short term (≤ 2 years) |
| Offshore wind subsea work | +0.7 pp | China, UK, Germany, Taiwan, France | Medium term (2–4 years) |
| Resident and remote robotics | +0.6 pp | Norway core; UK–EU offshore markets | Long term (≥ 4 years) |
| Decommissioning execution | +0.5 pp | UK continental shelf core; Norway spillover | Medium term (2–4 years) |
Restraint Analysis
Upstream Spending Volatility — −0.8 pp
Offshore ROV demand remains exposed to exploration-and-production capital allocation because drilling support, subsea installation, and commissioning depend on customers sanctioning and executing projects rather than merely maintaining reserves. The International Energy Agency’s 2025 assessment projected a 6% reduction in upstream oil investment and an approximately 4% decline in combined upstream oil-and-gas investment to just under US$570 billion; approximately 40% of that expenditure was directed toward slowing production declines at existing fields.
These were contemporaneous investment estimates—not final expenditure outcomes or an offshore-specific contraction—and should not be applied uniformly to deepwater markets. Direct operating evidence nevertheless demonstrates regional vulnerability: Oceaneering’s second-quarter 2026 disclosure identified lower US Gulf activity, partly offset by stronger European and African activity, while its earnings presentation reported that drilling support represented 64% of utilized ROV days versus 36% for vessel-based services. The company also reported ROV contracts on 82 of 139 contracted floating rigs, demonstrating how a major supplier’s activity remains linked to a relatively concentrated offshore drilling customer base.
The modeled −0.8 pp deduction assumes 40% of market revenue experiences a 2.0-percentage-point annual growth shortfall relative to an uninterrupted project-execution scenario; these are analytical assumptions rather than measured industry shares. The business consequence is delayed mobilization and lower visibility for replacement vehicles, tooling, and recruitment, particularly where customers defer discretionary construction while preserving essential integrity work; multiyear contracts can moderate this exposure, but do not eliminate project-start or rig-scheduling risk.
Restraint Impact Analysis
| Restraint | (~) % Impact on CAGR | Geographic Relevance | Impact Timeline |
|---|---|---|---|
| Upstream spending volatility | −0.8 pp | US Gulf; Brazil; West Africa | Short term (≤ 2 years) |
| Fleet underutilization | −0.7 pp | North Sea; US Gulf | Short term (≤ 2 years) |
| Capital-cost burden | −0.5 pp | Norway; UK; global contractors | Medium term (2–4 years) |
| Offshore wind deferrals | −0.4 pp | UK core; European spillover | Medium term (2–4 years) |
| Skills and assurance friction | −0.3 pp | UK; Norway; global deployment hubs | Medium term (2–4 years) |
| Remote-service cannibalization | −0.3 pp | Norway; UK–EU pipeline corridors | Long term (≥ 4 years) |
Opportunity Analysis
Cable-Response Subscriptions — +0.6 pp
The opportunity is to sell contracted subsea-response readiness across multiple cable owners, rather than compete only for individual survey or repair campaigns; existing cable construction and inspection are baseline activities, whereas shared availability retainers, pre-agreed mobilization protocols, and evidence-preservation services constitute additional monetization.
The European Commission’s February 2026 cable-security package allocated €347 million across strategic submarine-cable measures, including €60 million for repair-capacity calls, €20 million for SMART monitoring equipment, and €267 million for priority projects in 2026–2027; an initial €20 million repair-module call formed part of the repair allocation, not an additional funding pool. Its framework identified 13 Cable Projects of European Interest areas across three five-year stages to 2040, providing a procurement pathway rather than guaranteed ROV orders.
A proposed commercial pilot—not an observed market price—could aggregate 10 cable owners paying €150,000 annually, creating €1.5 million in gross readiness revenue before incident work; against an assumed €1.0 million annual cost for dedicated equipment readiness, training, insurance, and coordination, that leaves €0.5 million before central overhead, financing, and taxes, provided vessel access is separately contracted and incident mobilization remains chargeable.
The modeled +0.6 pp assumes a 10% addressable market-revenue exposure achieves a 6-percentage-point incremental annual growth uplift from genuinely new readiness and response services. Entry should prioritize cable-owner consortia, repair contractors, and port-based equipment partnerships, with explicit exclusions for simultaneous incidents and weather interruptions; grant receipts, ordinary repair spending, and vessel revenue cannot be counted as incremental ROV-market demand.
Opportunity Impact Analysis
| Opportunity | (~) % Potential CAGR Upside | Geographic Relevance | Execution Window |
|---|---|---|---|
| Cable-response subscriptions | +0.6 pp | Baltic; North Sea; EU Atlantic | Short term (≤ 2 years) |
| CO₂-storage assurance | +0.4 pp | Norway core; UK–EU expansion | Medium term (2–4 years) |
| Inspection-data subscriptions | +0.5 pp | Norway; UK; US Gulf; Brazil | Short term (≤ 2 years) |
| Shared resident-ROV hubs | +0.5 pp | Norway; UK North Sea | Medium term (2–4 years) |
| Modular tooling-as-a-service | +0.3 pp | North Sea; Brazil; US Gulf | Medium term (2–4 years) |
Challenges Analysis
Lifecycle Reliability Management — −0.6 pp
Managing reliability across vehicles, umbilicals, tether-management systems, and launch-and-recovery equipment is a continuous engineering challenge because system integrity depends on installation quality, maintenance execution, and operational sequencing—not simply passing an acceptance test. In June 2025, IMCA circulated BSEE Safety Alert 499 describing an ROV dropped during recovery after its umbilical termination failed: investigators identified a faulty resin case and improperly centered and distributed armored strands, despite the connection having previously passed a pull test; the vehicle was recovered, with no personnel injury or seabed-asset damage reported.
A separate July 2024 incident involved contaminated grease, slow latch movement, inadequate visibility of the locked-position indicator, and an umbilical severed by the docking mechanism, demonstrating that mechanical design, human verification, and maintenance can interact to defeat recovery safeguards. These incident reports establish credible failure mechanisms, not an industry-wide failure rate. Illustratively, three unplanned stoppages lasting 36 hours each consume 108 hours, or 4.5 days, equivalent to 2.25% of a 200-day operating allocation before investigation or remobilization; this is a sensitivity assumption, not observed fleet performance.
The modeled −0.6 pp drag assumes a 30% revenue exposure experiences a 2-percentage-point annual growth shortfall from reliability-related execution losses. Unlike a capital shortage or legal prohibition, the challenge does not prevent ongoing sales; it requires serial-number-level component histories, termination-quality records, condition-based maintenance, and recovery-system verification to preserve throughput. Corporate mitigation should prioritize elimination of repeat failure modes and reduced repair time rather than interpreting higher spare-parts expenditure alone as improved resilience.
Challenges Impact Analysis
| Challenge | (~) % CAGR Friction | Geographic Relevance | Mitigation Horizon |
|---|---|---|---|
| Lifecycle reliability management | −0.6 pp | US Gulf; Brazil; North Sea | Medium term (2–4 years) |
| Survey data interoperability | −0.4 pp | North Sea; Brazil; US Gulf | Medium term (2–4 years) |
| Remote control cyber resilience | −0.4 pp | Norway; UK; EU offshore hubs | Long term (≥ 4 years) |
| Distributed spares logistics | −0.4 pp | Europe–APAC corridors; Brazil; West Africa | Medium term (2–4 years) |
| Hybrid workforce capability | −0.3 pp | UK; Norway; Brazil; US Gulf | Long term (≥ 4 years) |
| Environmental operating variability | −0.5 pp | North Sea; Brazil; US Gulf | Long term (≥ 4 years) |
Geopolitical Impact Analysis
Geopolitical Impact of the Iran War on the Offshore ROV Market
The ongoing Iran war in 2026 has increased uncertainty across offshore oil and gas operations, particularly in the Middle East. Military threats, shipping restrictions, and potential damage to energy infrastructure can delay offshore projects, disrupt equipment deliveries, and raise insurance, fuel, and vessel operating costs. These pressures may affect ROV deployment schedules because underwater inspection and maintenance depend on support vessels, trained crews, and reliable access to offshore sites.
The International Energy Agency reported that oil flows through the Strait of Hormuz averaged only 7.6 million barrels per day in August 2026, approximately 13.1 million barrels per day below pre-war levels. Source: IEA. For the Offshore ROV Market, higher energy prices may encourage investment in production from alternative regions, creating future demand for subsea inspection and maintenance. However, security risks and project delays could restrict near-term spending.
ROV suppliers may resond by diversifying supply chains, strengthening equipment availability, and prioritizing safer operating locations. Overall, the conflict creates short-term operational challenges while reinforcing the importance of reliable subsea infrastructure and remote inspection technologies.
Regional Insights
North America: Dominant Regional Market
In 2025, North America held a dominant position in the Offshore ROV Market, accounting for 33.20% of the market, with a reported value of USD 2.9 billion. The region benefits from established offshore oil and gas operations, deepwater developments in the Gulf of Mexico, and demand for subsea inspection, drilling support, and maintenance services.
The United States Bureau of Safety and Environmental Enforcement reported that offshore oil production on the Outer Continental Shelf reached a record 714 million barrels in 2025, supporting the need for reliable underwater inspection and intervention technologies. This activity creates opportunities for work-class ROVs used to inspect subsea wells, pipelines, and offshore production equipment.
The region’s offshore wind industry also offers additional opportunities for ROV providers. According to the Global Wind Energy Council’s Global Offshore Wind Report 2025, Asia-Pacific accounted for approximately 53.5 GW, or 58% of global offshore wind capacity at the end of 2025. This expanding installed base creates a continuing need to inspect underwater foundations, cables, and supporting structures.
In 2025, North America held a dominant position in the Offshore ROV Market, accounting for 33.20% of the market, with a reported value of USD 2.9 billion. The region benefits from established offshore oil and gas operations, deepwater developments in the Gulf of Mexico, and demand for subsea inspection, drilling support, and maintenance services. The United States Bureau of Safety and Environmental Enforcement reported that offshore oil production on the Outer Continental Shelf reached a record 714 million barrels in 2025, supporting the need for reliable underwater inspection and intervention technologies. This activity creates opportunities for work-class ROVs used to inspect subsea wells, pipelines, and offshore production equipment.
The region’s offshore wind industry also offers additional opportunities for ROV providers. According to the Global Wind Energy Council’s Global Offshore Wind Report 2025, Asia-Pacific accounted for approximately 53.5 GW, or 58% of global offshore wind capacity at the end of 2025. This expanding installed base creates a continuing need to inspect underwater foundations, cables, and supporting structures.
Key Regions and Countries Insights
- North America
- US
- Canada
- Europe
- Germany
- France
- The UK
- Spain
- Italy
- Rest of Europe
- Asia Pacific
- China
- Japan
- South Korea
- India
- Australia
- Rest of APAC
- Latin America
- Brazil
- Mexico
- Rest of Latin America
- Middle East & Africa
- GCC
- South Africa
- Rest of MEA
Key Players Analysis
Oceaneering International, Inc. is a major offshore ROV service provider, supplying underwater robotics for drilling support, subsea construction, pipeline inspection, and maintenance. In 2025, the company operated a fleet of 250 work-class ROVs, while its Subsea Robotics segment generated approximately USD 855.2 million in revenue. ROV utilization reached 65%, compared with 67% in 2024. The company also upgraded 16 conventional work-class ROV systems during 2025, supporting fleet modernization and operational reliability. Its capabilities position it strongly in offshore energy services.
TechnipFMC plc supports offshore subsea developments through integrated engineering, subsea production systems, and underwater intervention technologies. In 2025, the company recorded total revenue of approximately USD 9.93 billion, while its Subsea segment generated USD 8.67 billion. Subsea orders reached approximately USD 10.06 billion, and year-end subsea backlog stood at USD 15.87 billion. These figures reflect strong activity in subsea infrastructure and offshore project execution, supporting demand for underwater inspection and intervention capabilities.
Subsea 7 S.A. provides offshore engineering, subsea construction, installation, and inspection-related services for energy projects. Its capabilities include remotely operated underwater vehicles used for survey, construction support, and subsea intervention. In 2025, the company reported total revenue of approximately USD 7.1 billion, with adjusted earnings before interest, taxes, depreciation, and amortization of approximately USD 1.48 billion. Its order intake reached USD 9.0 billion, while its order book approached USD 14 billion. These figures demonstrate its capacity to support complex offshore projects and subsea infrastructure development.
Top Key Players Outlook
- Oceaneering International, Inc.
- TechnipFMC plc
- Subsea 7 S.A.
- Saipem S.p.A.
- Fugro N.V.
- DOF Group ASA
- DeepOcean Group Holding BV
- Forum Energy Technologies, Inc.
- Saab AB / Saab Seaeye Ltd.
- Kongsberg Maritime
- Helix Energy Solutions Group, Inc.
- IKM Gruppen AS / IKM Subsea AS
- Exail Technologies
- Teledyne Marine
- Soil Machine Dynamics Ltd. (SMD)
Recent Developments
- In July 2025, Saipem and Subsea7 signed a merger agreement, with the combined group expected to have an order backlog of approximately €43 billion and annual revenue of around €21 billion, subject to approvals and completion.
- In April 2026, Fugro commissioned a new ROV test pool in Singapore to support equipment testing, system integration, calibration, and pre-deployment checks, helping identify technical issues before offshore operations. The company also reported EUR 1.85 billion in revenue for 2025 and capital expenditure of approximately EUR 248 million, reflecting continued investment in its equipment and vessel fleet despite a challenging offshore market.
Report Scope
| Report Features | Description |
|---|---|
| Market Value (2025) | USD 8.8 Bn |
| Forecast Revenue (2035) | USD 17.3 Bn |
| CAGR (2026-2035) | 7.0% |
| Base Year for Estimation | 2025 |
| Historic Period | 2020-2024 |
| Forecast Period | 2026-2035 |
| Report Coverage | Revenue Forecast, Market Dynamics, Competitive Landscape, Recent Developments |
| Segments Covered | By Vehicle Class (Observation-class ROV, Light work-class ROV, Medium work-class ROV, Heavy / work-class ROV, Intervention-class ROV, Trenching ROV, Hybrid ROV / AUV systems), By Propulsion / Power Type (Electric ROV, Hydraulic ROV, Electro-hydraulic ROV), By Water Depth (Shallow water (below 1,000 metres), Deepwater (1,000 to 3,000 metres), Ultra-deepwater (above 3,000 metres)), By Payload Capacity (Below 100 kg, 100–250 kg, Above 250 kg), By Application (Drilling and well-completion support, Construction support, Inspection, repair, and maintenance (IRM), Offshore inspection and survey, Subsea intervention, Salvage and decommissioning, Other applications), By End User (Offshore oil and gas, Offshore wind energy, Naval and defence, Scientific research and oceanography, Aquaculture, Underwater mining and exploration, Ports, harbours, and marine infrastructure) |
| Regional Analysis | North America – US, Canada; Europe – Germany, France, The UK, Spain, Italy, Rest of Europe; Asia Pacific – China, Japan, South Korea, India, Australia, Singapore, Rest of APAC; Latin America – Brazil, Mexico, Rest of Latin America; Middle East & Africa – GCC, South Africa, Rest of MEA |
| Competitive Landscape | Oceaneering International, Inc., TechnipFMC plc, Subsea 7 S.A., Saipem S.p.A., Fugro N.V., DOF Group ASA, DeepOcean Group Holding BV, Forum Energy Technologies, Inc., Saab AB / Saab Seaeye Ltd., Kongsberg Maritime, Helix Energy Solutions Group, Inc., IKM Gruppen AS / IKM Subsea AS, Exail Technologies, Teledyne Marine, Soil Machine Dynamics Ltd. (SMD) |
| Customization Scope | Customization for segments, region/country-level will be provided. Moreover, additional customization can be done based on the requirements. |
| Purchase Options | We have three licenses to opt for: Single User License, Multi-User License (Up to 5 Users), Corporate Use License (Unlimited User and Printable PDF) |








